Lazy Portfolios 2 – Benchmarks and Diversifiers

Today’s post is the second in a series of posts about of Lazy Portfolios. We’ll be putting together a benchmark to which we can compare such portfolios.
My portfolio
My base portfolio is a passive global multi-asset portfolio made mostly from low-cost ETFs.
- I use 54 asset classes, though 17 of these are covered by non-listed assets (mostly property and defined-benefit pensions, but also cash and VCTs).
So I actually invest in a minimum of 37 funds.
The reason I have so many is that my allocation is based around volatility parity.
- Anything that can reduce volatility without significantly impacting returns should be added to the portfolio, to improve its Sharpe Ratio.
- Note that this doesn’t mean that I believe in the Efficient Markets Hypothesis, only in correlations and returns.
The other key assumption that I support is that past returns (of an asset class) are indicative of its long-term future returns.
- In the short-term, things like momentum and mean reversion will obscure this picture.
A true volatility parity portfolio is quite safe (and low return), with more than 60% in bonds.
- In order to hit my target / fail safe withdrawal rate of more than 3% pa, I need to cap the bond allocation to 20% – this allows for 75% stocks and 5% True Alternatives.
I also tweak the default allocation to accommodate global ITs and themed funds, and to support some home bias.
- I plan to live and spend in the UK, so I want to limit FX exposure.
- I’m also keen to avoid the “away bias” of very high default allocations to the US.
Lazy portfolios
Lazy portfolios are pretty much at the opposite end of the spectrum.
- Typically they involve between two and four funds, though some have more.
Their key advantage is simplicity.
- This doesn’t matter much to me – I don’t see the big difference between buying four ETFs and a dozen, or even 50.
But novice investors and those with small portfolios might find them useful.
For those afraid of the volatility of stocks, they promise “all-weather” performance and smaller drawdowns.
- But this is often produced through a low allocation to stocks, which will lead to lower performance in the long-run.
Analysis
Probably the most important feature of a portfolio is its expected return.
- The big drivers of returns are stocks, so we need to look at the stock allocation first.
As well as asset classes, we need to be aware of factors for outperformance, particularly in stocks.
- These include small size, value, momentum and low beta.
- The only one of these which is easy to incorporate into a simple passive portfolio is small size.
The second key feature of a portfolio is its volatility – the variability of returns.
- This is often used as a proxy for risk.
Investors of a robotic disposition can simply take a high allocation to equities and wait out any crashes.
- Most people find this very difficult, and like diversified portfolios with less volatility (see below).
- Note however that the least protection from diversification is available when you need it most, in a severe stock crash.
Returns are broadly proportional to volatility.
- In order to get good returns, you need to accept more volatility.
So correlations between assets – and in particular, correlations with the primary return-producing asset, stocks – are key.
- Adding poorly correlated assets can reduce the volatility of a portfolio without significantly affecting returns.
This leads to three common portfolios:
- The Max SR portfolio (volatility optimised)
- We’ll simplify this to be 60% bonds, 40% stocks, which is too conservative and low return for most people.
- The Max Return portfolio, which is 80% stocks and 20% bonds
- I swap 5% of stocks for True Alternatives, to leave me with 75% stocks
- A Compromise portfolio suitable for a wide range of people,
- This might be 60% stocks, 35% bonds and 5% Alternatives.
So we need standardised versions of these three portfolios that we can compare the lazy allocations to.
Market cap weighting
Another way to look at the volatility parity approach to portfolio construction is to think about market cap weighting – the default way of constructing index funds.
Market-cap weighting is the worst way to systematically allocate money as it over-weights the most expensive parts of a portfolio and underweights the cheapest.
- This is why more complicated portfolios have better risk-adjusted returns.
The simplest alternative approach is equal weighting, which leads to the max SR portfolio.
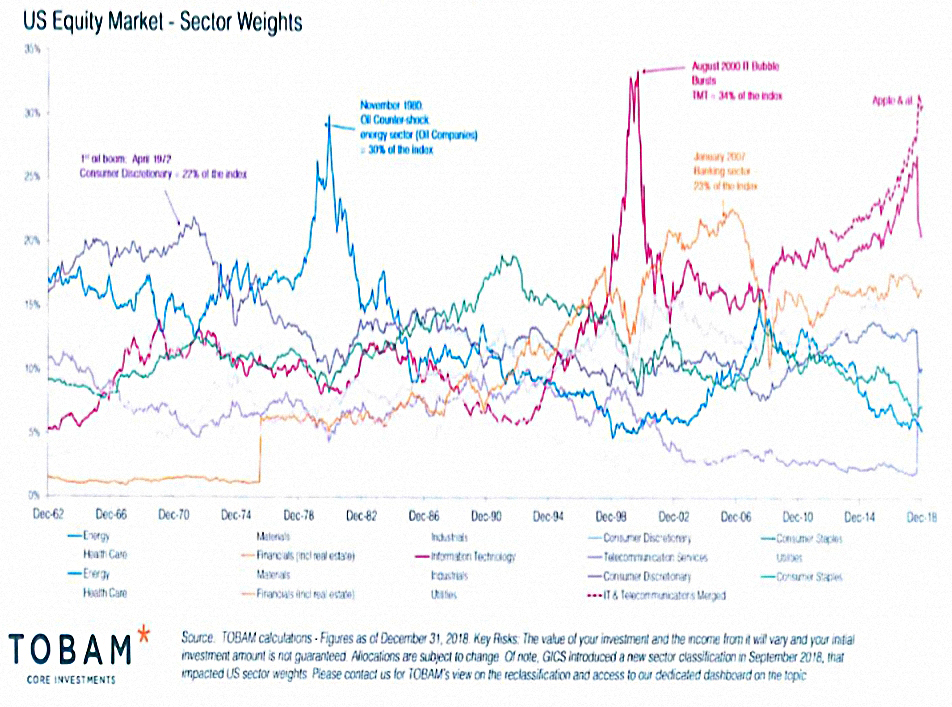
Market-cap weighted portfolios currently have a dangerous overweight to the US, which now makes up around 55% of the global equity market.
Benchmark
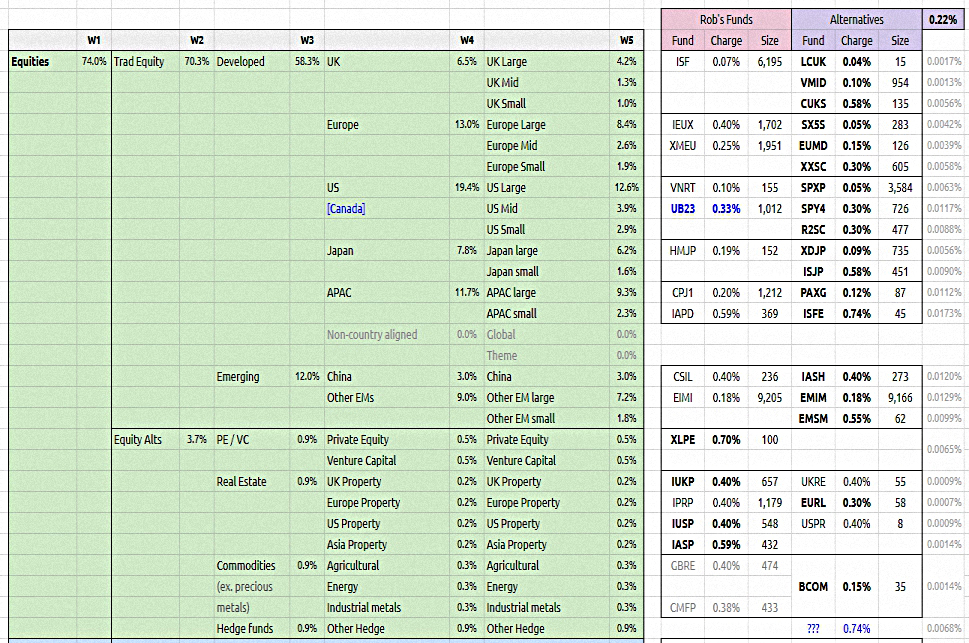
The three charts below show the volatility parity approach in action.
- They are derived from Rob Carver’s book Smart Portfolios, which we looked at last year.
First, equities:
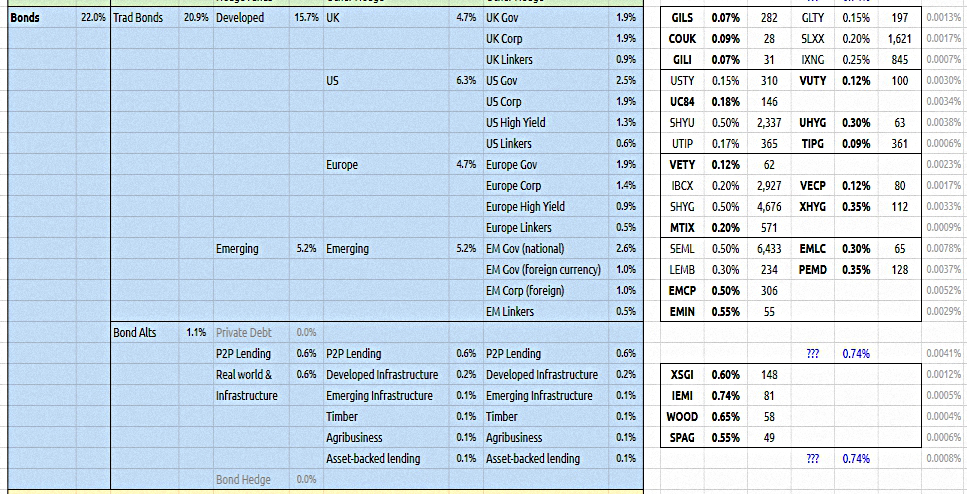
Next, bonds:
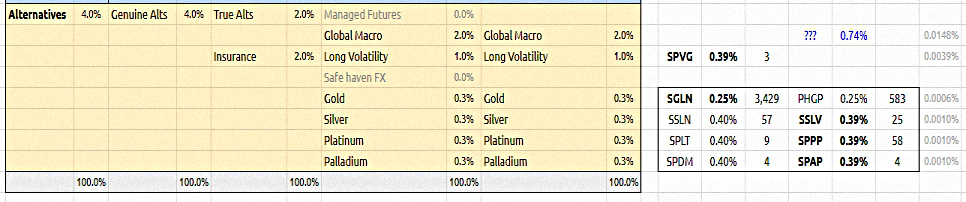
And finally, alternatives:
I run a tweaked version of this portfolio, but I don’t think that it’s the best comparison for a lazy portfolio of a few funds.
- We need something along the same lines, but with fewer funds.
Then we can compare the lazy allocations to our simplified portfolios.
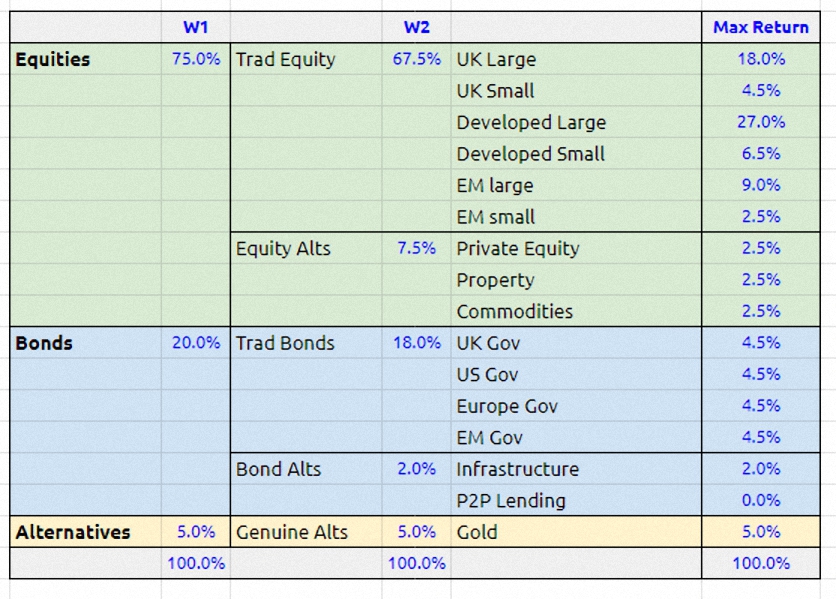
The best I could come up with was a 15-fund portfolio.
There are six equity funds:
- I’ve split the stock universe into UK, Developed and Emerging.
- I need to keep UK separate to allow for home bias, but lumping all the developed nations together means we’ll suffer a bit from away bias (US overweight).
- I’ve split each “region” into large and small cap.
There are three equity alts.
I’ve split bonds into four regions, and stuck to government bonds as these are the best diversifiers of stocks.
- Leaving out other types of bond will push down returns a little.
- I would like to have included inflation-linked bonds, but that would mean another four funds.
We only need one bond alt (infrastructure) for this max return benchmark, but we’ll need another (P2P lending) for the next stage.
There is just one true alternative asset – gold.

This chart adds two more benchmarks:
- The Max SR benchmark, and
- The Compromised benchmark.
They have been derived from the max return benchmark by varying the allocations to stocks and bonds.
- Note that the two new benchmarks each include 16 funds rather than 15.
The idea is that we will compare each lazy portfolio to the three benchmarks in order to discover which type of investor it serves best.
Risks
Before we start to look at lazy portfolios (in the next article), let’s take a moment to consider why various diversifying assets are typically included in lazy portfolios.
- What risks are we trying to protect against?
Here’s my list:
- A stock market crash (recession / negative growth)
- Changes in interest rates
- Inflation
- Deflation
Some lazy portfolios will claim to additionally get you through famine, pestilence and war, but I don’t think that’s a reasonable target for an investment portfolio.
- The best you can do is a global diversification, which means that so long as the manifestation of the four horsemen is localised rather than global (and not in your locale) you should get by.
I’m not convinced that you can adequately protect against my, list either:
- Stocks are the driver of returns, and stock markets crash periodically.
Again, the best advice is diversification – globally, and to an extent across asset classes – to dull the pain slightly.
- I also like to hold some of my bond allocation as cash, to get me through the worst of a bear market without selling stocks.
It should also be noted that economic conditions are not equally likely.
- Growth with moderate inflation is the default, and here stocks prosper.
Recent history has too main features which are atypical:
- A 30-year bull market in bonds as inflation and interest rates fell.
- Very low interest rates and QE over the last 10 years.
Diversifiers
Let’s take a look at some of the diversifying assets that lazy portfolios are fond of:
- Inflation-linked bonds (linkers)
- They do offer protection against inflation, but at the cost of low real returns.
- And if interest rates rise more sharply than expected, they may not protect against inflation – inflation without higher interest rates is not so common.
- Relative to equities, linkers perform best under low inflation or deflation (current QE circumstances excepted) or with very high inflation.
- Linkers (in the UK) also have a duration problem – an average duration of 23 years means their prices are very sensitive to interest rate changes.
- Gold
- Gold is often seen as an inflation hedge, but under many scenarios, stocks (over the long-term), commodities and property do just as well.
- The difference is that gold has no yield, and may have holding costs.
- Gold should protect against the devaluation of your local currency through money printing, but it has not performed particularly well since the 2008 crisis.
- Protection against local devaluation could also be achieved through a global diversified stock portfolio.
- Gold does not protect against deflation.
- Real assets – property, forestry and commodities
- These typically do well when growth is good but inflation is high – too high for stocks to prosper.
- Commodities also do relatively well under stagflation (high inflation and low growth).
These details are not crucial.
- The main point is that it isn’t possible to produce high and stable returns under all conditions.
Long-term investors should stick with stocks as the core of their portfolio, using diversifiers (bonds and true alternatives) to smooth their path a little.
- So we will be measuring the lazy portfolios on how well they perform this task, rather than on the specific diversifiers they use.
Next steps
In the next article we’ll look at one-fund portfolios, starting with a couple of Vanguard trackers.
- Until next time.
Mike Rawson
Mike is the owner of 7 Circles, and a private investor living in London. He has been managing his own money for 40 years, with some success.


Are you familiar with Bernstein’s four horsemen of Risk: Inflation, Deflation, Confiscation and Devastation, see e.g.
https://retirementresearcher.com/inflation-deflation-confiscation-devastation-the-four-horsemen-of-risk/
Sure, but protection against all conceivable risk is not what this series is about. If you plan for the worst, then in most circumstances you will pay a price (in terms of mediocre performance).
I want to get a handle on how sub-optimal all of the lazy portfolios are (compared to a generalised version of my own allocation) and find out how many funds you need as a minimum in order to get close enough to optimal that further complication becomes a matter of personal taste.