CTA Replication – Rabener

Today’s post looks at three articles from Nicolas Rabener on CTA replication.
Contents
Rabener

We have looked at the work of Nicolas on several previous occasions.
- He runs the analysis firm Finomial, which used to be called Factor Research.
In November 2022, he wrote a series of three articles about Commodity Trading Advisors or CTAs.
- The aim of the series was to look at how to replicate the performance of these somewhat opaque (and in the UK, difficult to access) funds.
CTA Replication
The first article is called “Creating a CTA from Scratch”.
CTAs have been around for a long time, and have a good track record.
- Nicolas notes that CTAs became more popular in 2022 when their positive returns stood out against a backdrop of losses for stocks and bonds (and crypto).
CTAs are primarily trend-following funds which use futures to go long and short in many markets.
The goal is to provide diversification benefits by offering uncorrelated positive returns to traditional asset classes.
In the US these strategies are also available in some ETFs.
- The AUM of these ETFs increased from $200< to $1 bn over the 12 months to the writing of the article.
Nicolas includes 11 bond, 5 equity, 19 currency, and 24 commodity markets (( 59 in total – some CTAs use as many as 200 markets )) and defines a positive trend as a positive 12-month rolling return (( A negative trend is indicated by the opposite ))
- Rebalancing is monthly and trades are entered after a delay of one day (but transaction costs are excluded).
The four categories (bond, stock, currency and commodities) are grouped into sub-indices and then equally weighted in the fund.
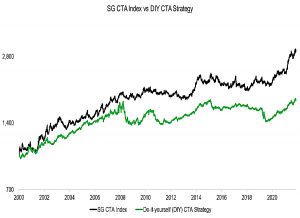
This first attempt broadly follows the SG CTA index but underperforms it (from 2000 to 2022).
Leverage
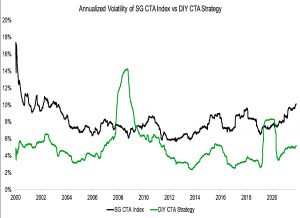
The DIY CTA has only 5% volatility, compared to 8% for the SG index.
- The index has lower volatility than most individual CTAs because it combines them together.
The DIY CTA has higher volatility during the stock market crashes of 2008 and 2020, which Nicolas attributes to the fixed 25% equity exposure.
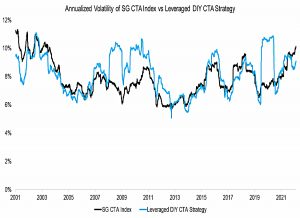
Step 2 in the DIY approach is to match the volatility of the four asset classes in the DIY CTA to that of the SG index, using leverage.
- Now the volatility profiles are much more similar.
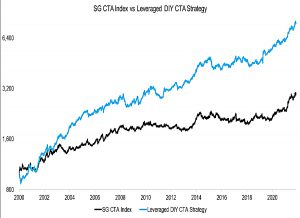
The performance of the leveraged DIY CTA is also much improved (before costs).
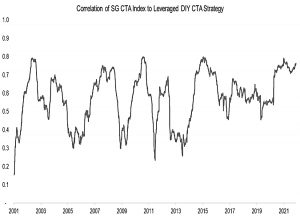
The correlation between the Leveraged DIY CTA (LDC) and the SG index averages 0.6, but has been closer to 0.8 in recent years.
- It’s a start, but we’re not close enough yet (although the LDC could work as an uncorrelated overlay to a passive long portfolio).
Costs
In the second article (“Creating a CTA from Scratch- II”), Nicolas adds costs to the LDC.
We assume a management fee of 2% and a performance fee of 20% above a high watermark, as well as 0.10% transaction costs per trade.
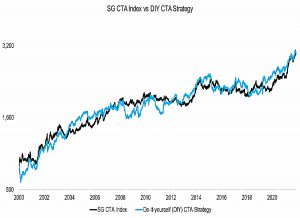
Performance is now a pretty good match for the SG index.
Asset classes
In the next section, Nicolas breaks down how the LDC works.
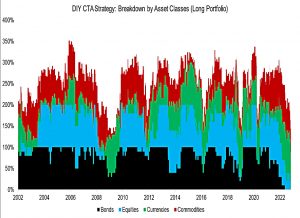
The long portfolio averaged 79% bonds, 66% stocks, 59% commodities and 49% currencies over 20 years.
Given that bond and stock markets were mostly rising through this period, this exposure is unsurprising. There was also a bull market in commodities fueled by the rise of the Chinese economy, but also a long bear market between 2012 to 2020.
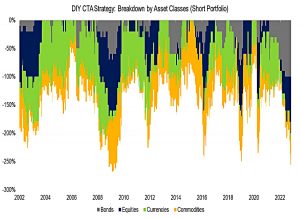
The short portfolio averaged 51% currencies, 41% commodities, 34% stocks and 21% bonds.
- All eleven bond markets went short in 2022.
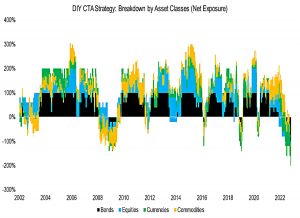
Netting off the two portfolios highlights the crisis periods when the portfolio is net short.
Return contribution
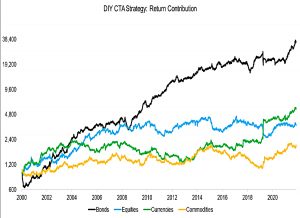
Most returns can be contributed to bonds, which generated a CAGR of 17.7%, compared to 8.3% for currencies, 6.0% for equities, and 3.2% for commodities.
A cynical investor might argue that CTAs were a levered bet on bonds, similar to the criticism of risk parity, but CTAs made money off bonds in 2022 by shorting them.
Factors
In the third article (“Replicating a CTA via Factor Exposures”), Nicolas swaps from the bottom-up approach of copying the CTA construction process to a top-down replication using factor exposure analysis.
- He uses just four asset classes – US stocks, US Treasuries, commodities and the US Dollar (all available via ETFs). (( In the US, at least – I don’t know if there is a UK ETF for the Dollar index ))
The first step is a regression analysis of the SG Index to determine the factor betas for the four asset classes.
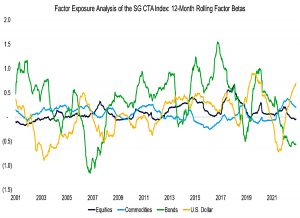
The betas of bonds and the dollar are higher than the others, reflecting the lower volatility of these asset classes.
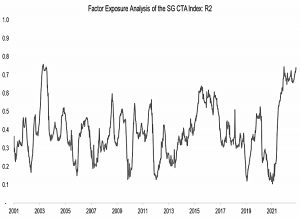
The R2 over time is low with an average of 0.39 for the last 20 years, which implies that the four asset classes can only moderately explain the returns of the SG CTA Index.
DIY CTA Factor Index
Nicolas creates the DIY CTA Factor Index (DCFI) by using the sign of the factor betas for each asset class as a signal to go long or short.
- Rebalancing is monthly with a day’s delay, and leverage is used to match each of the asset classes to the 8% volatility of the SG CTA Index.
- Transaction costs are ignored.
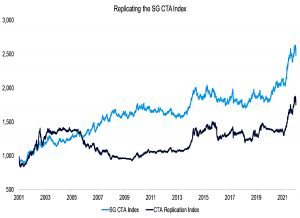
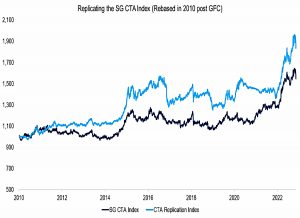
This is only a moderate success – the DCFI has a CAGR of 2.7%, compared to 4.4% for the SG Index.
Both indices had similar trends in performance between 2001 and 2005, then diverged significantly during the global financial crisis, and then converged again from 2010 onwards.
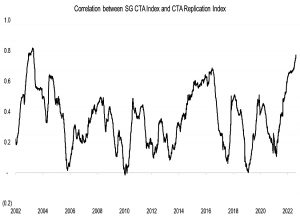
The correlation of the DCFI with the SG index is only 0.34, compared to 0.6 for the bottom-up LDC.
If we would use all the 59 indices used in the bottom-up approach, then the correlation would likely be significantly higher.
However, both DIY CTA approaches have close to zero correlation to stocks, which makes them useful for diversification.
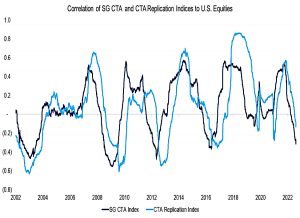
The correlation of the CTA Replication Index is lagged to that of the SG CTA Index, which is explained by monthly rebalancing and 12-month lookback for calculating the factor betas.
Conclusions
Each of the replications is far from perfect, with low-ish correlations and R2.
- But they are both transparent and simple and achieve a similar objective to CTAs, which is returns uncorrelated to stocks.
A dedicated DIY-er could improve on both processes, but I wish instead that there were simple UCITS ETFs available to copy all of these strategies and more.
- Until next time.
Mike Rawson
Mike is the owner of 7 Circles, and a private investor living in London. He has been managing his own money for 40 years, with some success.