Expected Returns 6 – The Equity Premium

Today’s post is the sixth in our series looking at papers by Antti Ilmanen, as a prelude to tackling his magnum opus, Expected Returns.
Contents
Story so far

We’ve looked at five papers, a blog article and a slide deck so far.
- The lessons learned had become as long as a blog article in themselves, so I have moved them to a separate master page here.
The Equity Premium
We now move on to a fairly hefty pamphlet (180 pages) produced by the CFA Institute and entitled Expected Returns on Major Asset Classes.
Here are a couple of extracts from the foreword to explain the objectives of the book:
Can investment management be reduced to a set of patterns that markets generally follow? Can investors reasonably expect to make money from the knowledge of these patterns, even after they have not only been identified but also widely exploited?
Antti Ilmanen presents powerful and voluminous evidence that, at least sometimes, the answer is yes. Asset class expected returns and risk premia are time varying and
somewhat predictable.
The four main sections of this work are adapted from four key chapters in Antti’s book.
- Today we’ll look at the equity premium.
Summary
Antti begins the chapter with a summary of his findings:
- US stocks average a 3% to 5% premium over bonds over long timescales.
- The premium is 1% higher against short-dated bills and another 2% higher when arithmetic returns are used (we’ll prefer geometric).
- Global equity premia are a bit lower.
- Forward-looking measures (based on yield ratios or dividend discounting/DDM) vary between zero to slightly negative and 10% over time.
- Survey forecasts of the equity premium vary across sources and over time.
- Professionals tend to predict 3% to 4%, compared to 6% from academics.
- Retail investors tend to extrapolate.
- Real long-run growth in dividends and earnings per share lags GDP.
- Issuing new shares does not benefit existing shareholders.
- Equity valuations are highest under stable mild inflation and low macro-volatility.
Terminology
Antti uses the following terms:
- ERP = Equity Risk Premium
- ERPC = premium over cash
- ERPB = premium over bonds
In additions, returns can be predicted (ex-ante) or historical (ex-post), and measured using geometric or arithmetic returns.
The ERP is calculated for market cap indices since equal weight indices over-weight small stocks (and their outperformance).
Theories
The next section of the chapter considers theoretical explanations for the equity premium puzzle (why the ERP is so large).
- That’s not our focus today, so I will move past this.
Historical results
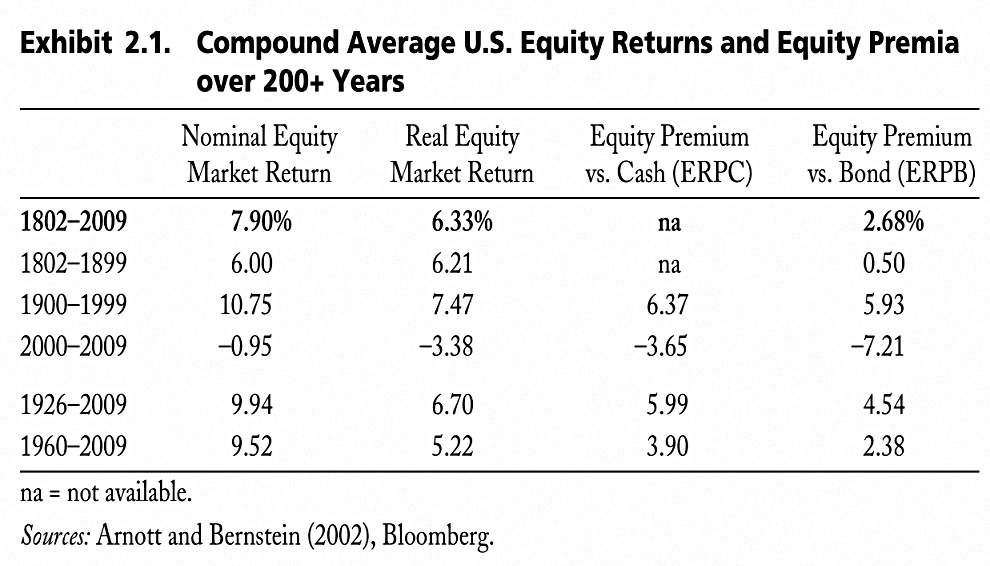
Here’s a table of historic returns – the long-run geometric ERPB is 2.68% pa.
- Antti sees inflation as a key driver of the variation between periods.
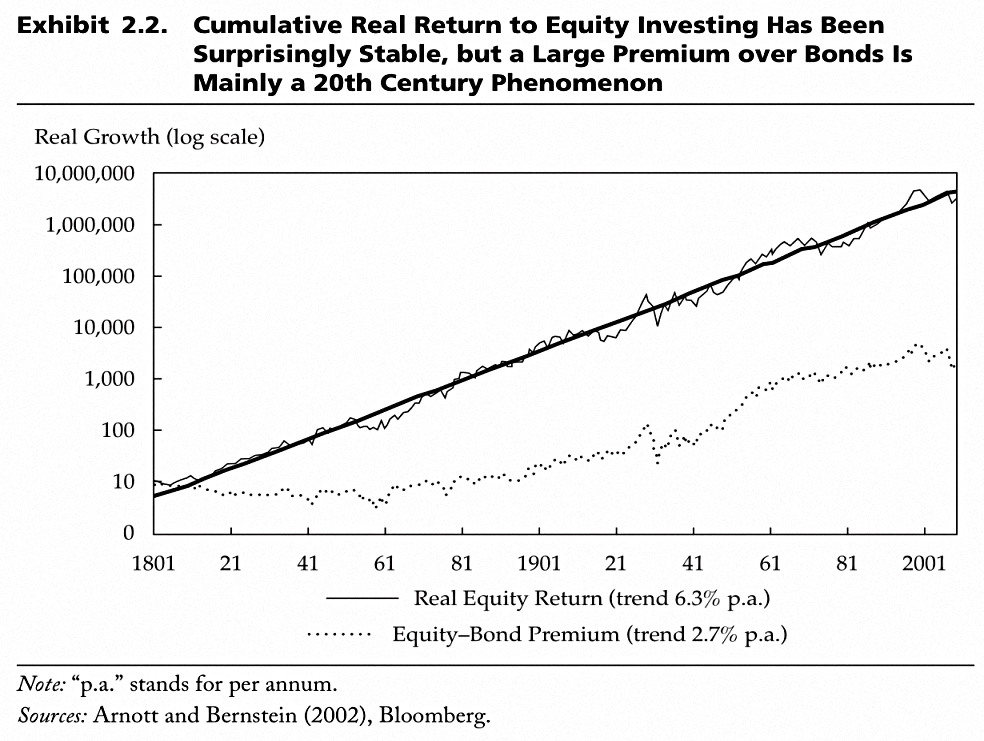
The large premium over bonds is confined to the 20th century.
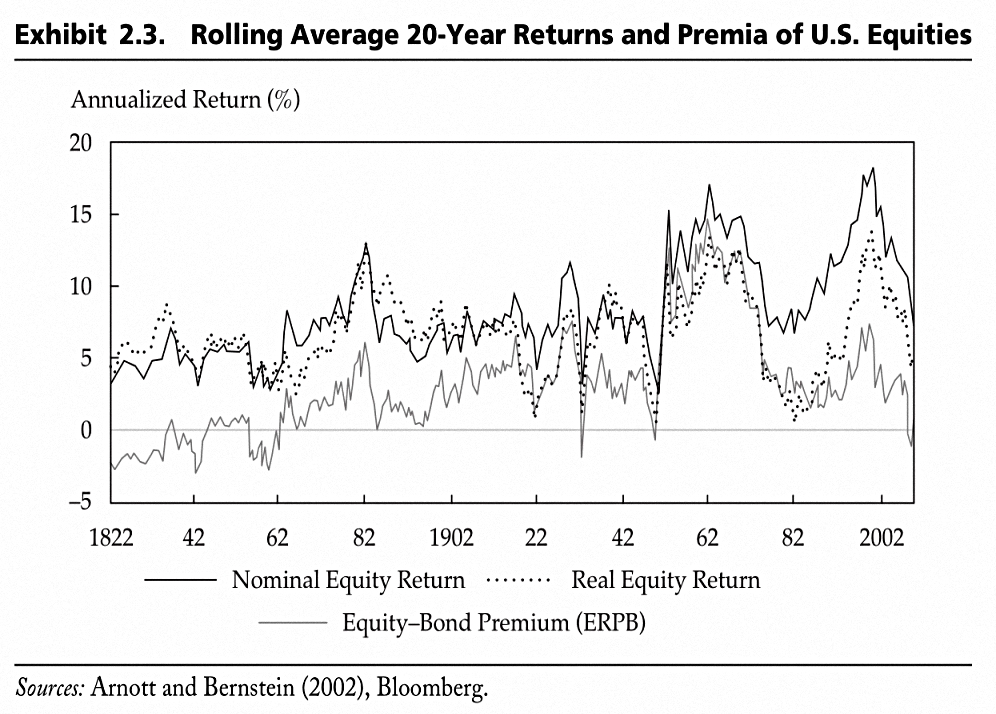
Rolling 20-year equity returns (and 20-year ERPBs) vary a lot.
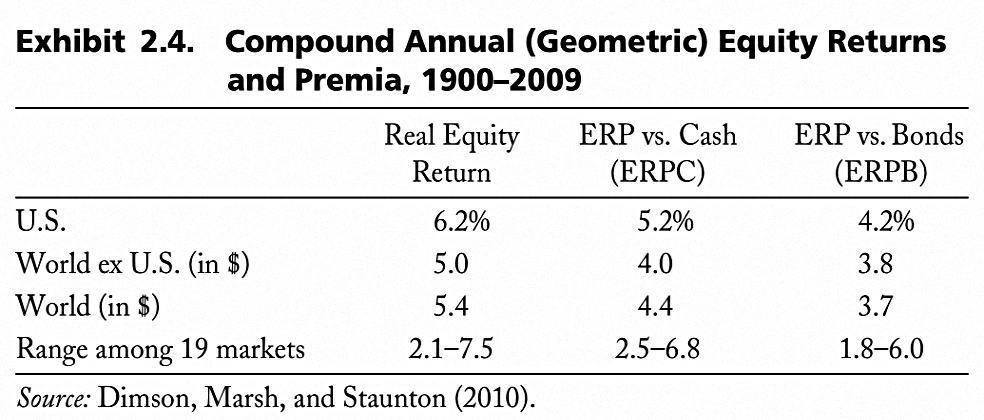
Global ERPBs are 0.5% to 0.8% lower than for the US.
Antti notes that if “windfall” gains from growth surprises and valuation changes are removed, ERPs are lower (ERPB of 4% for the US).
- And also that the expected premium is lower when valuations are high.
Antti also notes that beta works between stocks and bonds but not across stocks:
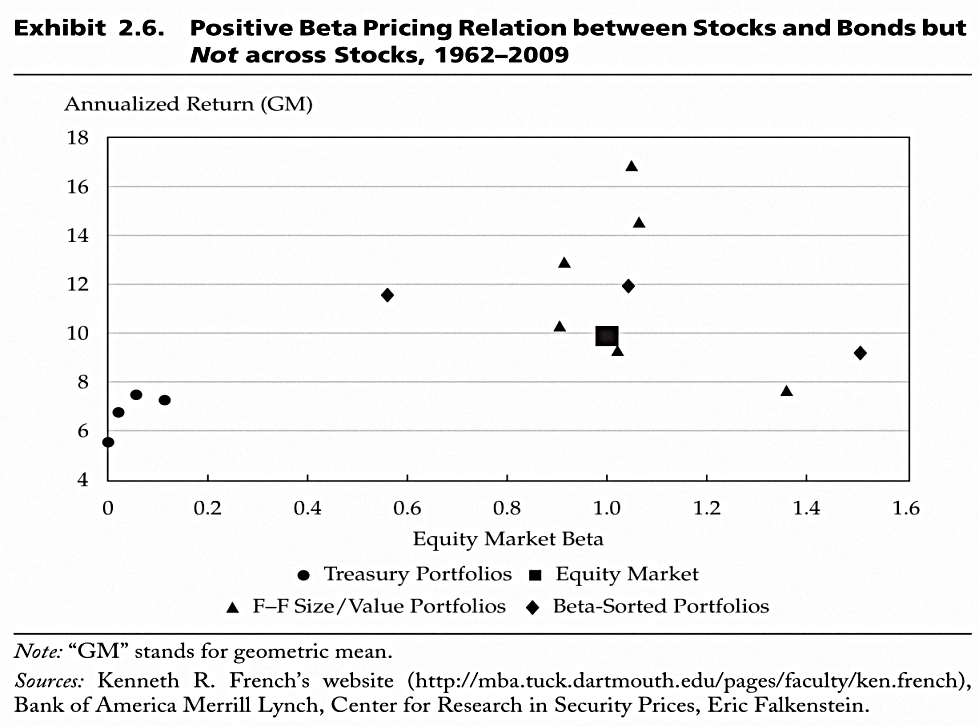
The surprisingly good performance of low-beta stocks may reflect their tendency
to have large loadings on other priced factors or characteristics.To me, the most compelling explanation is that many volatile high-beta stocks are bought as lottery tickets and as proxies for high-leverage investments, whereas low-beta stocks tend to be stable and dull stocks with a value bias.
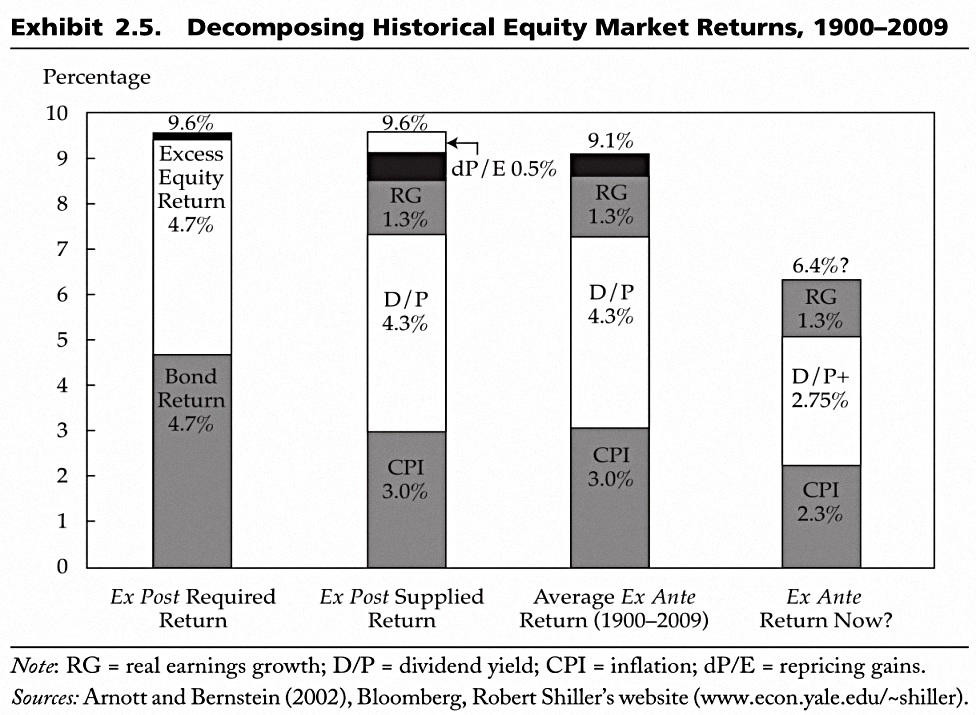
Looking forward
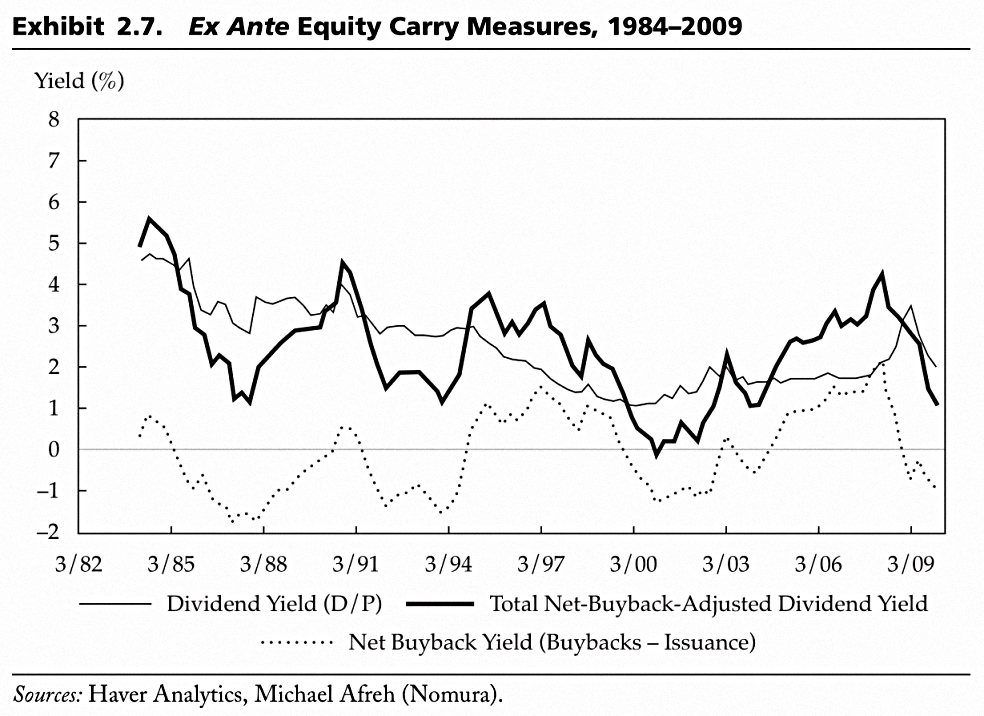
The dividend yield (D/P) has been replaced by shareholder return (including buybacks) as the carry measure whilst earnings yield (the inverse of PE) and the Gordon DDM model are used as valuation measures.
- D/P was between 3% and 6% until the 1990s, when it fell to less than 2%.
- Thus it gave a bear signal during the 1990s equity rally because it ignored buybacks. ((Note that new share issuance should also be taken into account ))
The net-buyback-adjusted dividend yield is the best predictor.
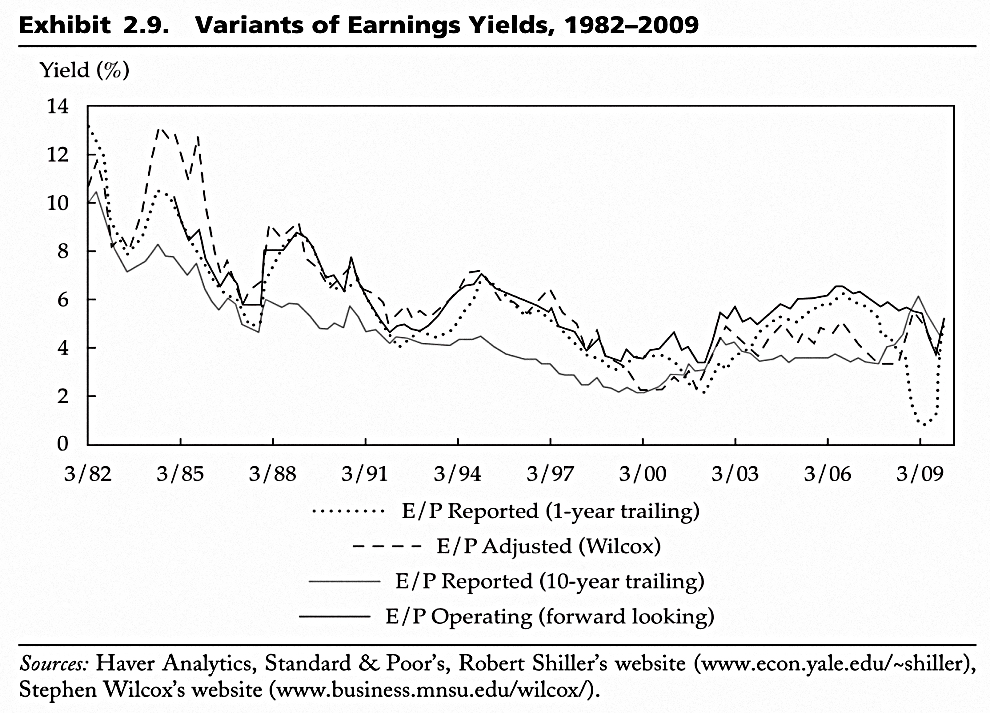
An inflation-adjusted earnings yield is a better predictor than the unadjusted earnings yield.
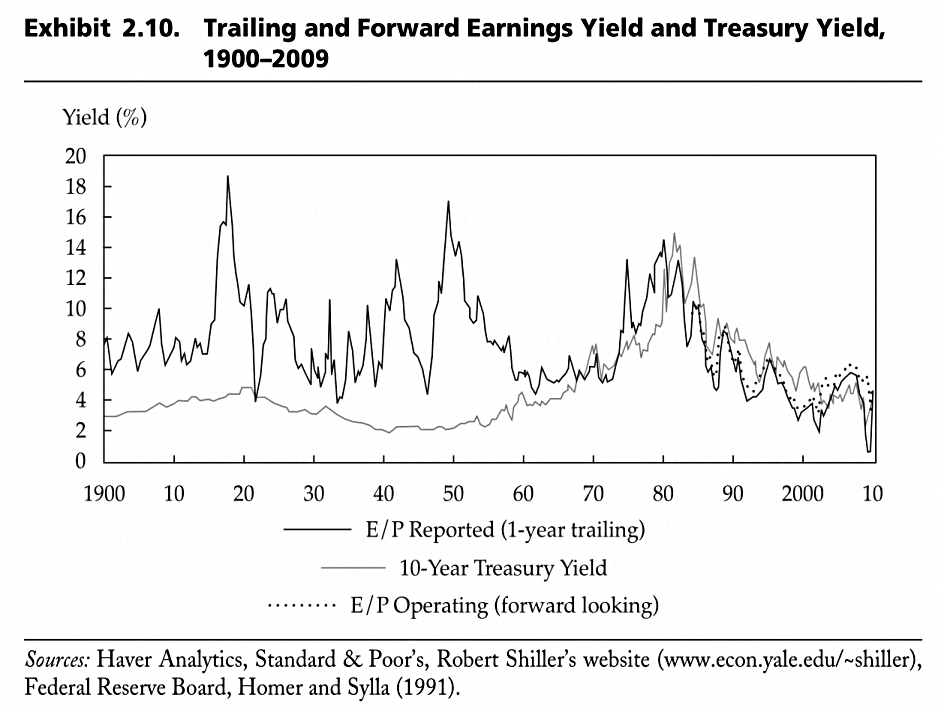
Earnings yields and Treasury yields were uncorrelated until the 1960s but have been well correlated since then.

The yield ratio between stocks and bonds appears to track the equivalent volatility ratio.
Shifts in the relative risk of asset classes are a structural change that undermines the usefulness of valuation signals like the yield ratio.
This ratio serves well as a mean-reverting signal within any one regime, but it typically gives a wrong value signal when a structural or regime change occurs.
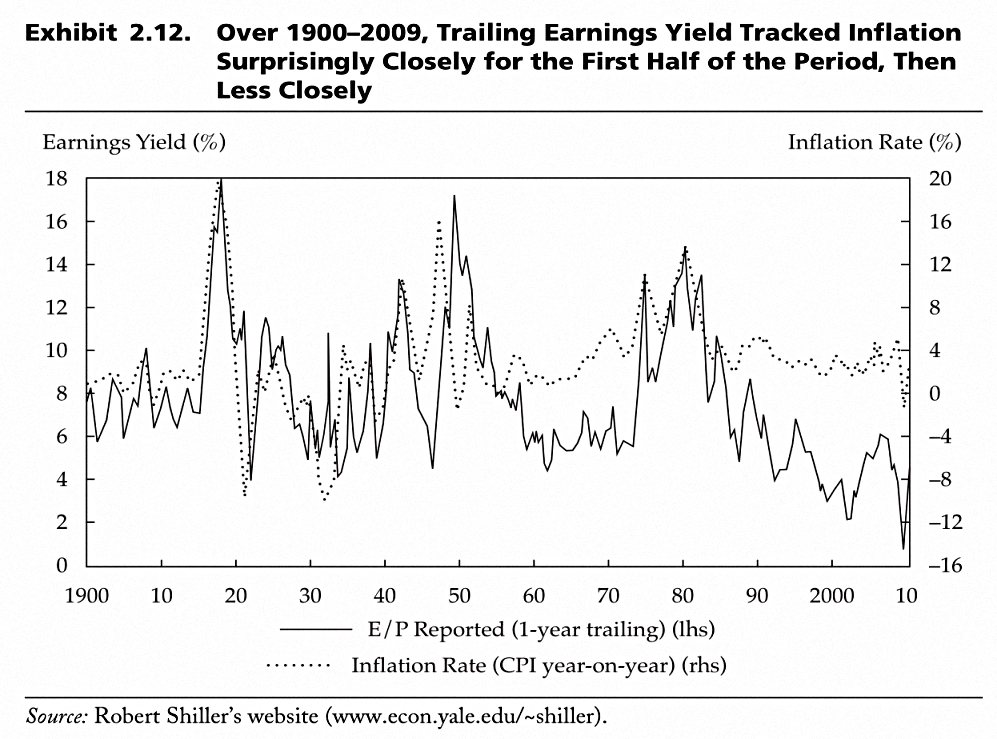
Earnings yield used to track inflation closely, but no longer does.

Inflation in the 1% to 4% range is best for stocks.
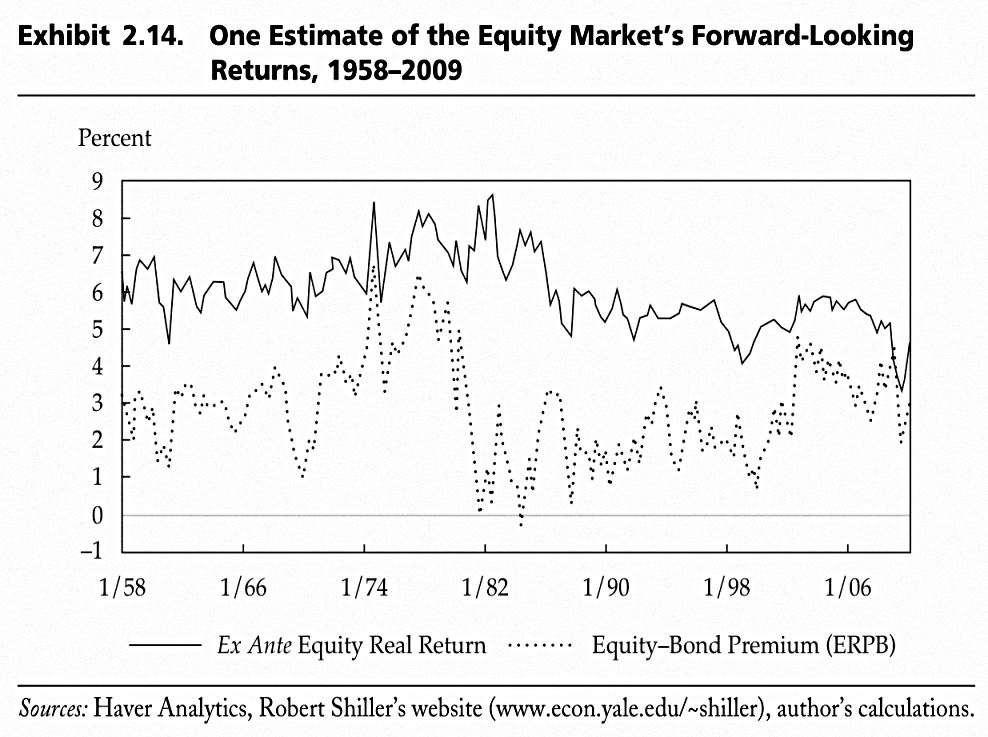
The DDM approach gave an ERPB estimate that peaked in the 1970s and troughed in the 1980s.
Choosing the correct long-run growth rate for the DDM is problematic.
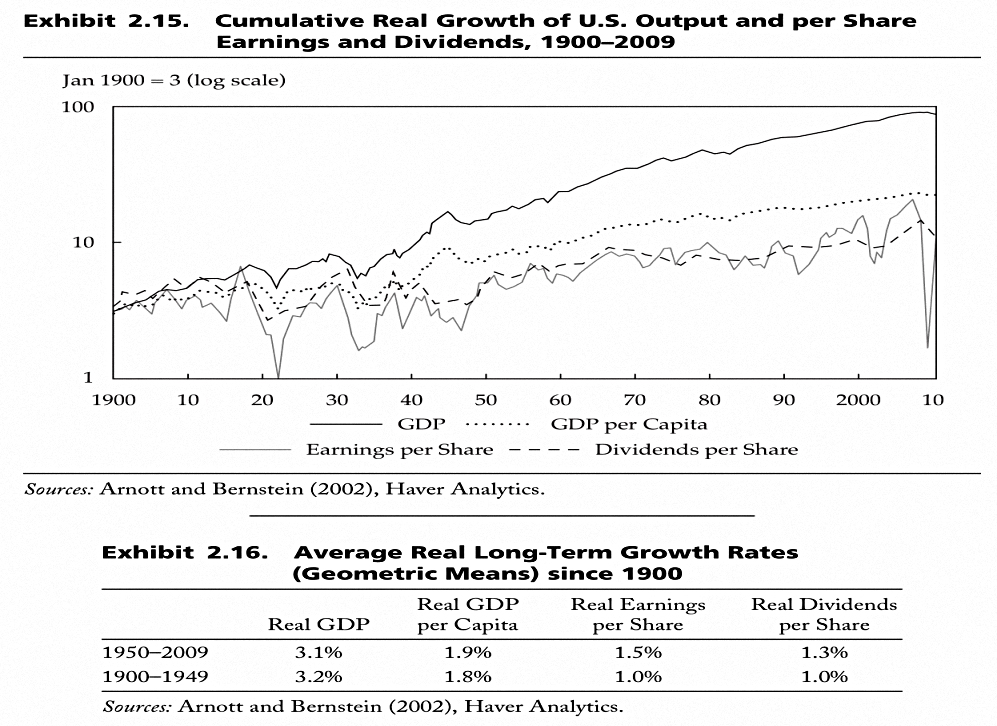
Earnings and dividends per share are much closer to (though still lower than) GDP per capita than to GDP itself.
Surveys
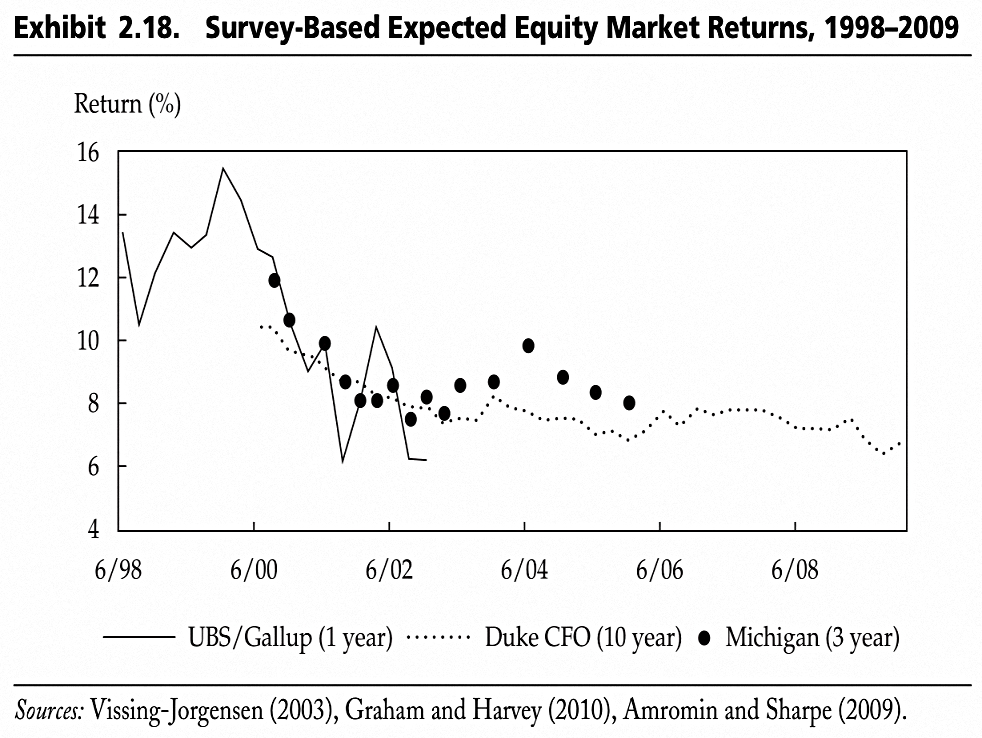
Recent return optimism peaked in the dot com boom.
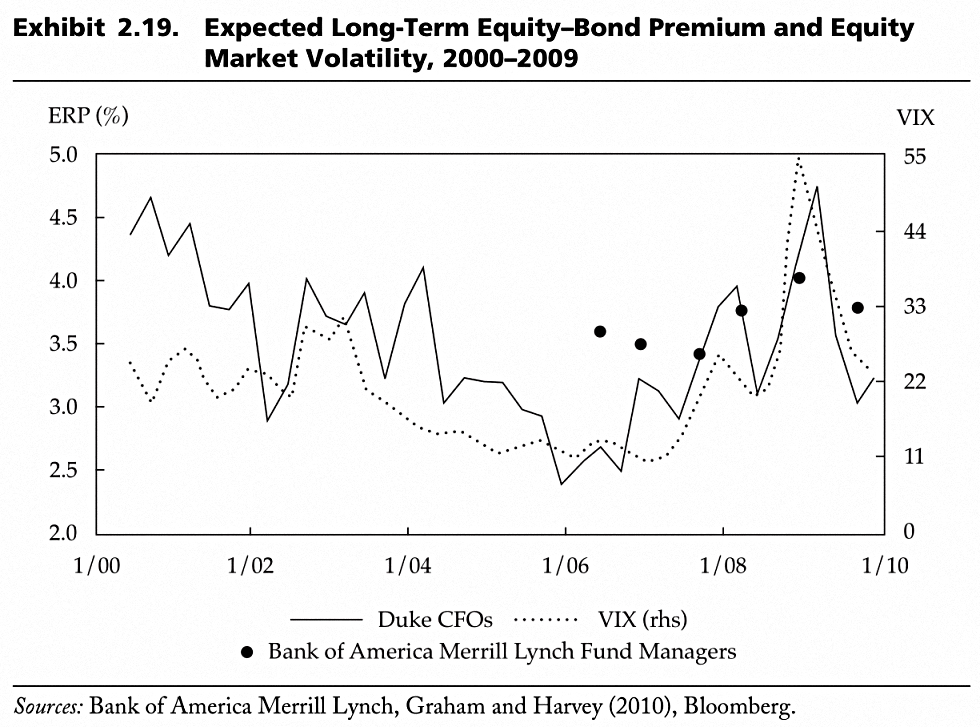
Professional return estimates are highly correlated with volatility (the VIX).
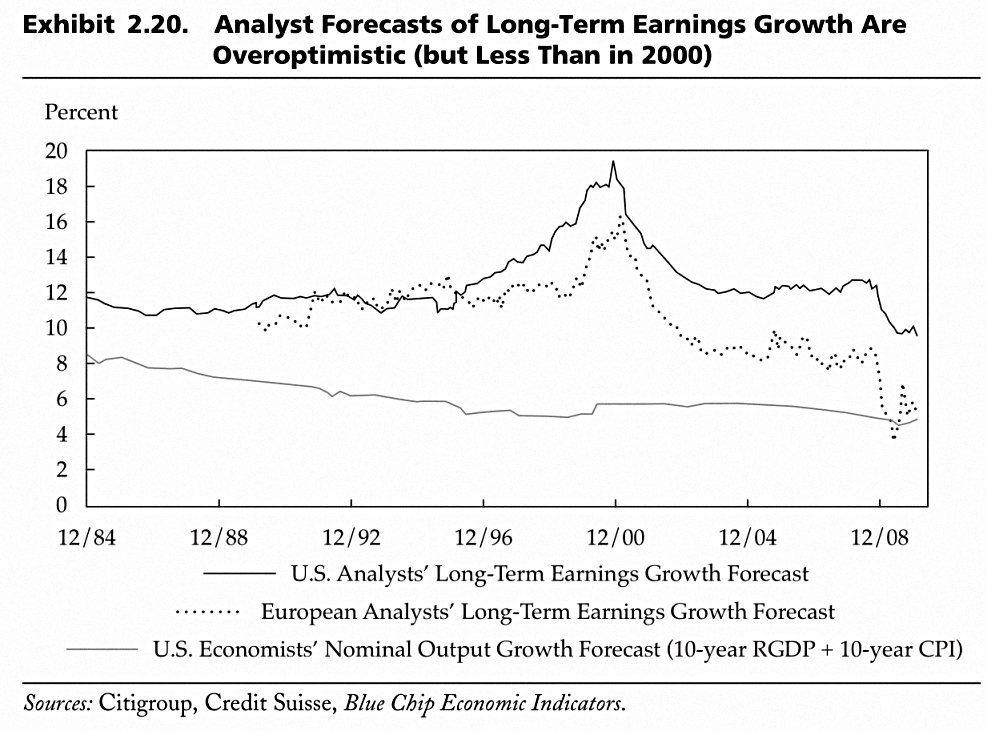
Equity analysts are optimistic, but not as much as they used to be.
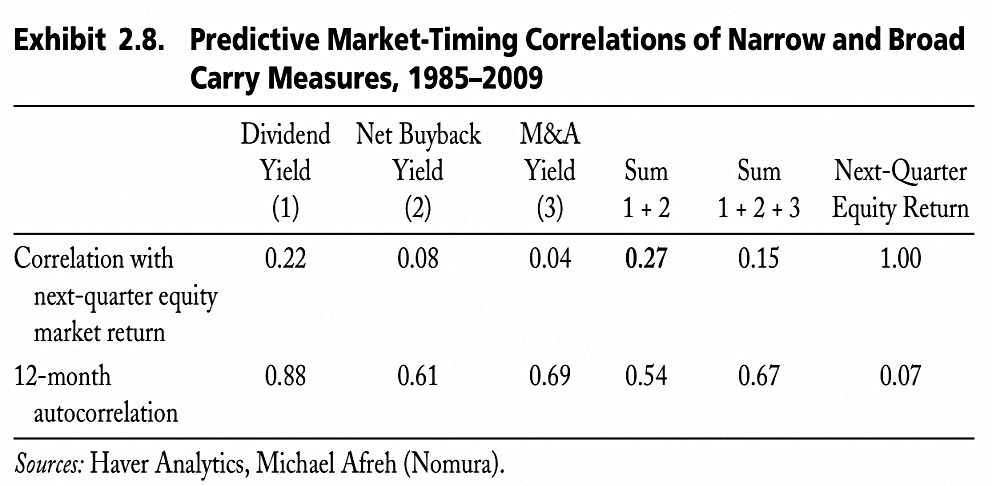
Market timing
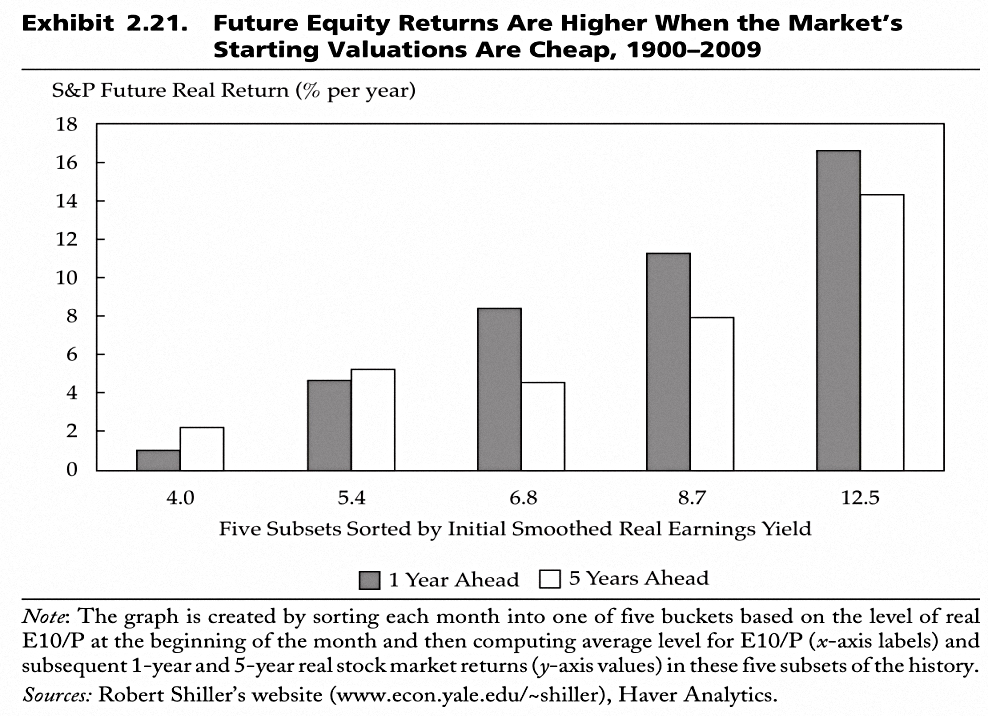
Not surprisingly, equity returns are higher when starting valuations (based on smoothed earnings yield – the Shiller CAPE) are lower.
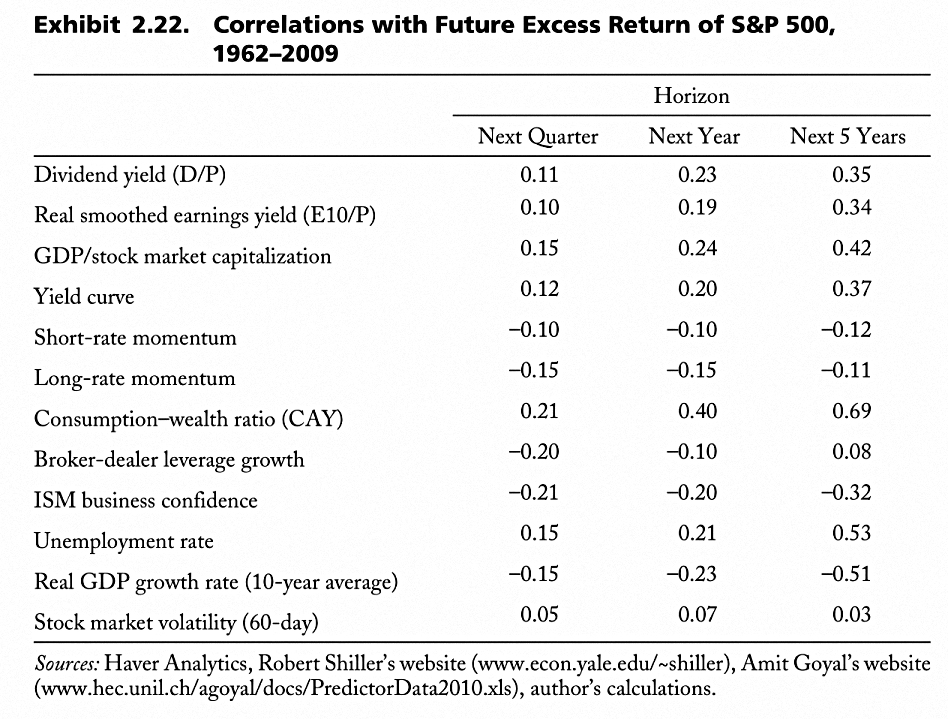
This table shows the predictive correlations of quite a lot of variables.
- Note the low correlation with volatility.
Conclusions
It’s been a real change of pace today, with a much denser and more academic style.
- We’ve seen a wealth of data, but I’m not sure how much of it is directly useful.
- And I’m surprised that there wasn’t more discussion of outperformance factors in equities.
As private investors, we have two main tasks:
- Asset allocation, and
- Market timing
Today’s material supports a high equity allocation and the idea that valuations matter, but we already know both of those things.
- It’s possible that all of this will make more sense when we come to Antti’s book proper, and in particular to the chapters that don’t deal directly with asset classes.
Before then, we have another three chapters of this pamphlet to get through.
- Bonds are up next.
Until next time.
Mike Rawson
Mike is the owner of 7 Circles, and a private investor living in London. He has been managing his own money for 40 years, with some success.