Expected Returns 5 – Private Equity and Illiqidity

Today’s post is the fifth in our series looking at papers by Antti Ilmanen, as a prelude to tackling his magnum opus, Expected Returns.
Contents
Last time

We’ve looked at four papers, a blog article and a slide deck so far, and here’s what we’ve found:
- Investors tend to think of expected returns as a function of the asset class.
- This leads them to take on too much equity risk since diversifying assets like bonds have lower returns that would need to be juiced by leverage.
- Diversification (multiple sources of risk which have worked well over long periods) can help, but correlations are higher when things get tough (in crashes)
- There’s also insurance, but this is expensive when it is needed (because it becomes popular)
- Selling volatility gives good returns except in a crash because people over-pay for insurance – they want to avoid negative skew.
- Another way of putting this is that their value function is not symmetrical – they want to avoid big losses but are drawn to the chance of a big win.
- This can be exploited using options strategies.
- “Lottery tickets” – the most volatile members of an asset class (eg. small cap blue-sky growth stocks) – generally offer poor returns.
- They are over-priced because of the preference of some investors to chase outsize returns.
- Prospect theory explains the simultaneous demand for lottery tickets and insurance through the over-weighting of (salient) low-probability events.
- This means that people like large (but unlikely) payoffs and will buy tickets to win them, but dislike large (but unlikely) losses and will insure against them.
- In contrast, non-salient unlikely events (in effect, things which are thought to be impossible, or are never even considered) are under-weighted.
- Since salience is the driver of the over-weighting, the over-pricing should be worst just after adverse events.
- As well as the lottery preference, leverage-constrained investors may use riskier assets as a substitute, again making them over-priced.
- Low volatility stocks outperform in absolute terms and have much better risk-adjusted volatility (a higher Sharpe ratio – SR).
- There is no reward for buying bonds longer than 5 years or riskier than BB.
- Illiquid assets (eg. venture capital, private equity) have higher returns but did badly through the 2008 crisis.
- Diversifying across investment styles may offer greater returns for less risk.
- But styles have lower volatility than stocks, and so they can’t diversify away the equity risk.
- Implementing styles properly also requires the “three dirty words in finance”—leverage, short-selling, and derivatives.
- The four key styles are:
- value
- momentum
- carry (yield – this is closely related to value for stocks)
- defensive (low risk/low beta, so equivalent to low vol) – this style can also be extended to include quality measures.
- Size and illiquidity are also relevant in some assets:
- There are risk-based and behavioural explanations of why factors work
- But choosing between these two explanations is not necessary in order to take advantage
- Leverage constraints (for some investors) may explain why low-risk works
- All styles suffer from drawdowns and periods when they don’t work
- So you should use them all in parallel.
- The composite style premia portfolio is not massively correlated to a 60/40 stock/bond portfolio.
- Value and trend may seem contradictory, but it’s a matter of timescale.
- Trend dominates for up to a year, before mean reversion sets in.
- This means that chasing multi-year returns (as many investors do, even when choosing funds) runs straight into reversal effects.
- Value and trend actually combine well together (recent winners can still be cheap), and they act as good diversifiers for each other.
- Trend-following also protects against tail risk (does well in crashes).
- Limited market timing (“time variation in return sources”) may also increase returns.
- Timing can be based on valuation measures, the macro environment and on investor risk aversion.
- But timing is risky and should, therefore, be a minority component.
- In later articles, Antti admits that contrarian rotation based on recent valuations has been hard to implement successfully in recent years. (( I personally suspect that the central-bank dominated macro environment has something to do with this ))
- Returns from long-only portfolios are falling in line with interest rates and inflation.
- Using realistic future returns pushes up minimum retirement saving rates from 8% pa (of income) to 15%.
- There are three ways to improve returns – more equities, more illiquids and/or more factor tilts and alternative risk premia.
- Typical performance evaluation windows (for funds and managers) of three to five years are likely to lead to underperformance from reversals (mean reversion).
- Investors should use three dimensions to evaluate their portfolios:
- asset classes
- strategy styles (factors) and
- risk factors (fundamental macro factors that are not directly investable)
- Long-term investors have an advantage that they can exploit through selling insurance.
- This means selling volatility via index puts (as mentioned above).
- The problem with these strategies is that they lose money at the very worst times, and you need to be certain that you can tolerate the losses.
Private Equity and Illiquid Assets
Today’s article is a white paper from the AQR website entitled Demystifying Illiquid Assets: Expected Returns for Private Equity.
- It appears to be the paper that I saw Antti present at the London Quant Group in the summer of 2019.
PE is hard to model because of a lack of good data and an artificial smoothing approach to pricing.
- The goal of the paper is to set out expected and realised returns foe PE (specifically, US buyouts and not VC) over and above lower-cost public equity.
The key finding is that the premium is not large and has been shrinking over time.
- Nevertheless, institutional demand for PE is increasing – Antti suspects this is down to a preference for return-smoothing (lack of mark-to-market), particularly during market crashes.
The return smoothing reduces the reported volatility and beta of PE, which in turn overstates the alpha and the diversification benefits (lower correlations) of PE.
Equity beta
PS has several tilts over public equities – equity risk, illiquidity premium, (small) size and value.
The equity risk comes from the 100% to 200% of debt for every dollar of equity that is typical in PE.
- Public firms average 50% of debt for each dollar of equity.
Debt increases beta (and volatility) since the interest payments to debt holders increase the riskiness of the cash flows to equity holders.
- This means that PE has a beta well above 1, and its diversification benefits are artificially created through price smoothing.
Of course, low reported risk but a high economic risk can be attractive to some investors.
- This strategy will survive a fast bear market like 2007-09 but will be exposed by a slower one.
Locking up money for five to ten years should lead to an illiquidity premium, but this is likely to be offset by the willingness of investors to pay for the return-smoothing effect.
Size
Buy-out targets tend to be small, so a small-cap index makes a better benchmark.
Value
Buy-out targets also tend to trade on lower multiples than the market (in contrast to VC targets, which are more likely to be growth firms.
- Antti says this is changing and PE in general no longer has a value discount.
Antti reckons that if illiquidity is offset by return smoothing, the small-cap and high beta factors should still predict higher returns for PE.
- Assuming a beta of 1.2 and no alpha above public small-cap (5% pa), the expected excess return over cash should be 6% pa.
Actual returns

Using arithmetic means, PE outperformed large caps by 2.3% pa from 1986 to 2017.
- Against a 1.2x leveraged small-cap index, the outperformance was just 0.7% pa.
- Geometric returns hold up better.
So PE beats the S&P 500, but largely through widely-available factors.
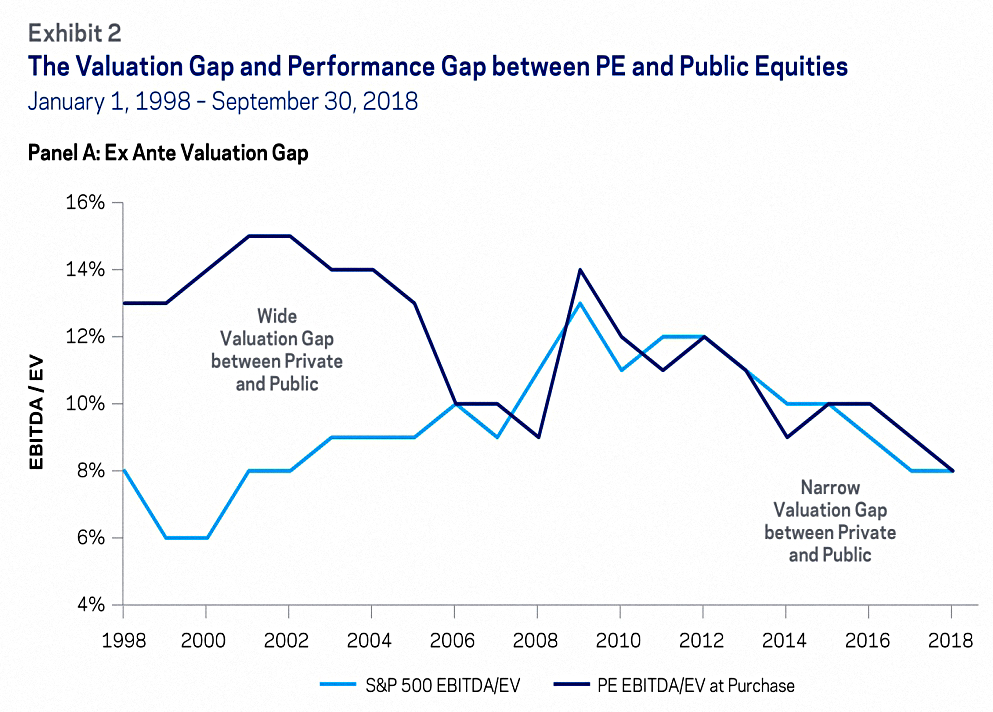
The chart above shows returns over time.
- The first panel shows the ex-ante valuation edge from PE buy-outs being cheaper than the market – this gap is clearly closing.
- The second panel shows the realised outperformance, which has diminished.
Antti fears that investor demand has driven up PE valuations, and the premium may not return.
- He also believes that “vintage years” for PE (high fund-raising or deployment, easy finance and leverage) lead to lower returns.
Yield
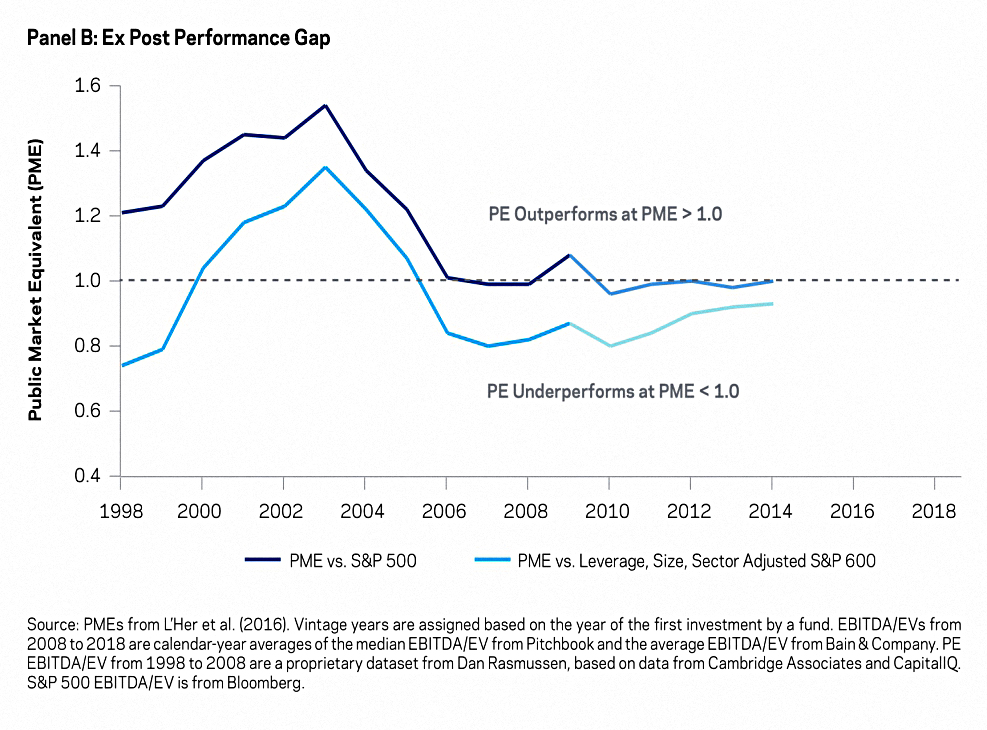
The third approach to return estimation is yield-based.
- This involves DCF calculations as also used by AQR on bonds and public equities, but with data limitations and resultant simplifying assumptions.
PE uses multiple levers:
- higher starting yields (from deal selection)
- higher earnings growth (operational improvements)
- multiple expansions (through the timing of entries and exits)
- financial leverage.
The calculation leads to expected returns for PE of 3.9% as of September 2018, compared with 8.1% from 1993 to 2018.
- The public equity expected return on the same date was 3.1%, giving a PE premium of just 0.8% pa.

The next chart shows that this premium is the lowest in the period, excluding the 2007 to 2009 financial crisis.
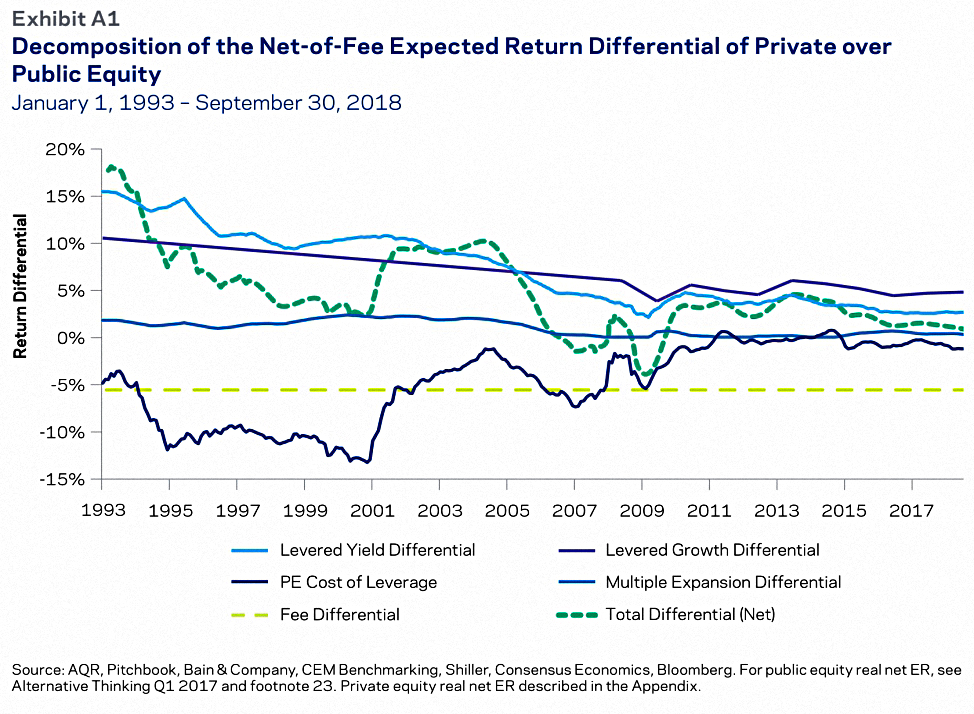
The final chart decomposes these returns.
Conclusion
It’s been another interesting paper.
- PE doesn’t look as attractive as it did 20 years ago, and it’s diversification and Sharpe Ratio enhancing abilities stem largely from the artificial smoothing of returns.
In particular, levered small caps and small-cap value can produce similar returns more easily.
Additionally, compared to VC, it is lacking a tax-break here in the UK.
- Luckily it only forms 1% of our base passive risk parity portfolio.
In the next article, we’ll move on to a 180-page extract from Antti’s main book that was prepared for the CFA Institute.
- Until next time.
Mike Rawson
Mike is the owner of 7 Circles, and a private investor living in London. He has been managing his own money for 40 years, with some success.