Factor Investing 5 – RA Symposium #2

Today’s post is the fifth in a series on factor investing, otherwise known as smart beta. We’re going to take another look at a recent symposium hosted by Research Associates in California.
RA symposium
A few months ago we took our first look at the Research Affiliates annual advisor symposium.
- Research Affiliates is run by Rob Arnott, and focuses on fundamental indexing, a version of smart beta or factor investing.
Last time out we looked at a couple of slide decks from the symposium.
- Today we have another three to get through.
Three mistakes

Juhani Linnainmaa pointed out three problems with factor investing:
- Returns aren’t as high as people expect
- There’s probably an element of data mining involved in the discovery of factors
- Factors become crowded over time, driving up valuations
- Implementation and trading costs are often neglected
- Drawdowns can be worse than expected
- The diversification benefits can sometimes vanish as correlations increase (for example, during crashes).
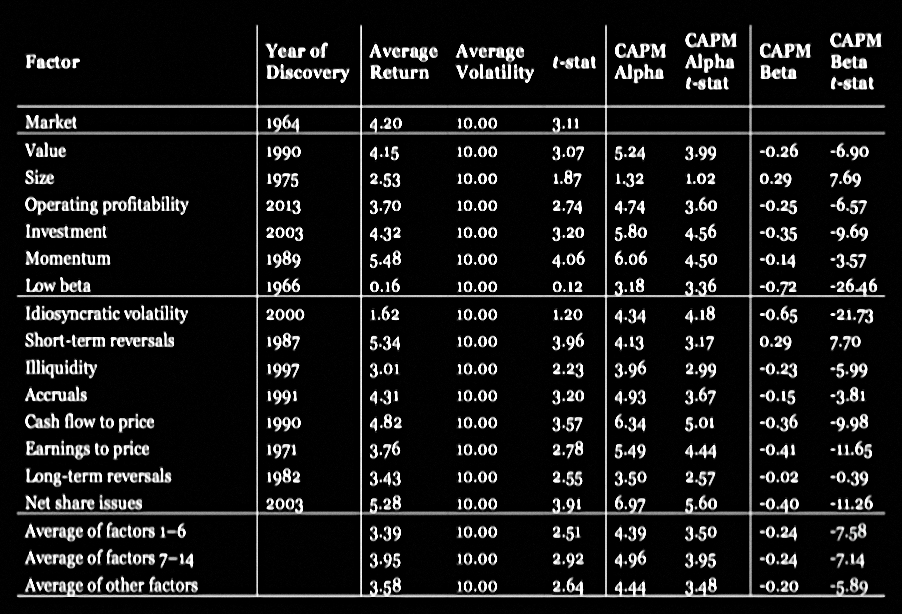
The next two tables show the long run performance of a wide range of factors (1963 to 2018).

This chart shows the impact of market cycles, which we will look at in more detail in a later presentation today:

Here’s the real problem – performance for the first 10 years out of sample (after publications) is less than half of that for the last 10 years of in-sample returns:
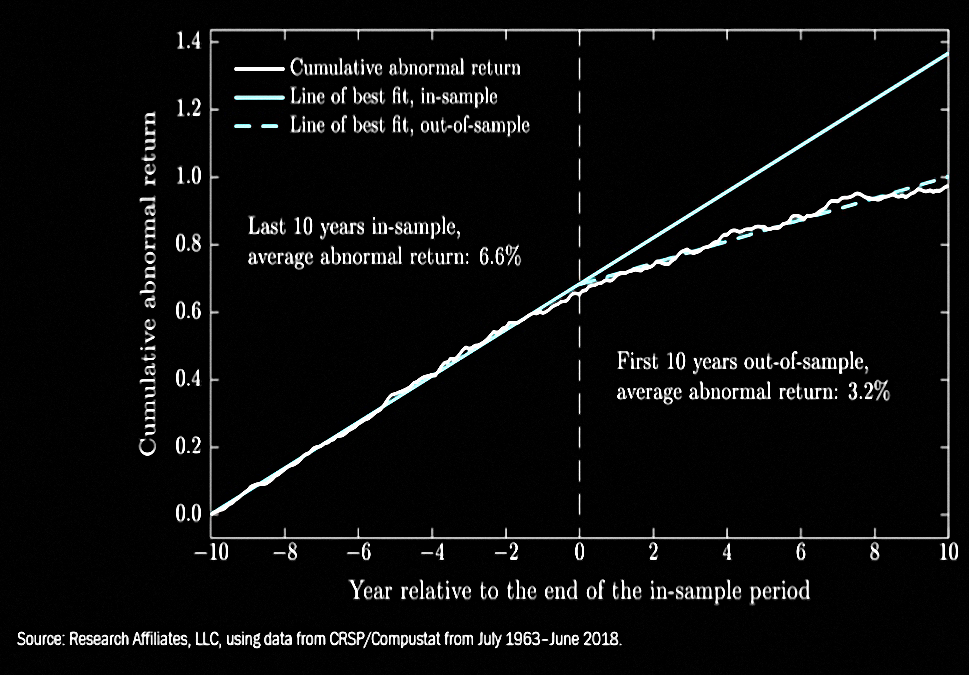
That said, 3.2% pa is very much still worth having.
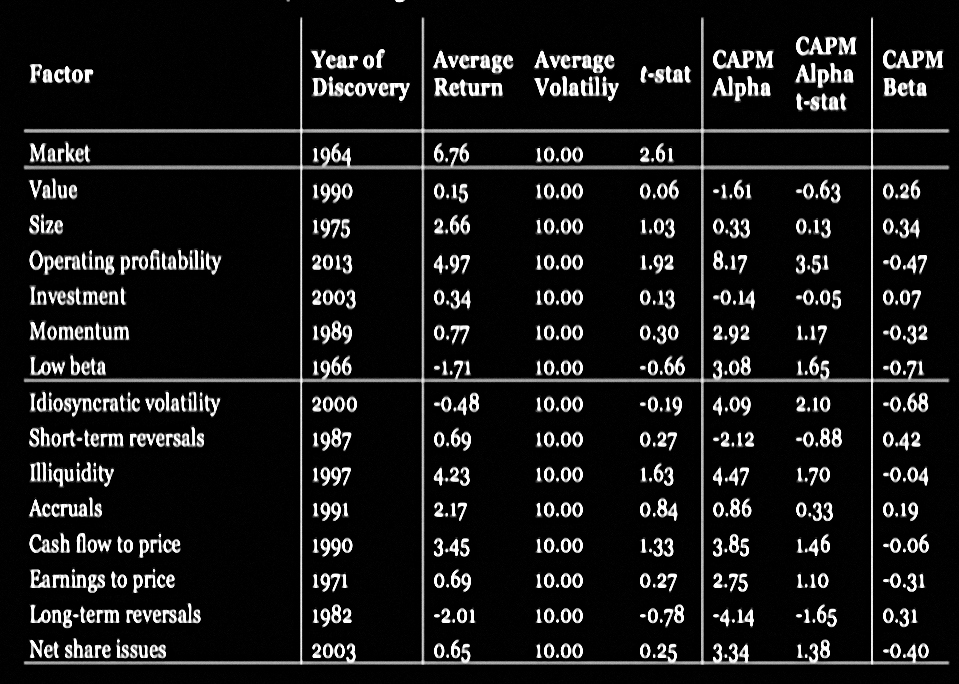
Unfortunately, recent performance (2003 to 2018) is even worse, at less than 2% pa.
It’s easier to see in the charts.
- First, the long-run performance:
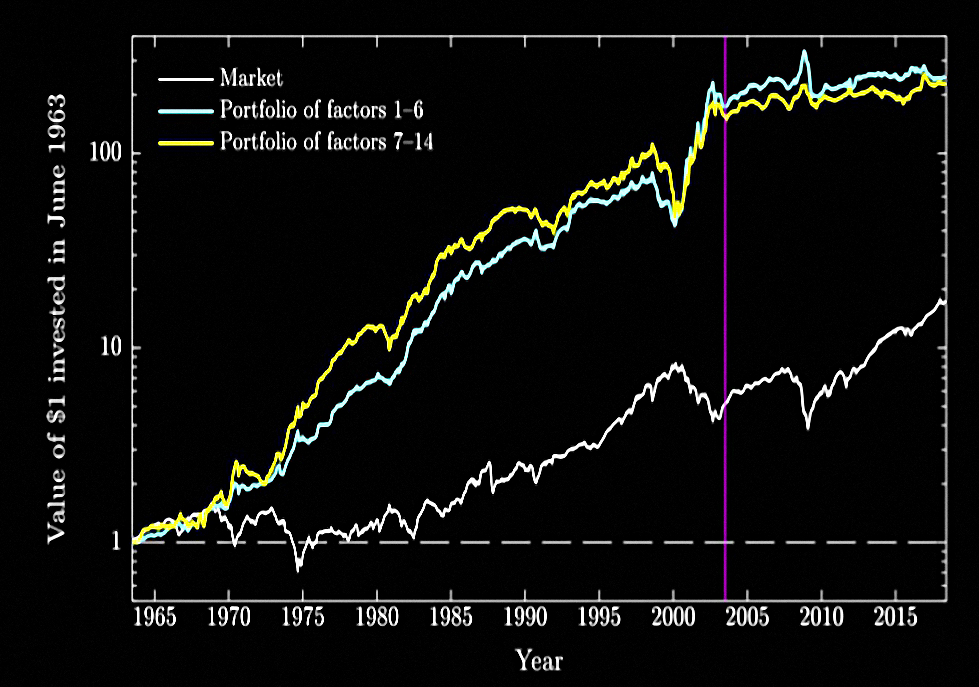
Next, the chart for 2003 to 2018:
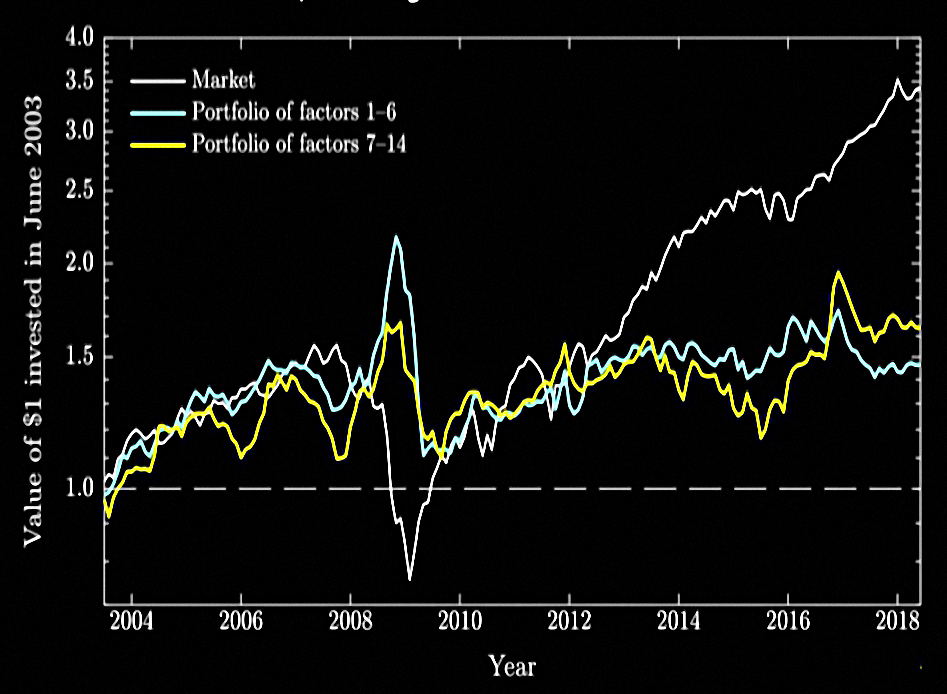
Performance is mediocre (similar to the market) until the 2008 crash, and pretty terrible afterwards.
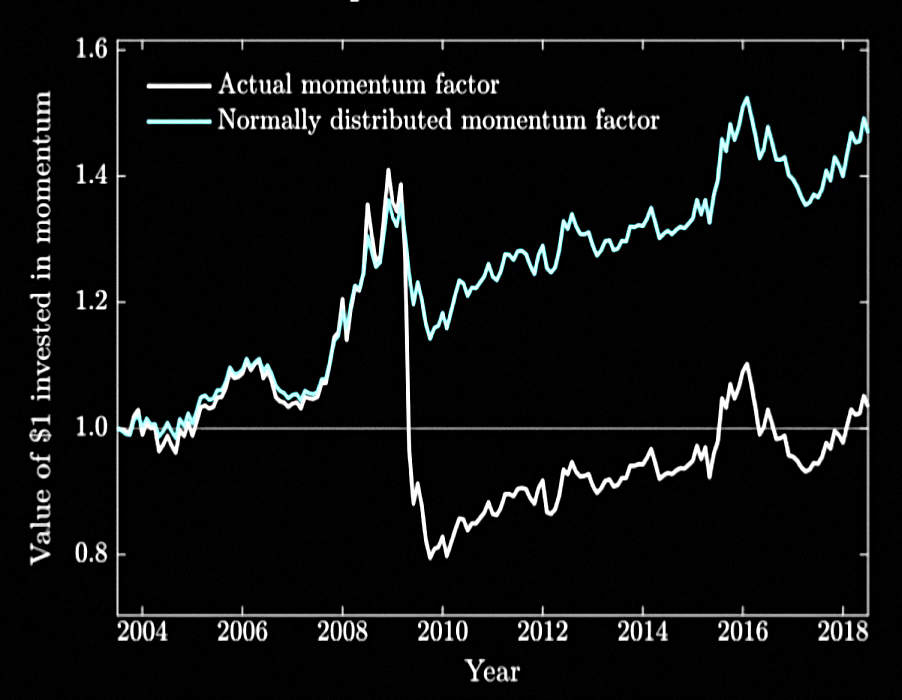
Here’s what happened to momentum during the crash:

Those are pretty extreme monthly returns, and here is the effect of them:
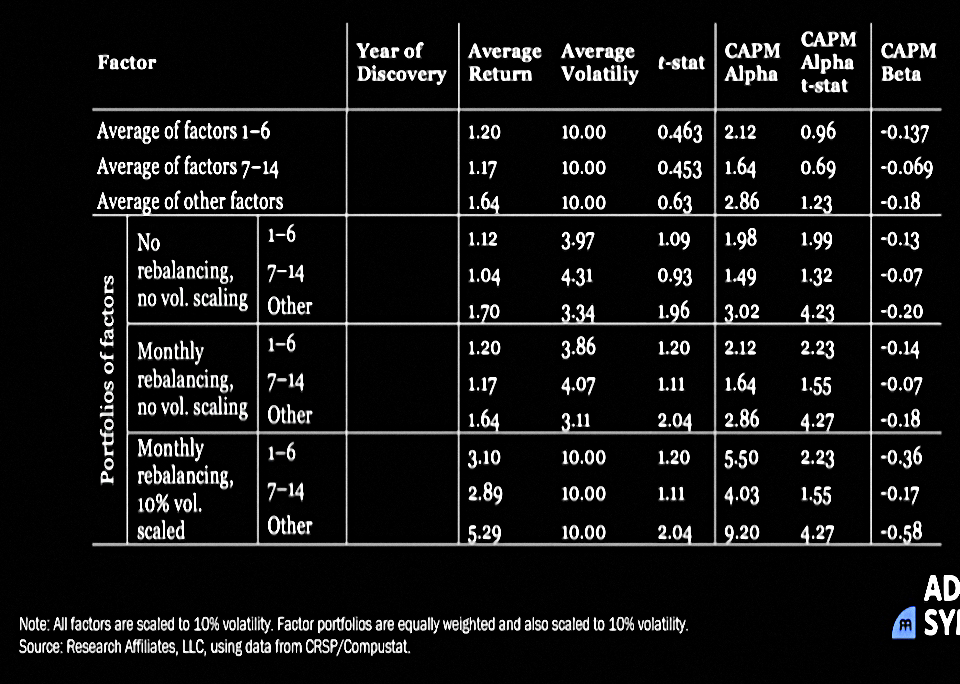
The next table shows how abnormal recent returns have been for all the factors:
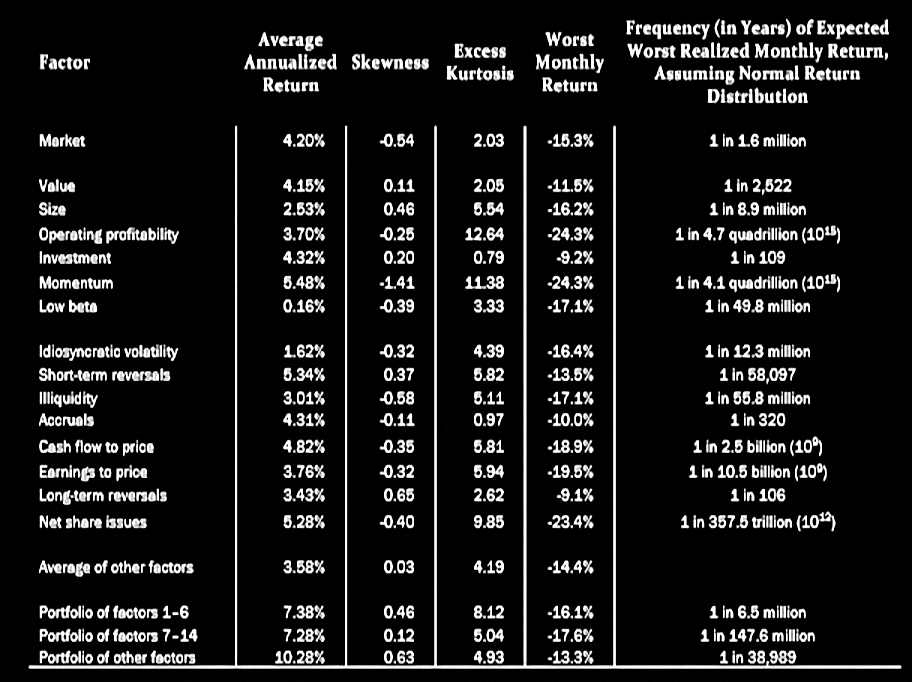
It seem that all the factors have “excess kurtosis” (fat tails) and factors like momentum and liquidity are also negatively skewed, which makes them prone to sever crashes.
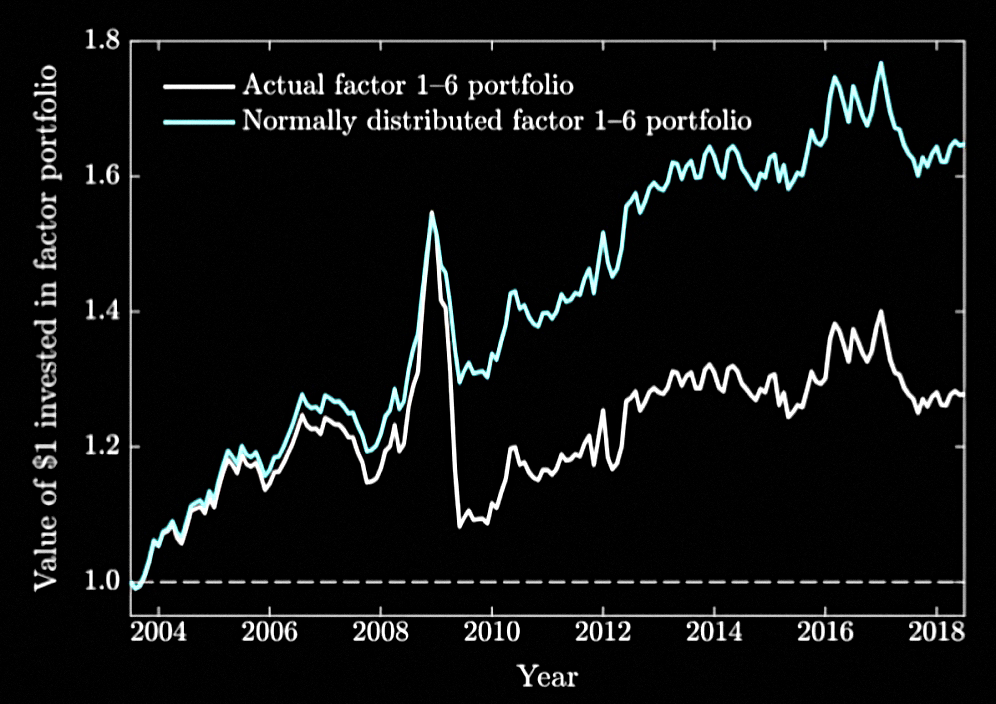
Here’s the same chart we saw earlier for momentum, but this time for a portfolio of the main six factors.
- Factors tend to crash in a correlated manner.
One of the most annoying features of the recent underperformance (since 2008, compared to statistical expectations) is the corresponding outperformance of the general market (particularly in the US).
- Perhaps central bank actions have something to do with both effects.
The presenter concludes that factors are not broken, but than investors need to have realistic expectations.
- Post discovery returns will be lower than pre-discovery returns.
- Factors will not work for extended periods and may crash together.
Multi-signal approach

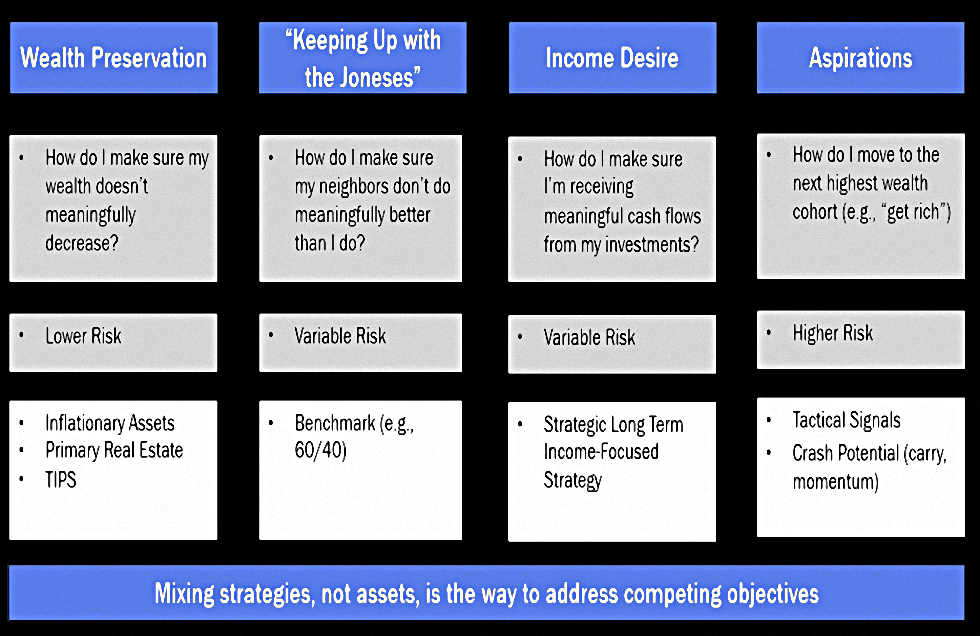
Jim Masturzo looked at the competing objectives of investors:
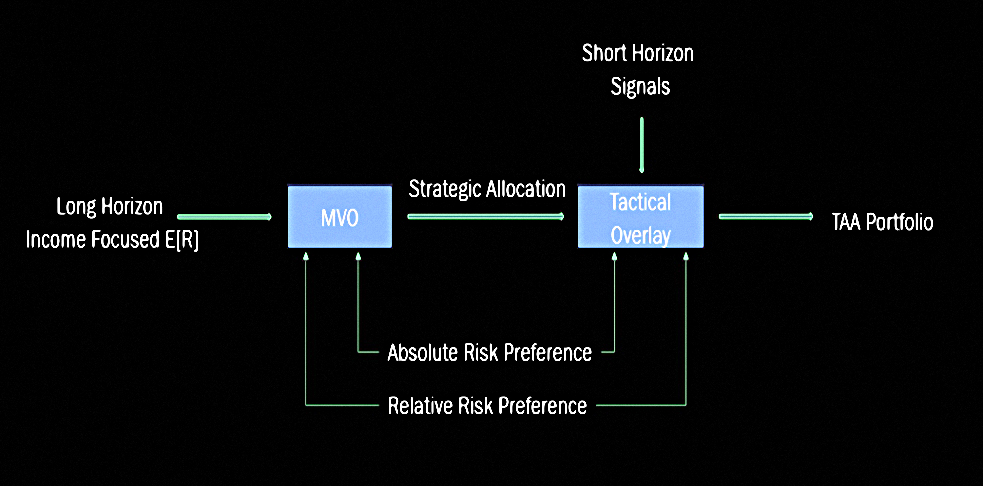
The standard solution today is an MVO (mean variance optimisation) portfolio with a tactical overlay.
- This approach is called TAA (Tactical Asset Allocation) today, but I still cling to the terminology of my youth and refer to it as Core / Satellite.
So far, not so factor oriented. But the next couple of slides are useful:
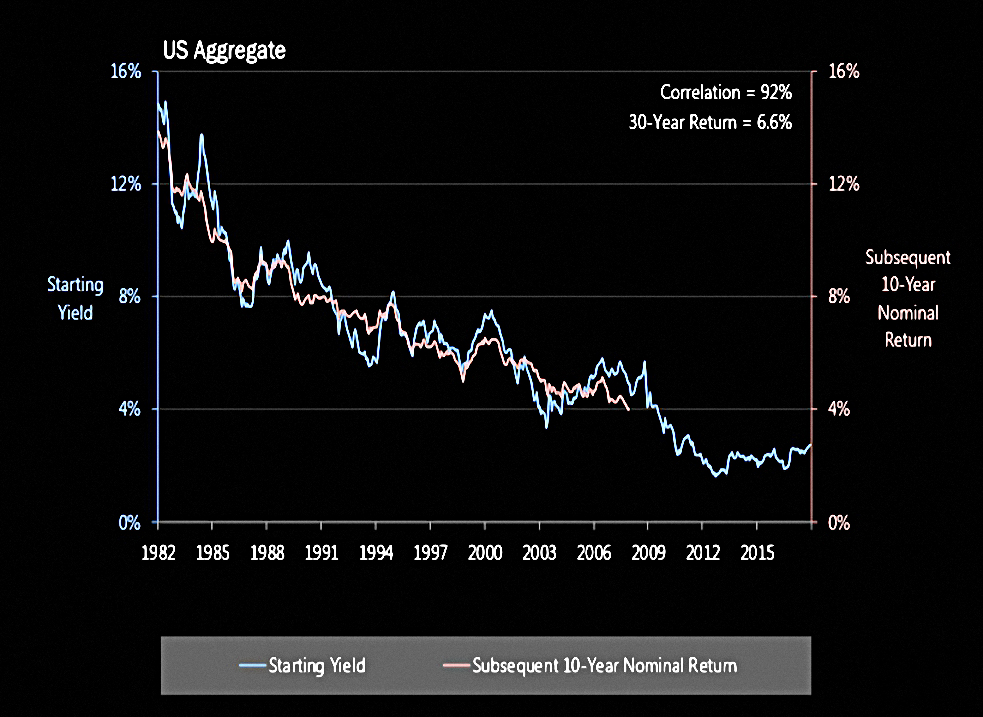
Ten-year bond returns are strongly linked to starting yield.
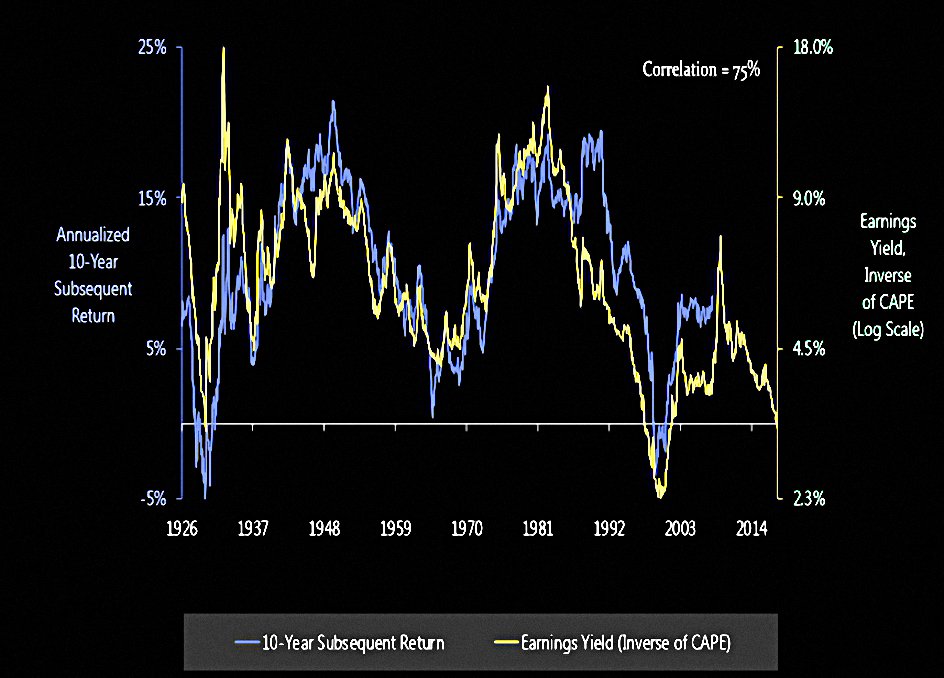
Whilst ten-year equity returns are strongly correlated to the starting earnings yield (inverse of CAPE).
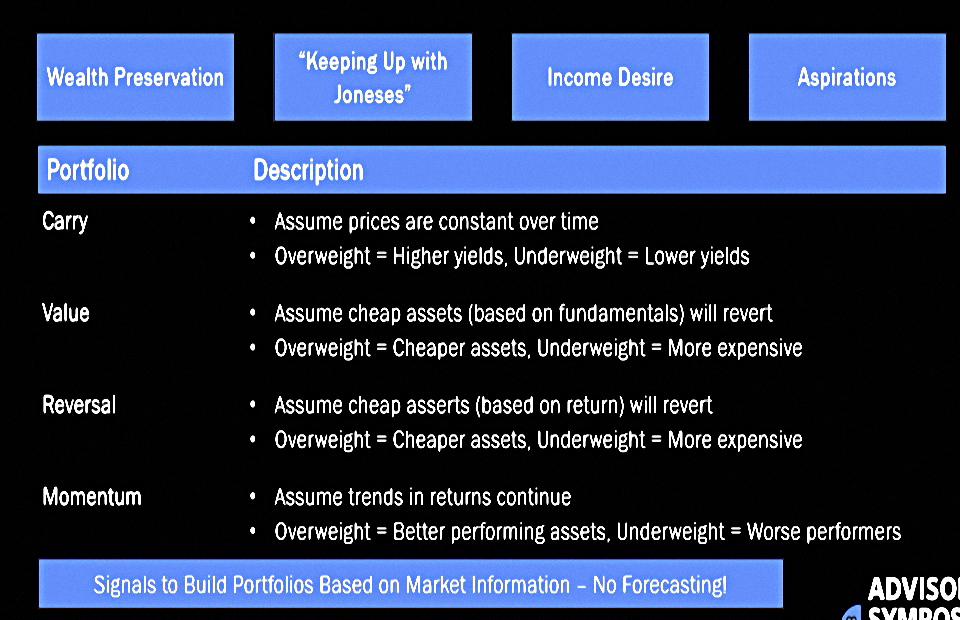
The four “tactical strategies” (I’m pretty sure that’s not a thing) are:
- Carry (yield)
- Value
- Reversal, and
- Momentum
Reversal and momentum are opposites, so they must be working over different time frames, but there is no detail given in the slides.
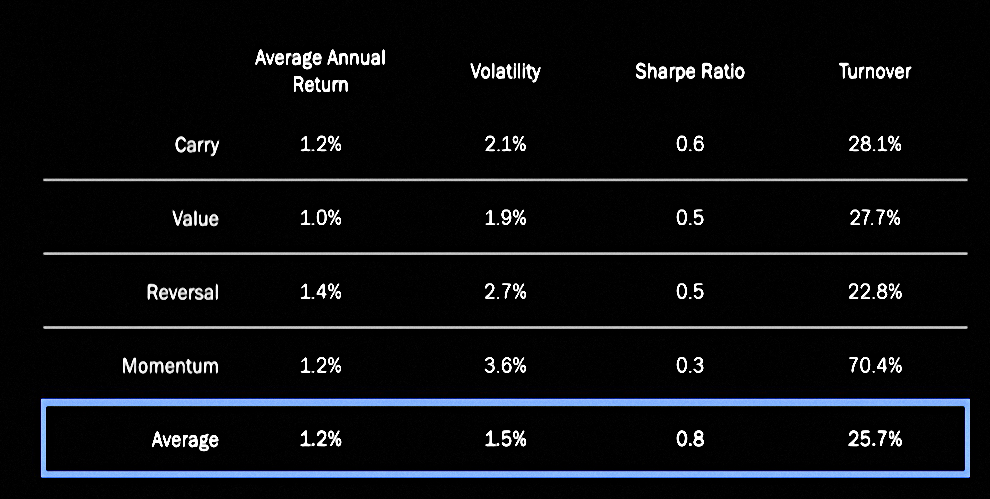
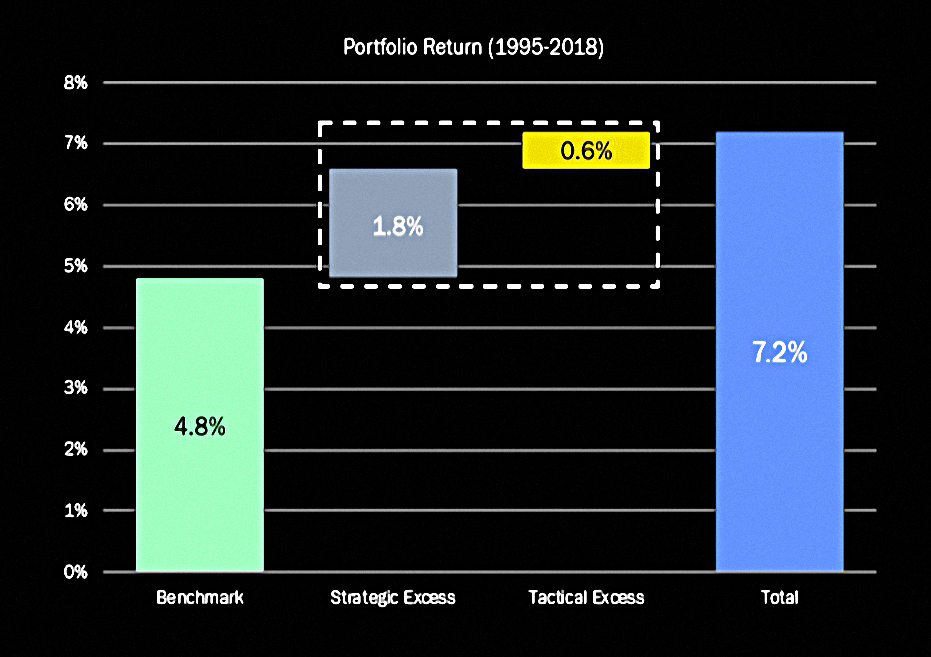
The tactical portfolio has done pretty well, with a sharpe ratio of 0.8.
- Note the pretty high turnover, however.
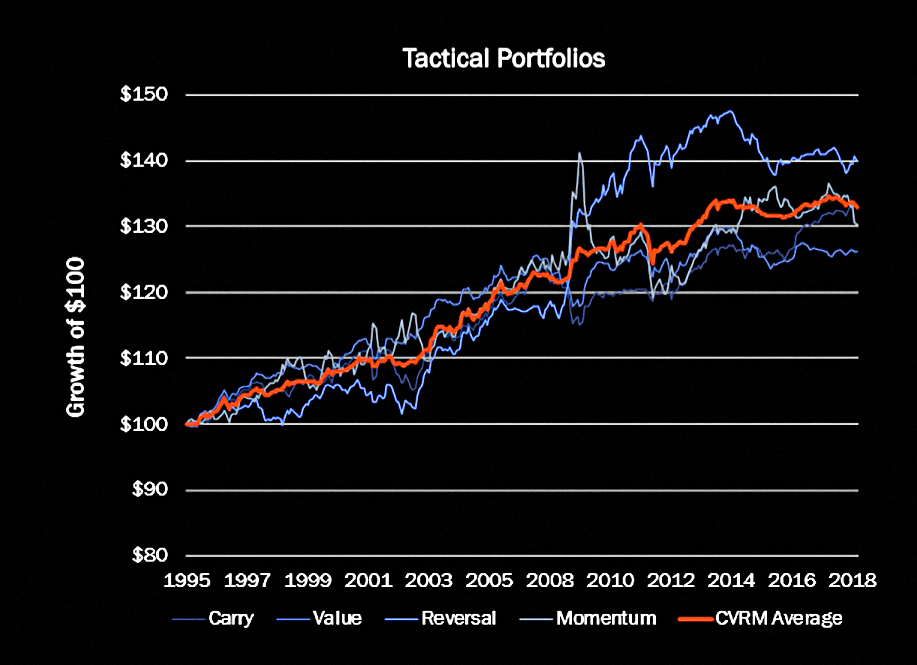
Here’s how it all fits together:
Market cycles

Michele Mazzoleni looked at the impact of market cycles on factors.
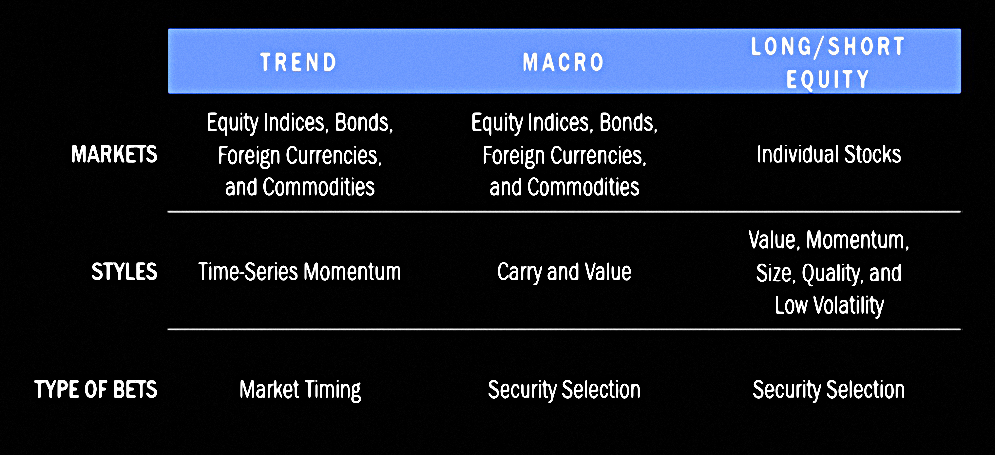
Here’s a table of the strategies under consideration.
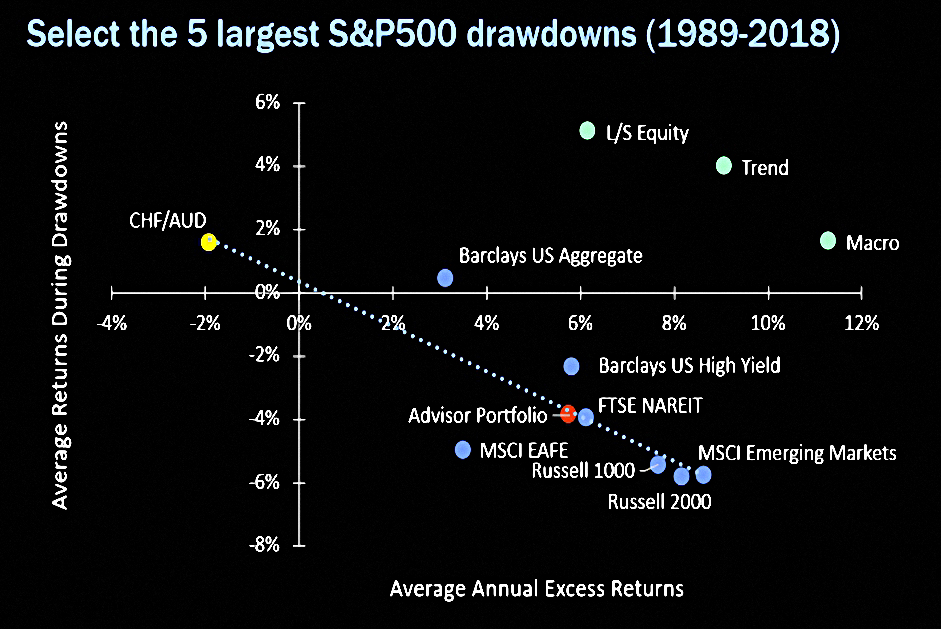
This chart shows what a great hedge those strategies can provide during drawdowns.
- It uses data from the five worst S&P 500 drawdowns between 1989 and 2018.

Which is not to say that factor strategy performance doesn’t vary between up and down months for the market.
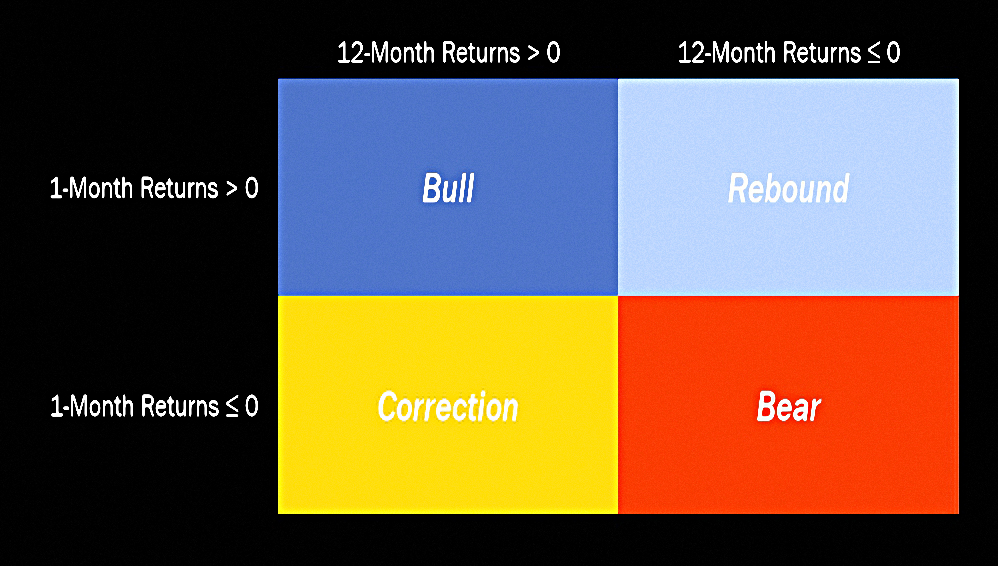
Michele uses 1 month and 12 month returns to divide the market into four states:
- Bull (up after up)
- Rebound (up after down)
- Correction (down after up)
- Bear (down after down)
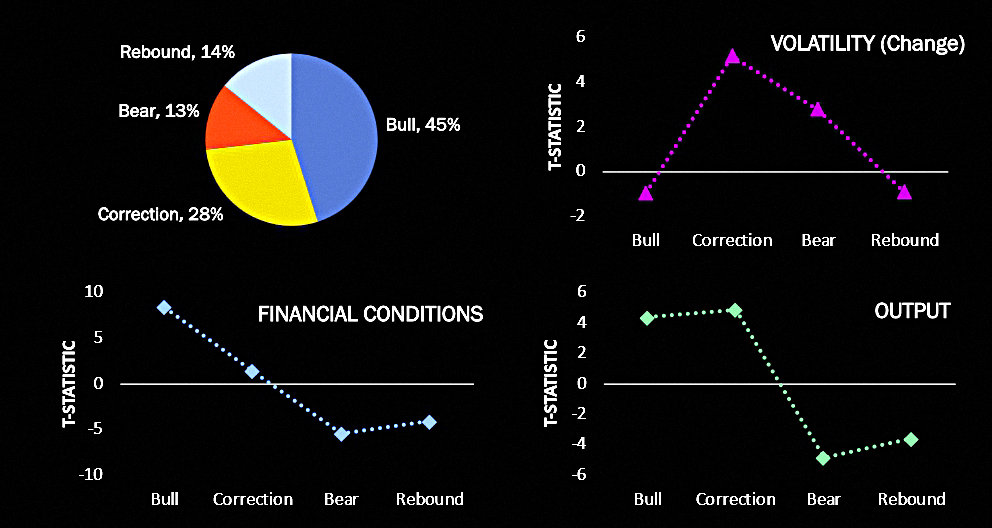
Here’s how those phases relate to macro conditions.
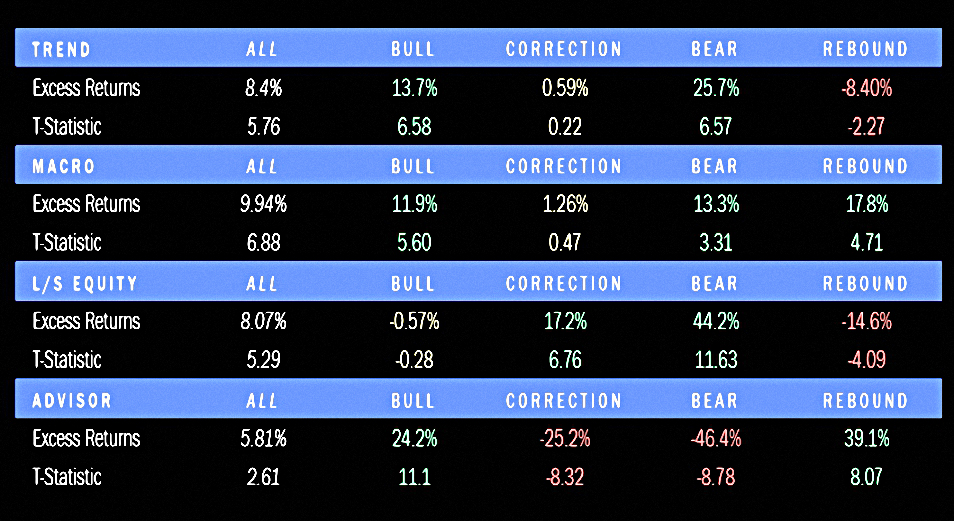
And here’s how the factor strategies work in each of those phases (1971 to 2018).

Note that the factor strategies underperform during up months for the market, so it’s important not to chase returns during the good times.

Michele points out that the Great Moderation is real.
- We’ve had fewer recessions and lower aggregate volatility since the 1990s.
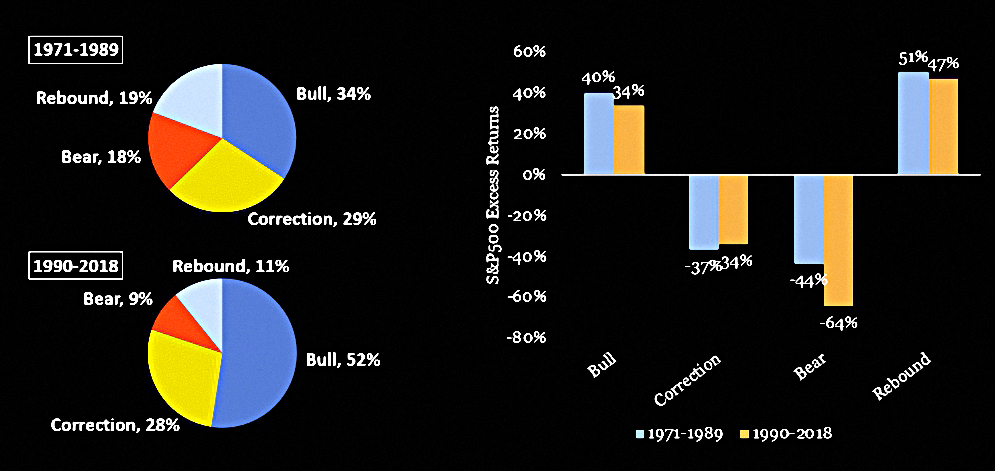
Bull phases have become more frequent, and bear markets have become deeper.
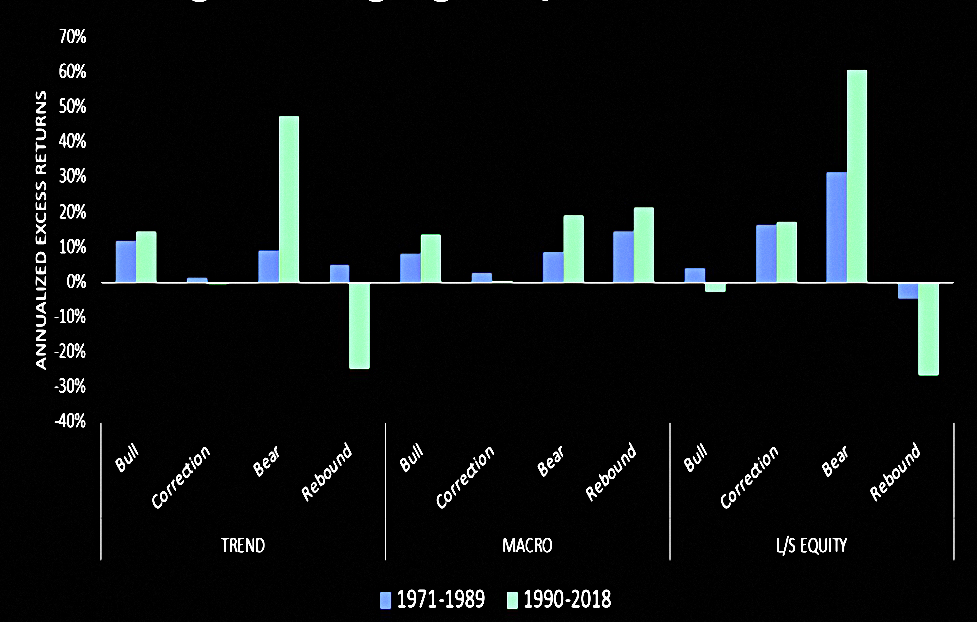
But the hedging properties of the factor strategies have not changed very much.
Conclusions
That’s it for today, and for our detour to the RA Symposium.
- It wasn’t all about factors, but a lot of it was.
The key takeaways for me are:
- Factors work less well over time, but they still work.
- All factors are cyclical, and a multi-factor strategy works best.
- Drawdowns can be worse than expected, and all factors can crash together.
- Valuations still matter, and lots of things are expensive right now.
- Top Dogs are dangerous to own for the long term.
- Carry (yield), value, momentum and reversal are valid tactics.
- Factor strategies have predictable characteristics through market phases.
- The Great Moderation is real, but factor strategies still offer good protection through bear phases.
- Factor strategies underperform during up months, so don’t chase performance during the good times.
In the next post in this series, we’ll return to the MSCI materials on factor investing.
Until next time.
Mike Rawson
Mike is the owner of 7 Circles, and a private investor living in London. He has been managing his own money for 40 years, with some success.