HFEA 6 – Leveraged All Weather and Risk Parity

Today’s post is another in our series on Leveraged Portfolios. We look at applying leverage to Ray Dalio’s All-Weather and Risk Parity Portfolios.
Contents
All Weather
We’re going to be looking at a very long blog post from Optimized Portfolio, which we’ve come across before in our analysis of HFEA and related Leveraged Portfolios.
- Inspired by HFEA, OP decided to apply leverage to the All-Weather Portfolio (AWP), which we’ve also come across before.
He ended up looking at leveraged Risk Parity (RP) portfolios as well.
The AWP is derived from Bridgewater’s All Weather Fund and is designed to be conservative and defensive through all economic conditions (like the Harry Browne portfolio).
- The version of AWP that OP looks at is the one immortalised by Ray Dalio’s interview with Tony Robbins, which is substantially more conservative than a regular RP portfolio.
Dalio sees two drivers of asset values:
- inflation/deflation
- rising/declining economic growth
Which leads to four economic seasons:
- higher than expected inflation
- lower than expected inflation
- higher than expected growth
- lower than expected growth
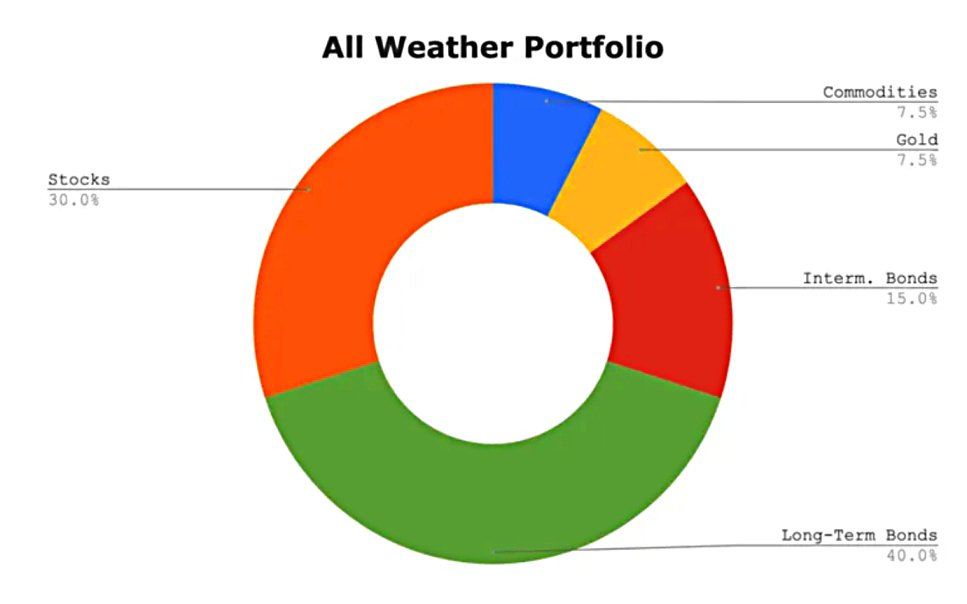
And in turn, to this asset allocation (as described to Robbins):
- 30% US stocks
- 40% long-term treasuries
- 15% intermediate-term treasuries
- 7.5% diversified commodities
- 7.5% gold
OP uses M1 Finance (not available in the UK) and Vanguard funds to recreate the portfolio as a “pie”: (( Trading 212 and InvestEngine are UK firms that have features similar to pies ))
- 30% VTI
- 40% VGLT
- 15% VGIT
- 8% IAU
- 7% PDBC (( M1 Finance doesn’t support non-integer percentage allocations ))
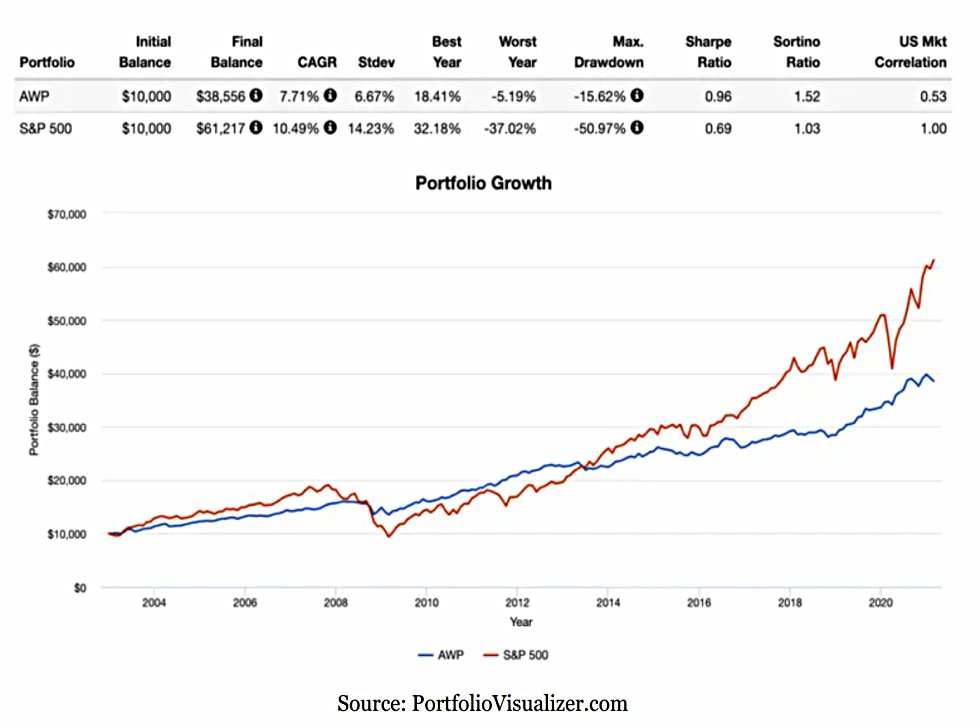
Portfolio Visualizer only has commodities data back to 2002, so OP shows the AWP vs the S&P 500 from 2002 to 2021.
- The AWP has half the volatility and a better Sharpe, but much lower returns (as you would expect with only 30% stocks).
Can leverage improve returns whilst keeping risk at S&P 500 levels?
Levered AWP
OP had trouble finding levered commodities ETFs, so he used oil-and-gas funds.
- The back-testing now only goes back to 2006.
OP also notes that the dangers of volatility decay are over-stated (as we have already discussed earlier in this series).
He constructs two portfolios. First up is the 2X portfolio:
- 30% SSO – 2x S&P 500
- 40% UBT – 2x LT treasury
- 15% UST – 2x IT treasury
- 7.5% DIG – 2x oil and gas
- 7.5% UGL – 2x gold
And now the 3X portfolio:
- 30% UPRO – 3x S&P 5
- 40% TMF – 3x LT treasury
- 15% TYD – 3x IT treasury
- 7.5% GUSH – 3x oil and gas
- 7.5% UGLD – 3x gold
In April 2020, GUSH was reduced to 2X. OP decided to replace commodities with Utilities, and this is discussed later on.
- In June 2020, UGLD was delisted, so OP replaced it with the 2X UGL.
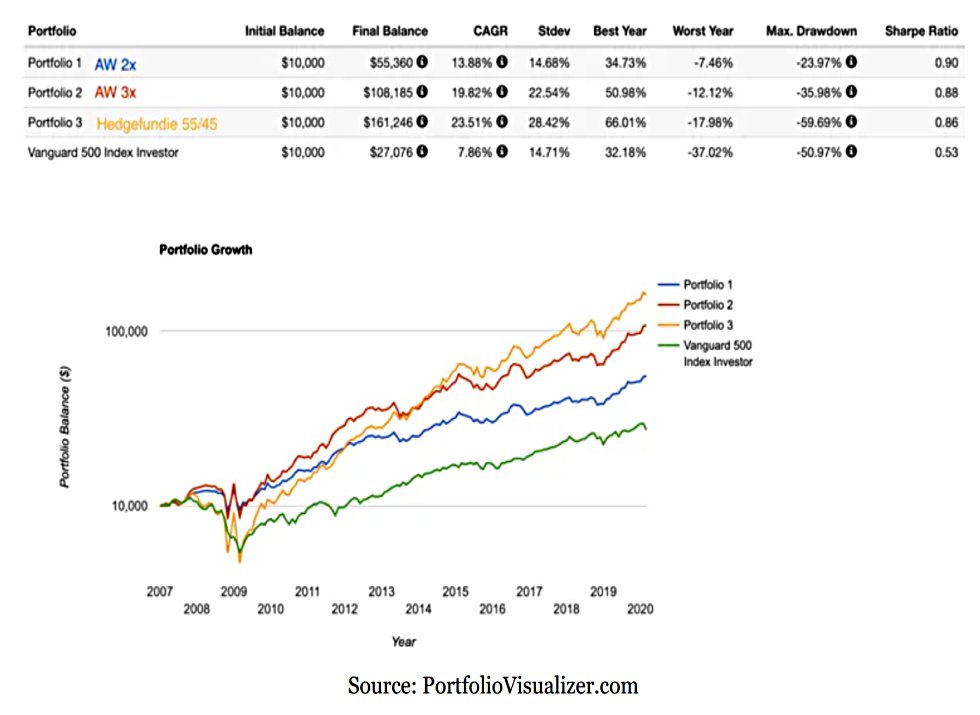
The 2X AWP has the best Sharpe, with similar volatility to the S&P 500 but a smaller max drawdown and a better worst year.
- 3X AWP and HFEA are more volatile, but end up with better returns (particularly HFEA).

This chart focuses on the 2X AWP (notice the much smaller vertical axis).
- It handily beats the unleveraged AW, plus 60/40 and the S&P 500 (the 60/40 has the highest Sharpe, but much lower returns).
Utilities
OP likes Utilities as a substitute diversified for commodities and/or REITs.
Over the past 20 years, the Utilities sector has had the lowest correlation to the total stock market of any sector, lower than that of both Commodities and REITs – specifically, 0.38 for Utilities compared to 0.53 for Commodities and 0.59 for REITs.
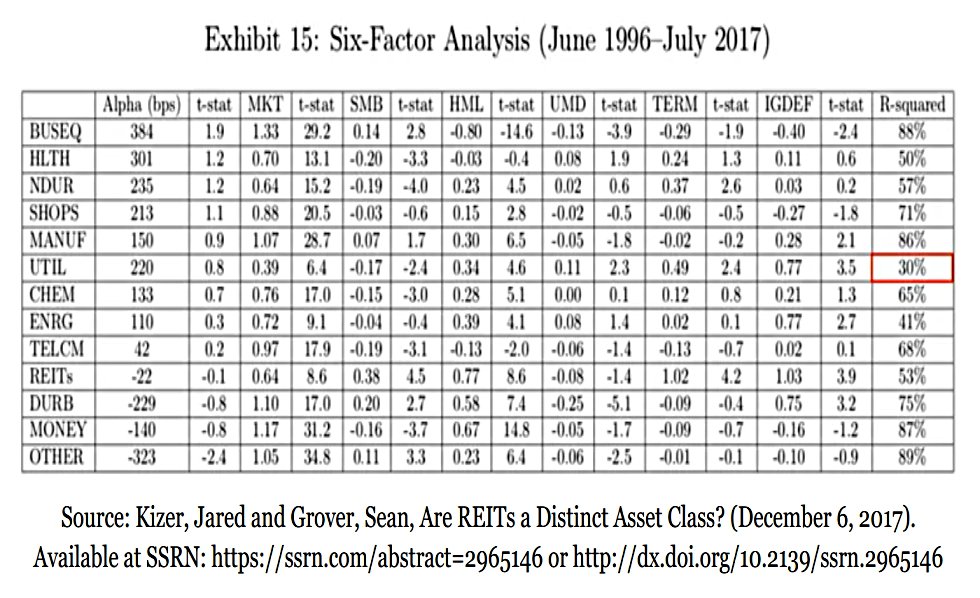
He also notes that:
Utilities are the least explained by the known equity factors that explain the differences in returns between diversified portfolios. Their R-squared ratio is notably lower than that of REITs.
OP compared portfolios that were 90% total (US) stock market with 10% tilts to the three diversifying options:
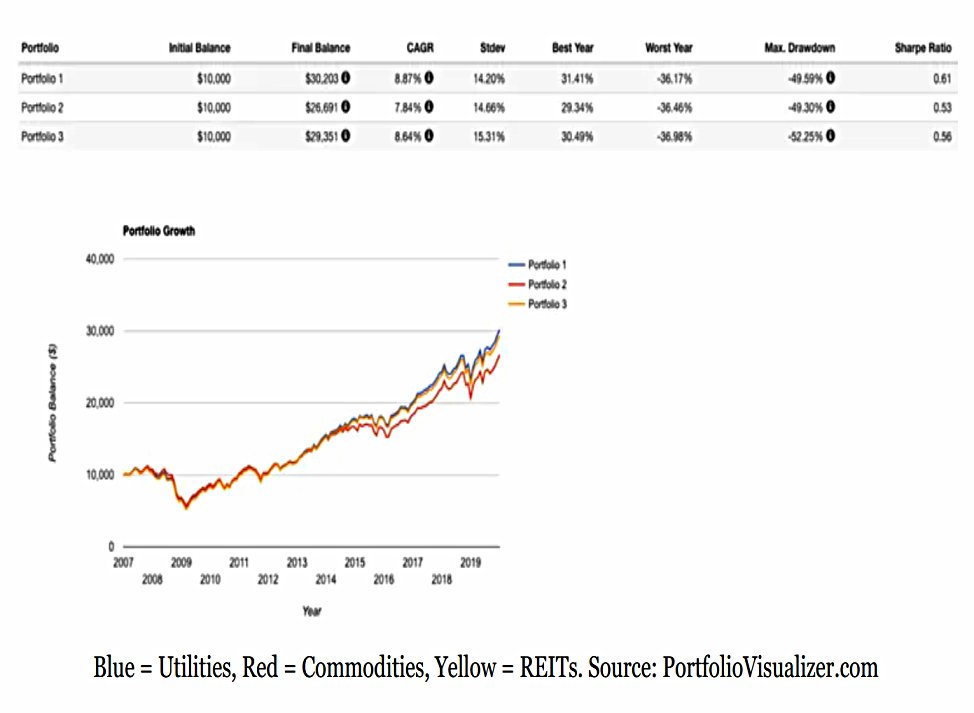
The results look good.
- My only concern with utilities is regulatory risk, so I would be inclined to use all three diversifiers where this is practical.
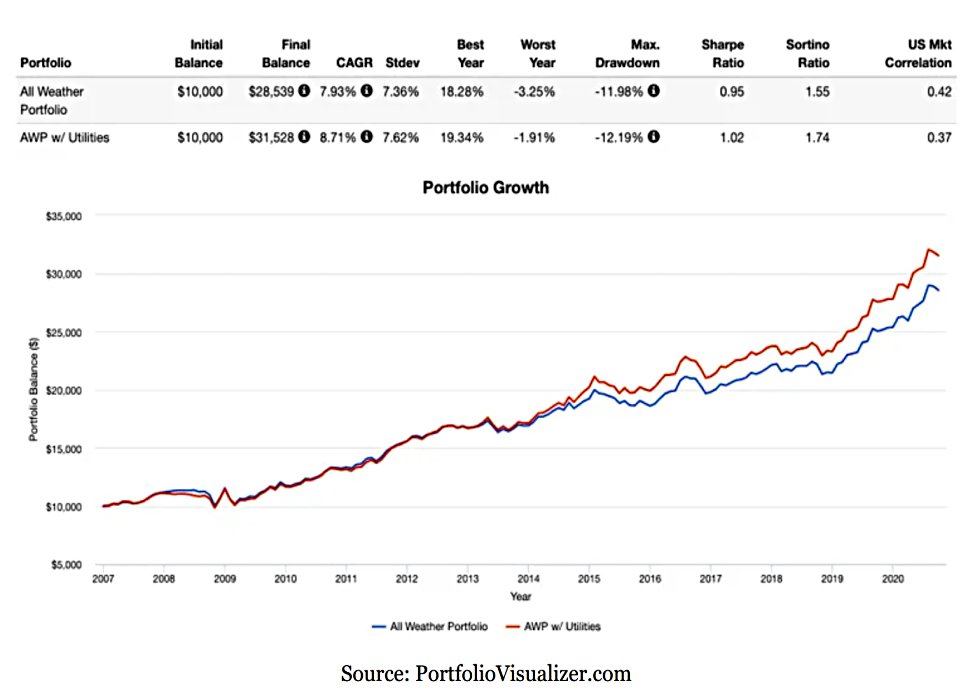
This chart compares the unleveraged AWP with the modified AWP using utilities instead of commodities.
This is the modified portfolio:
- 30% VTI
- 40% VGLT
- 15% VGIT
- 8% VPU
- 7% IAU
Leveraged Utilities
The next step is a levered portfolio with Utilities:
- 30% UPRO – 3x S&P 500
- 40% TMF – 3x LT treasury
- 15% TYD – 3x IT treasury
- 7.5% UTSL – 3x utilities
- 7.5% UGL – 2x gold (( UGLD was retired ))

OP looked at 2X AWP-U and 1X AWP-U as well as 3X APW-U.
- They all have the same Sharpes (higher than the S&P 500) and the levered versions have much higher returns.
This is the 2X AWP-U allocation:
- SSO – 30%
- UBT – 40%
- UST – 15%
- UPW – 8%
- UGL – 7%
Leveraged Risk Parity
The final section of the article looks at applying leverage to a true risk parity portfolio (based on AWP). Here’s the unleveraged version:
- VGLT – 15%
- VTI – 20%
- VGIT – 40%
- VPU – 13%
- IAU – 12%
And here’s the leveraged version, accounting for the lack of a 3X gold fund:
- TMF – 14%
- UPRO – 14%
- TYD – 39%
- UTSL – 12%
- UGL (2X) – 21%
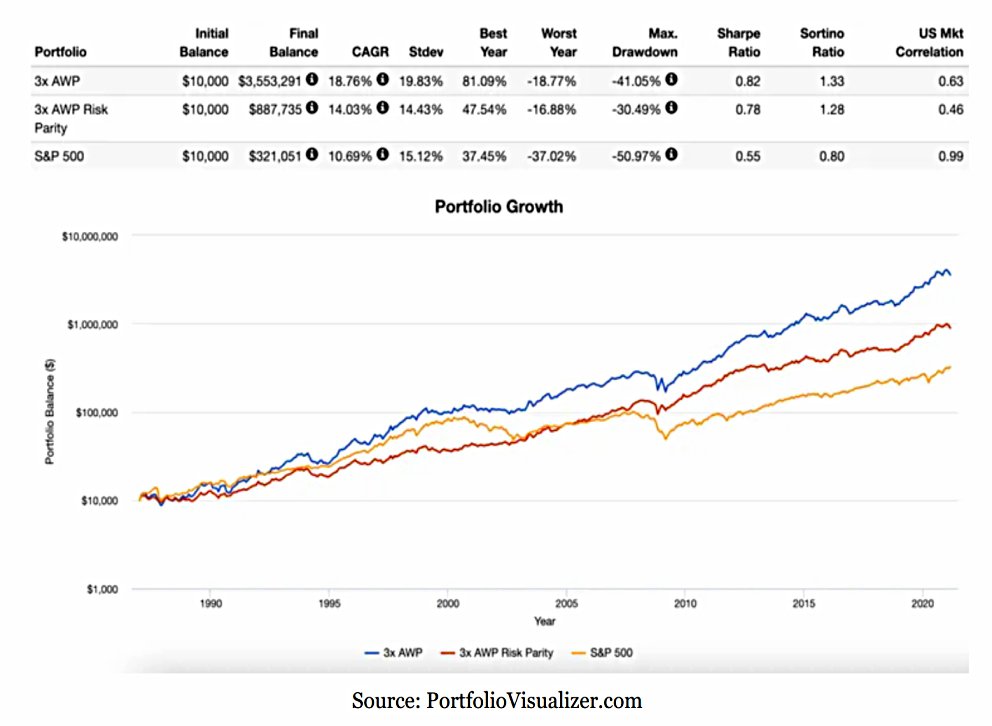
From 1987 to 2021, the RP version has lower volatility and drawdowns, but also lower returns.
- OP notes that the same is true for an unleveraged comparison.
So whilst RP might make more sense as a total portfolio, for a leveraged satellite portfolio, AWP should provide better returns (and HFEA even better than that).
Inflation and Rising Rates
OP has a few suggestions on how to modify the portfolios to cope with rising interest rates and with inflation:
- TIPS (the US version of linkers)
- Financials
- Emerging Markets and China
- REITs
He doesn’t provide backtests for these options.
Rebalancing
OP looked at rebalancing with the 3X AWP-U:
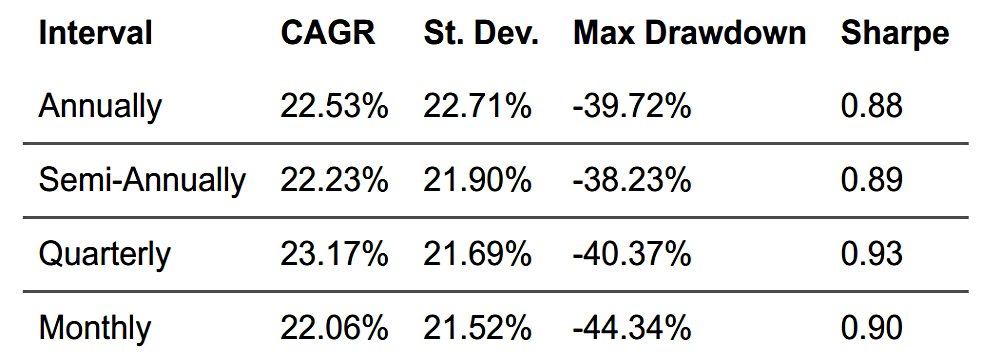
The quarterly option worked out best.
Conclusions
It’s been a really interesting article for me, both in terms of comparing AWP and RP with the regular HFEA option and also for the large number of potential diversifiers that OP has considered.
- But we still have quite a few more articles in this series before we come to design our own Leveraged Portfolio.
Until next time.
Mike Rawson
Mike is the owner of 7 Circles, and a private investor living in London. He has been managing his own money for 40 years, with some success.