How the UK Saves – NEST Workplace Pension

Today’s post looks at a report from NEST the workplace pension provider, and Vanguard. It’s called How the UK Saves but it’s really about the NEST Workplace Pension.
Contents
How the UK Saves
As I mentioned in the intro, the rather grand title is misleading.
- It’s really just an analysis of the NEST workplace pension scheme.
That’s still of interest to me because:
- I want to see whether auto enrolment workplace pensions can replace the dying DB schemes of yesteryear, and
- I operate a workplace pension scheme with NEST, of which my partner is a scheme member.
- I have fixed protection on my own pension, and so can’t make any more contributions.
Vanguard

Henry Tapper of Pension Playpen attended the accompanying “NEST insight conference”, which was held in the old City of London School at Blackfriars.
- This is now a JP Morgan building (( I used to work in it for a few years )) but the conference was sponsored by Vanguard.
Although Vanguard is potentially one of NEST’s greatest competitors (they don’t actually offer a pension in the UK at present), NEST’s data is being shared with them (in part so that they could produce this report on behalf of NEST.
- As Henry says, this is strange behaviour for a government-sponsored scheme with massive borrowings (from the DWP and hence the taxpayer) that will need to be repaid one day.
Another strange feature of the report is that is is “not to be distributed to the public”, even though it is freely available for download from the NEST Insight website.
The data was collected in January 2018, before the rise in contribution rates.
- The employee rate change – from 1% pa to 3% pa – may or may not affect the opt-out rates.
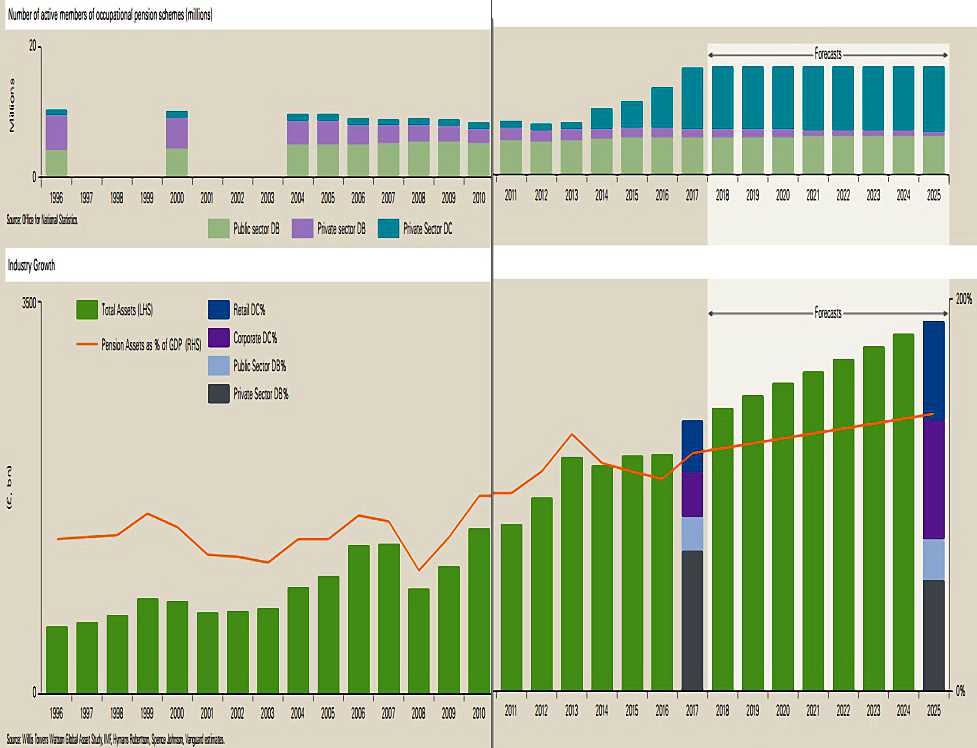
Industry background
The report includes a useful summary of how the pensions industry has evolved in recent years.
- If it looks a bit squished, its because I had to stick together the two parts of a double-page spread.
Adoption
For good reason, NEST is keen to demonstrate how well the auto-enrolment adoption process has taken place.
- So we’ll get that out of the way first, and then take a closer look at the members pension pots.

Since 2011, NEST has enrolled 6.5M members and 616K employer firms.
- Workplace pensions are now held by 75% of eligible workers, up from 55% in 2011.
Turnover is high – in any given year, around 40% of members change jobs so that they no longer have an active NEST pension.
- Another 6% of new members and 2% of existing members opt-out.
More than half of NEST’s members have had an account with them for less than a year.
Employers
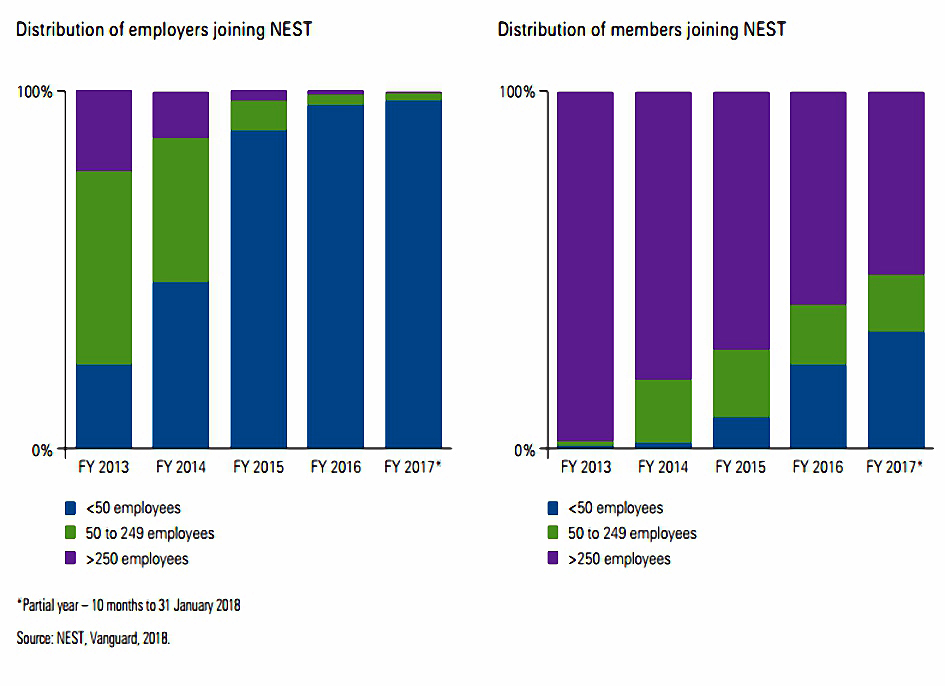
Large employers were enrolled first, then smaller firms.
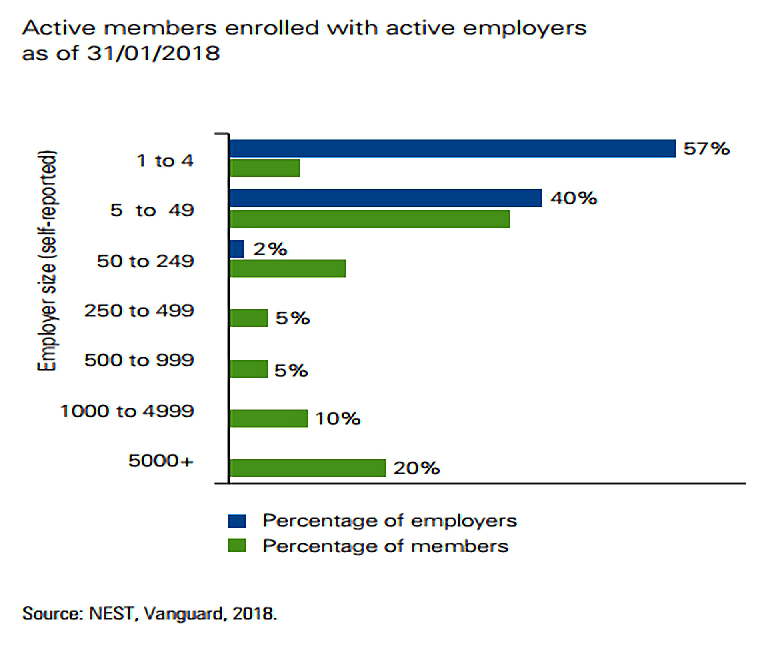
There are many more smaller firms, but the 1% of firms with more than 250 workers account for 40% of NEST members.
Member enrollment
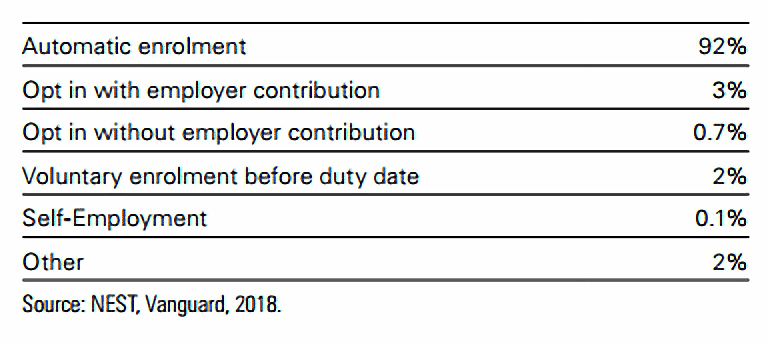
As you would expect, most members have been automatically enrolled.

Member demographics
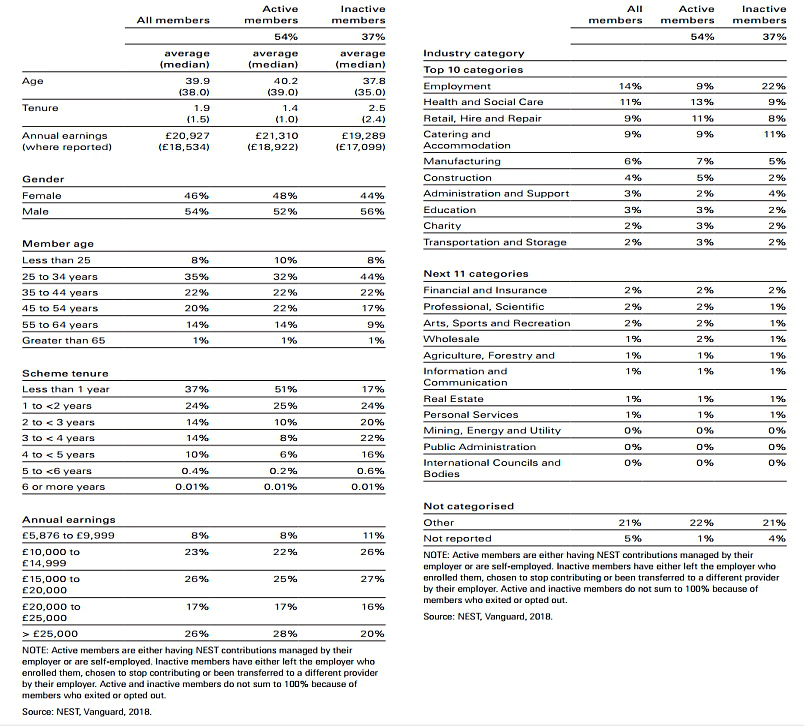
The average member is 38 years old and earns £18.5K pa.
- More than half earn less than £20K and three quarters less than £25K.
More than half are aged below 35 (and are therefore millennials).
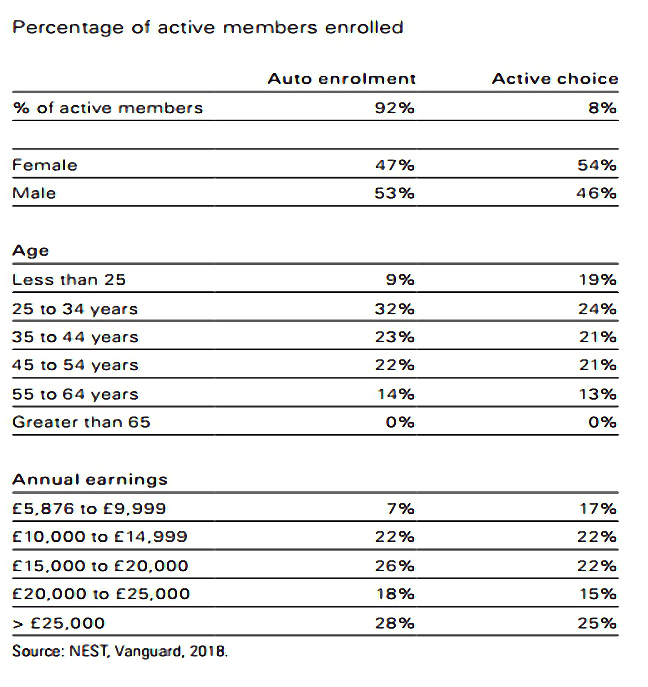
Opt-outs

Opt out rates are lower than anticipated, but not negligible.
- 11% of “existing workers” enrolled by their employer have chosen to opt out.
New hires opt out at a lower rate of 6%, so NEST makes the argument that now that the rollout is complete, opt-out rates may fall.
At the same time, it will be interesting to see what happens as employee contributions rise from 1% pa to 5% pa.
- The evidence from the small sample of firms who chose to auto-enrol workers at contribution rates higher than the minimum is that this does increase opt-out rates.
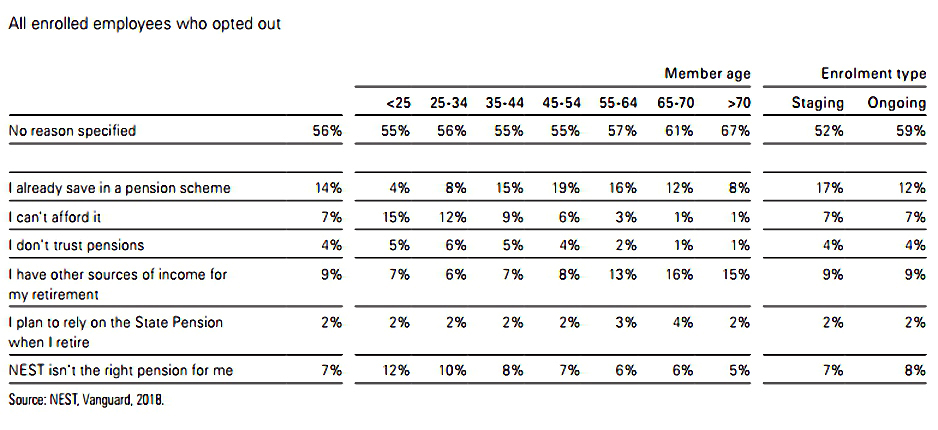
Most leavers don’t provide a reason why.
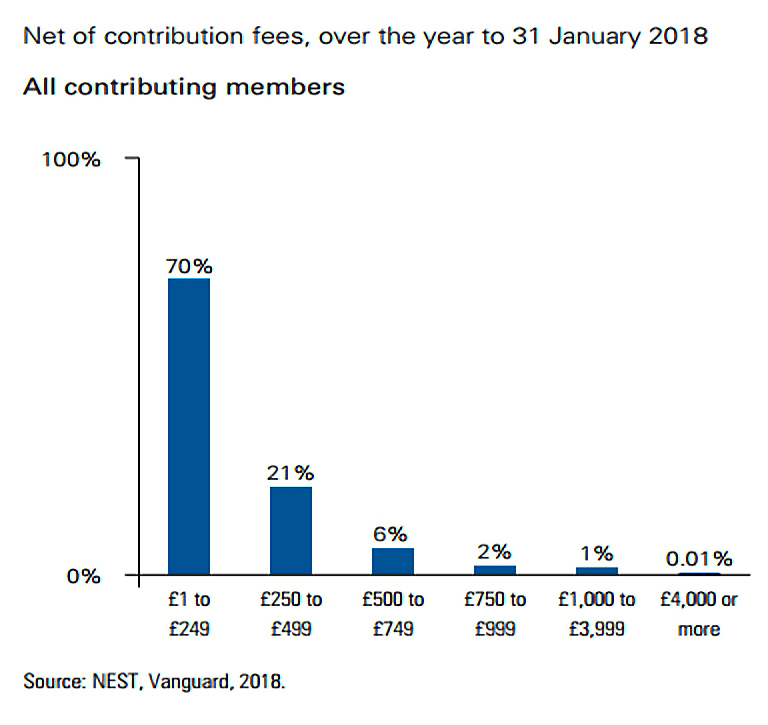
Contributions
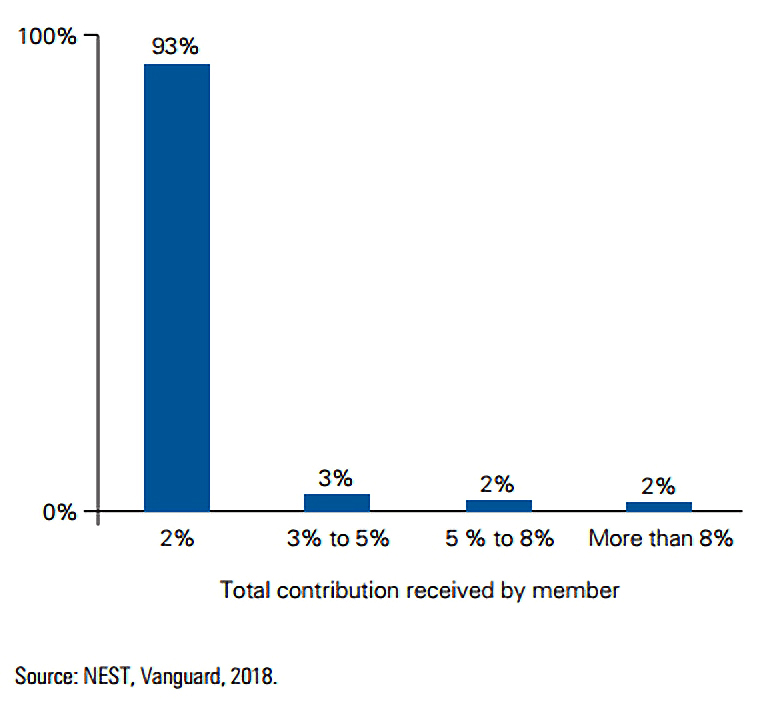
93% of employers make the minimum contribution (2%).

Annual contributions average £394, with a median value of £300.
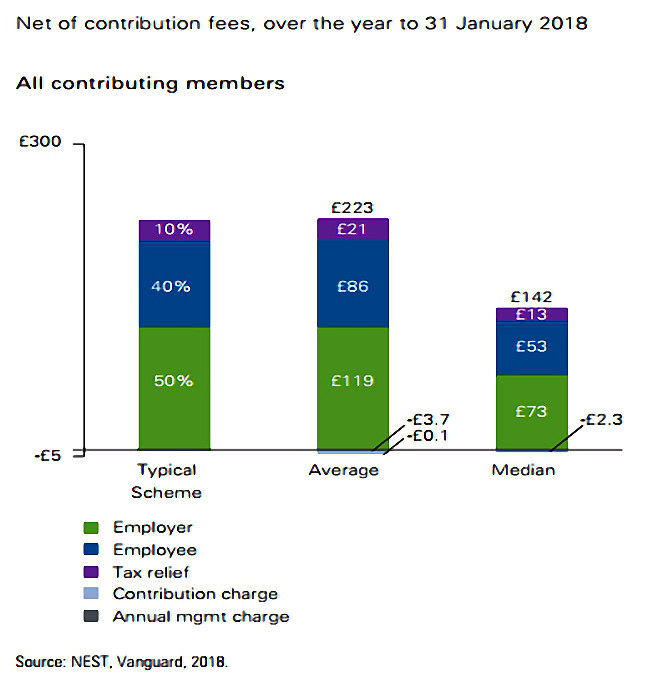
That’s not enough for anyone.

Account balances
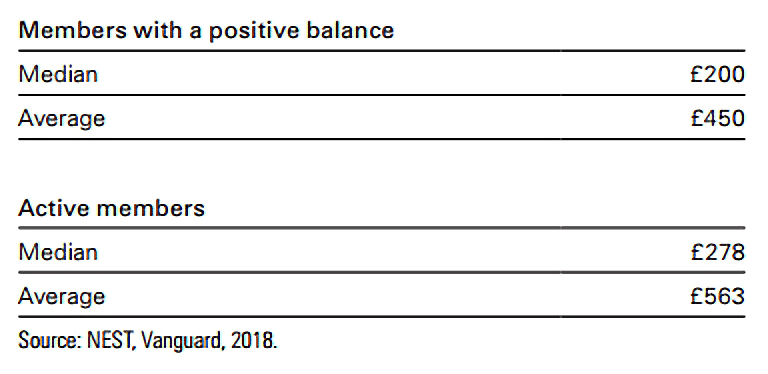
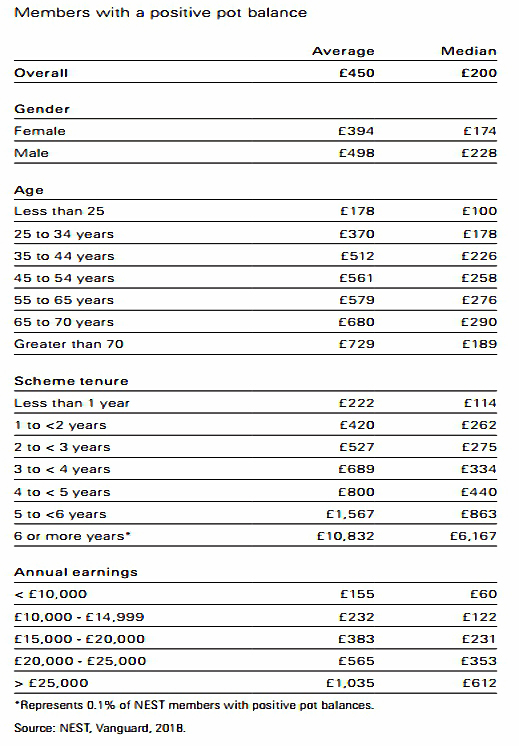
The average account balance is £450, with a median value of £200.
- Active members have an average balance of £563, with a median value of £278.
Men have higher balances because they have higher earnings.
- Pound for pound, women make higher contributions.
Replacement rates
NEST more sanguine about these numbers than I am:
A typical low-income 22-year-old [on £9K pa] might generate annual retirement income of £3,000 in today’s money, amounting to a replacement rate of 15%.
Combined with the State Pension, this represents a projected total income replacement rate of approximately 55%.
NEST uses a ludicrous withdrawal rate of 6% pa on a final pot of £50K to reach this conclusion.
- I also don’t see how a State Pension of £8K plus a NEST pension of £3K total to 55% of an original salary of £9K.
- Perhaps the replacement income is being compared to some national average, or poverty-avoidance requirement.
NEST sees this state of affairs as “considerable progress”, though even they are forced to admit that more is required.
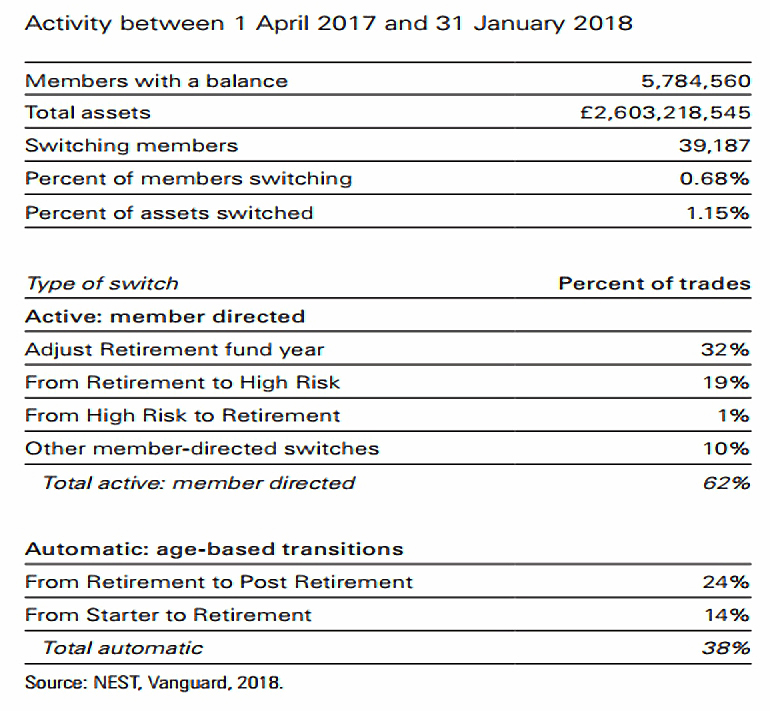
Assets
Total NEST assets are now £2.6 bn.
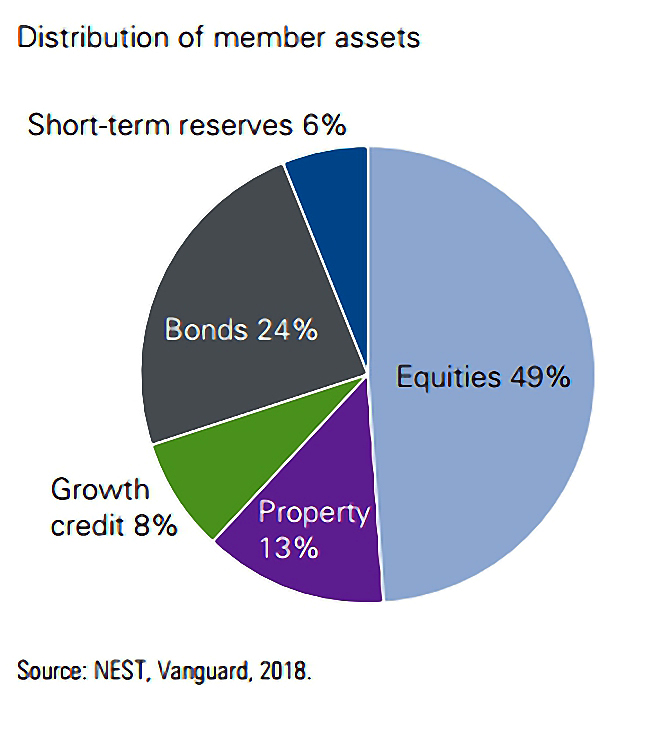
The money is allocated 49% to equities, 13% to property, 8% to “growth credit” (whatever that is), and 30% to cash and bonds.

99% of members use the default allocation (retirement date funds).
Here’s the “glide path” asset allocation:
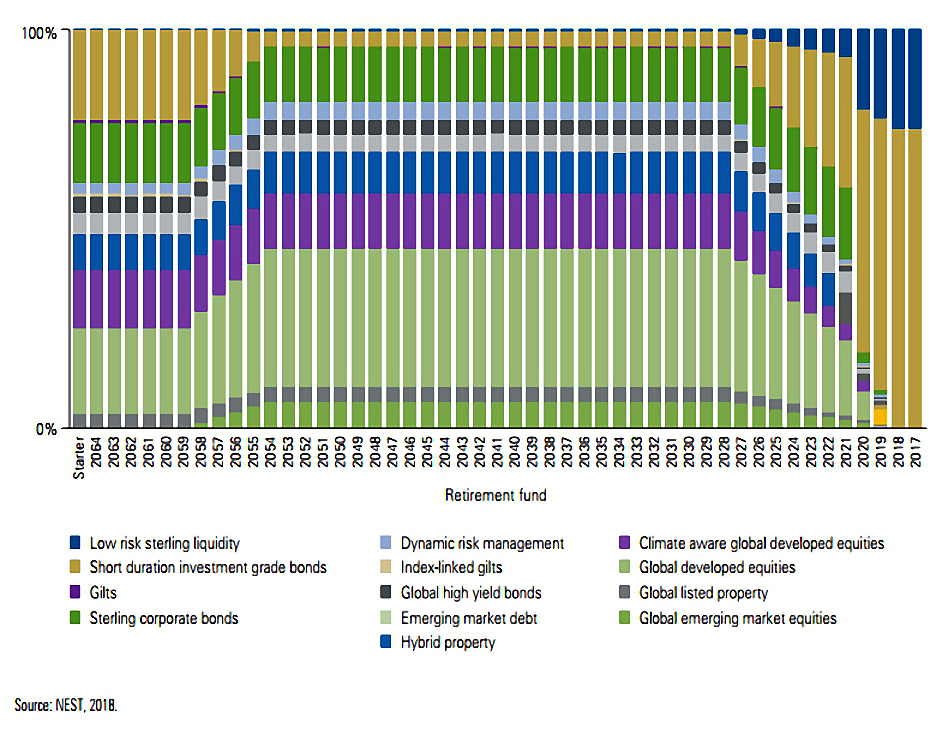
Note that this type of glide path (more bonds with age) is only suitable for people planning to buy annuity (which are currently very poor value).
- Most people need to increase their level of equities in retirement.
Fewer than 1% of members have switched funds in the previous year.
Returns and benchmarks
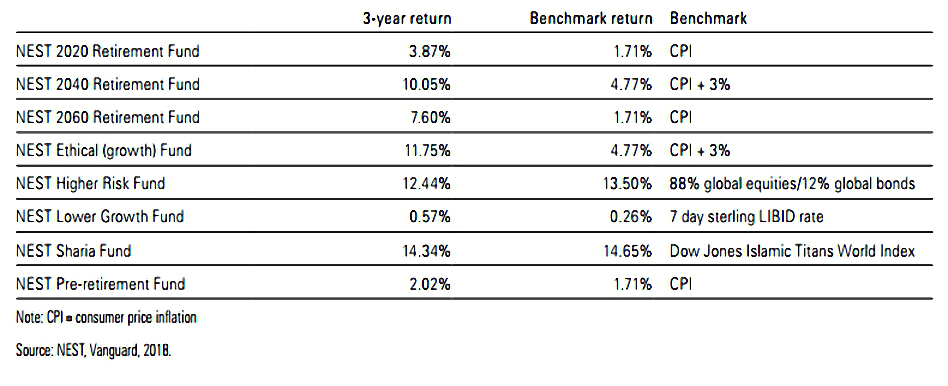
Three year-returns for the NEST funds have beaten their benchmarks.
- But then, some of the benchmarks look pretty easy to beat to me.
Transfers
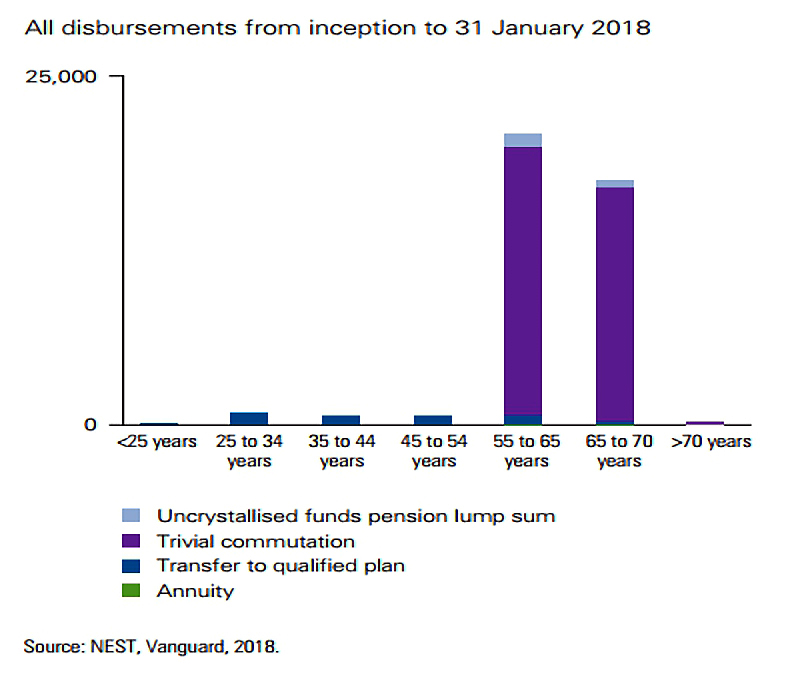
Only 1% of NEST members have retired.
- Of those, two-thirds have withdrawn money.
As I reported last year, NEST members can now transfer in old pensions.
- This bypasses the initial charge, leaving only the very competitive annual charge (0.3% pa).
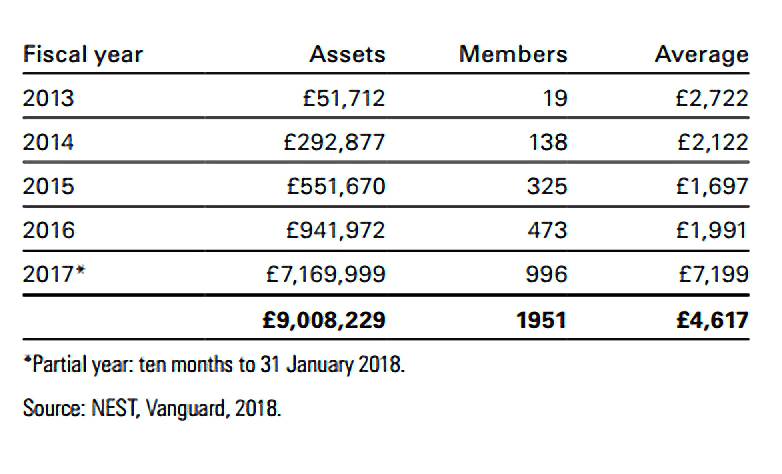
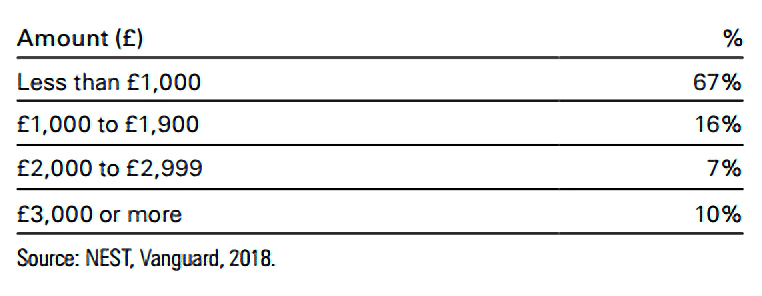
Despite this, only 1,000 members transferred a pension.
- A total of £7M was transferred in (£7K per member).
Conclusions
It’s a good job that the report’s title isn’t accurate, because these numbers are totally inadequate for a nation’s savings.
- NEST is a good product, but it isn’t attracting the cash.
Most big corporations use only for the bottom end of their employees.
- Small companies like mine use it because it is cheap to operate.
As the years go by – and assuming we can avoid an opt-out crisis as minimum contribution rates increase – the numbers should improve.
- But will NEST (and workplace pensions in general) ever come close to replacing DB pensions?
I suspect not, and future generations will have to get by with less.
- Or go down the DIY route.
Until next time.
Mike Rawson
Mike is the owner of 7 Circles, and a private investor living in London. He has been managing his own money for 40 years, with some success.