Long Vol

Today’s post looks at how Private Investors can best add a Long Vol (long volatility) component to their portfolios.
Contents
Dragon portfolio
Our interest in Long Vol comes from the long-term Dragon Portfolio described in “The Allegory of the Hawk and Serpent”, a paper we looked at back in March 2020.
- This portfolio allocates 18% to what is described as “active long volatility”.
The paper explains this as:
Buying Equity volatility (via options) in the direction of the market after a move greater than +/- 5% in either direction over any rolling three months. The strategy, is intended to represent a profoundly simple (and less effective) replication of what Active Long Volatility managers do.
And more specifically:
Buying out-of-the-money equity put options if the market is down -5% or more and purchasing out-of-the-money equity call options if the market is up +5% or more over any rolling three months.
The paper doesn’t say what the expiry date on the options should be, or whether positions should be closed if the market mean reverts below the 5% trigger threshold.
- The simplest and most likely interpretation is that they are monthly options held to maturity.
A version of this approach would be relatively simple (though possibly expensive) to implement, but since few UK private investors trade options, I wanted to explore alternatives that might produce similar results.
Factor research

Nicolas Rabener at Factor Research has produced three notes on building a Log Vol strategy without using options.
- He uses currencies and bonds instead.
Portfolio insurance works differently than real-world insurance in that investors would like their diversifying strategies (the most popular form of protection) to earn a return.
- Real-world insurance has a mostly negative return, except for the year that you call on it.
Even then, it should work out negative over the long run, or the insurance companies would be out of business.
- What you are really paying for is lower volatility.
Bonds have worked brilliantly as diversifiers over the last forty years as interest rates and inflation have fallen.
- But there is a question mark over whether they can offer the same protection as inflation returns and interest rates potentially rise.
Long Vol is an obvious candidate for portfolio insurance since volatility usually spikes when stock markets crash.
- But like insurance, it should lose money in most years when no crash occurs.
Nicolas distinguishes between Long Vol allocation and Tail Risk strategies:
Tail risk strategies generate more extreme returns and only rarely positive ones, while the latter often benefit from rising as well as higher volatility.
The data
Nicolas looked at the correlations of 59 asset classes (equities, bonds, commodities, and currencies) with the VIX between 2006 and 2021 (which includes both the 2008 crisis and the 2020 Covid crash).
Almost all asset classes are implicitly short volatility as they are bets on the economy doing well. Occasionally there are periods like during the tech bubble in 1999 when stocks were volatile and going up, but mostly increasing volatility means markets are declining or crashing as a result of deteriorating economic conditions.
He describes this as 13 observation periods, so presumably, three-year correlations were being used.
- The higher the correlation/ranking, the more suitable is the asset for a Long Vol portfolio.
Three portfolios were constructed using the best 5%, 10% and 20% of assets (3, 6 and 12 respectively).
- All three portfolios contained only bonds and currencies (no stocks, no gold or commodities).
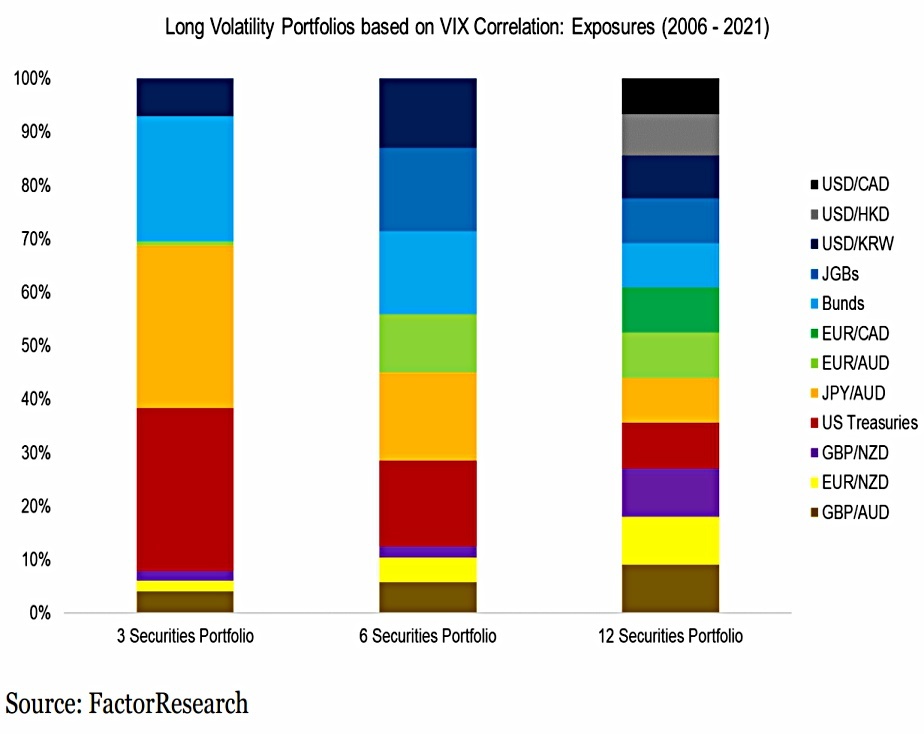
The 3-asset portfolio is generally made up of US treasuries and currency pairs, specifically developed world currencies (USD, EUR, GBP, JPY) against commodity currencies (AUD, CAD).
These instruments are frequently called safety havens, so their inclusion is not unexpected.
Performance
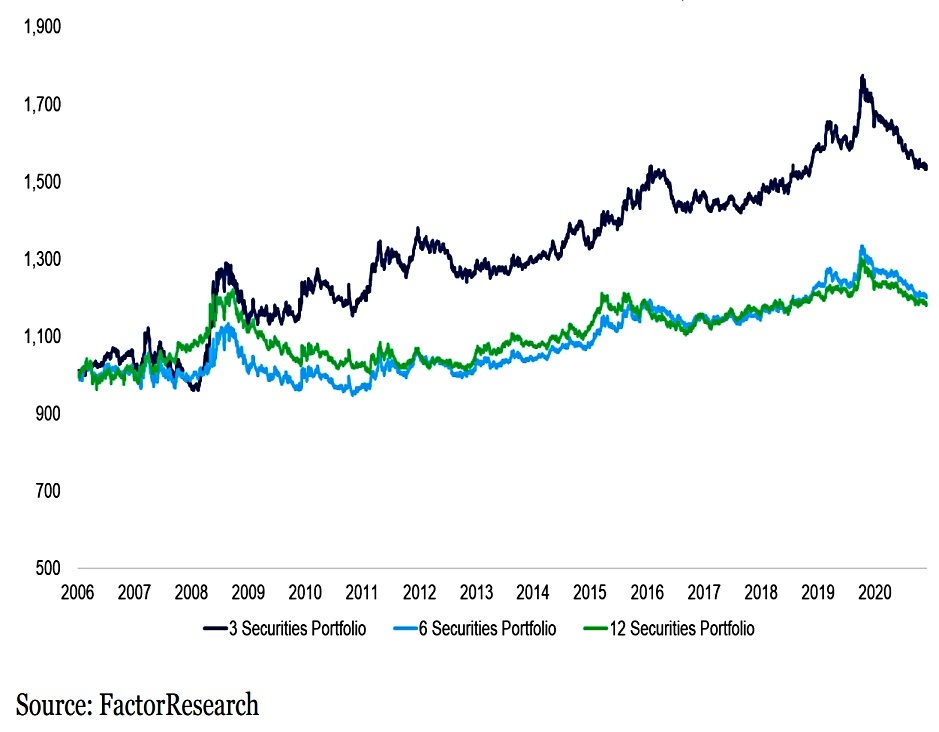
The concentrated portfolio performed best, probably through more exposure to government bonds.
The portfolios had moderately negative correlations to the S&P 500, as would be expected.

When blended at 20% weighting with the S&P 500, they led to lower drawdowns, particularly in 2008.
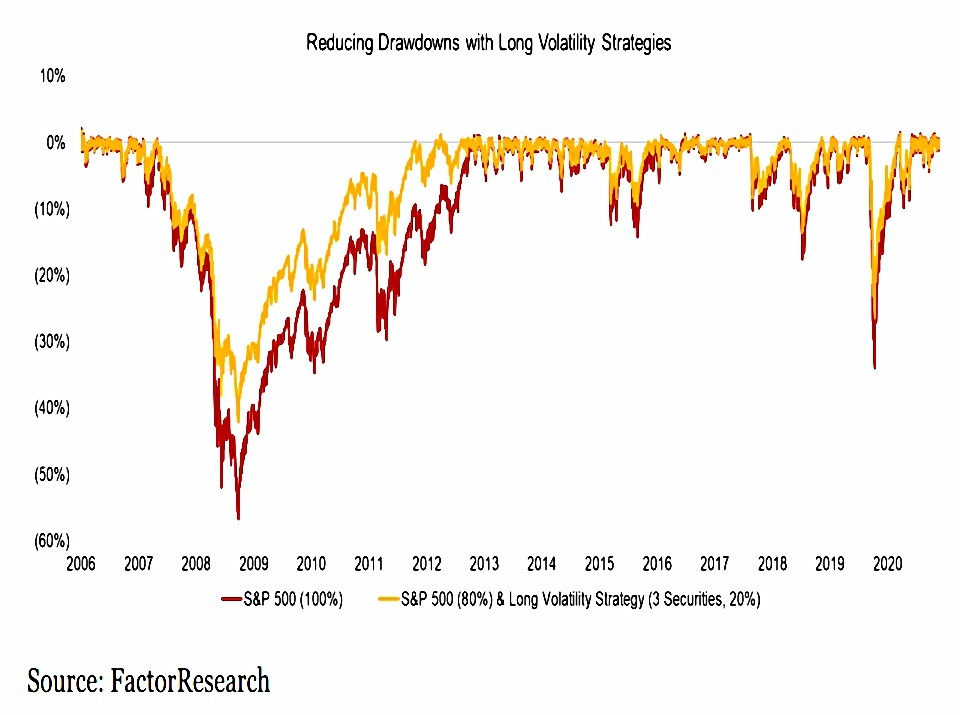
The blended portfolios had lower returns, as expected.
The annualized return decreased from 8.6% for an all-equity portfolio to 7.9%, 7.4%, and 7.4%, respectively.
But the Sharpe Ratios were higher, meaning that leverage could be used to increase returns to a target value.

Robustness
In the second paper, Nicolas tested the robustness of his findings.
- He began by varying the lookback period for the VIX correlation.

He also looked at delaying the signal for longer than the one week originally used:
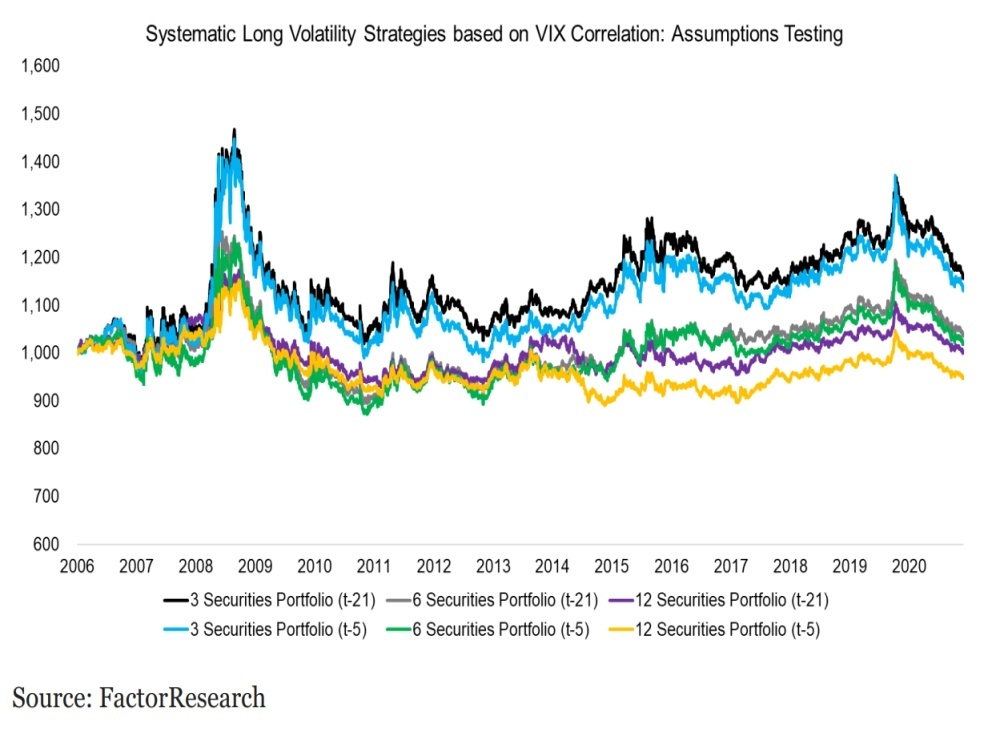
Neither change affected the return profile significantly.
VIX ETN
Nicolas also tested the performance of the Long Vol portfolio against a VIX ETN.
These products are emotionally difficult to hold as they tend to generate strongly negative returns most of the time – they exhibit strong positive skew.
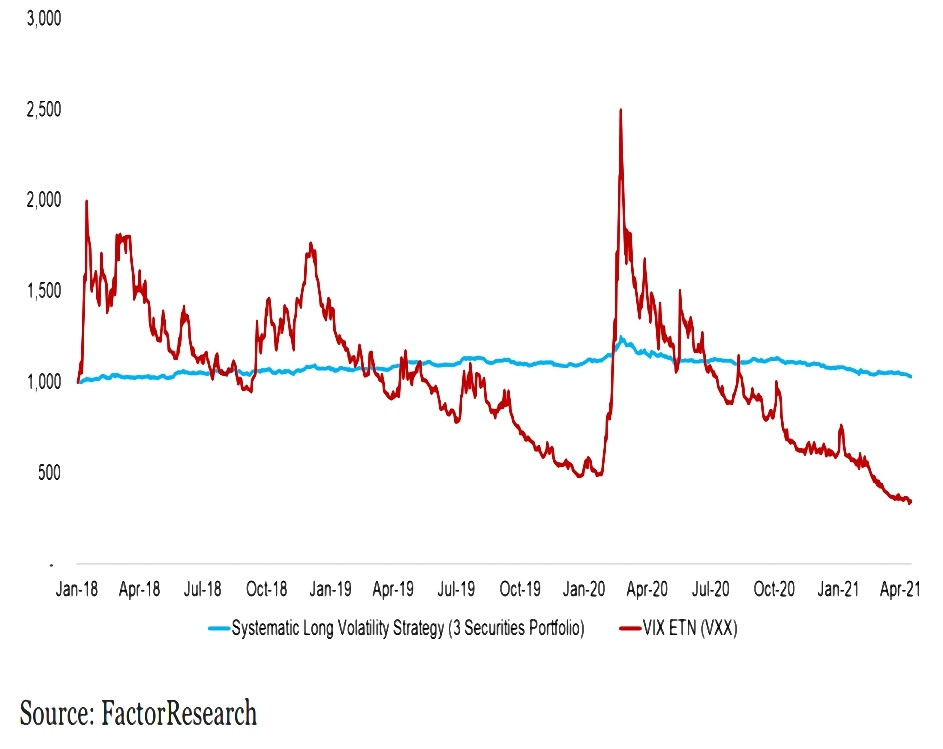
The systematic long volatility strategy seems like a watered-down version of the VIX ETN. It did not lose money consistently, but it also did not produce outsized returns when volatility spiked during stock market crashes.
Allocation to Long Vol
Nicolas also looked at the effect of different allocations to the Long Vol portfolio.
The larger the allocation to the long volatility portfolio, the lower the return would have been. The S&P 500 increased significantly during 2006 and 2021, while the performance of the long volatility strategy was essentially flat.
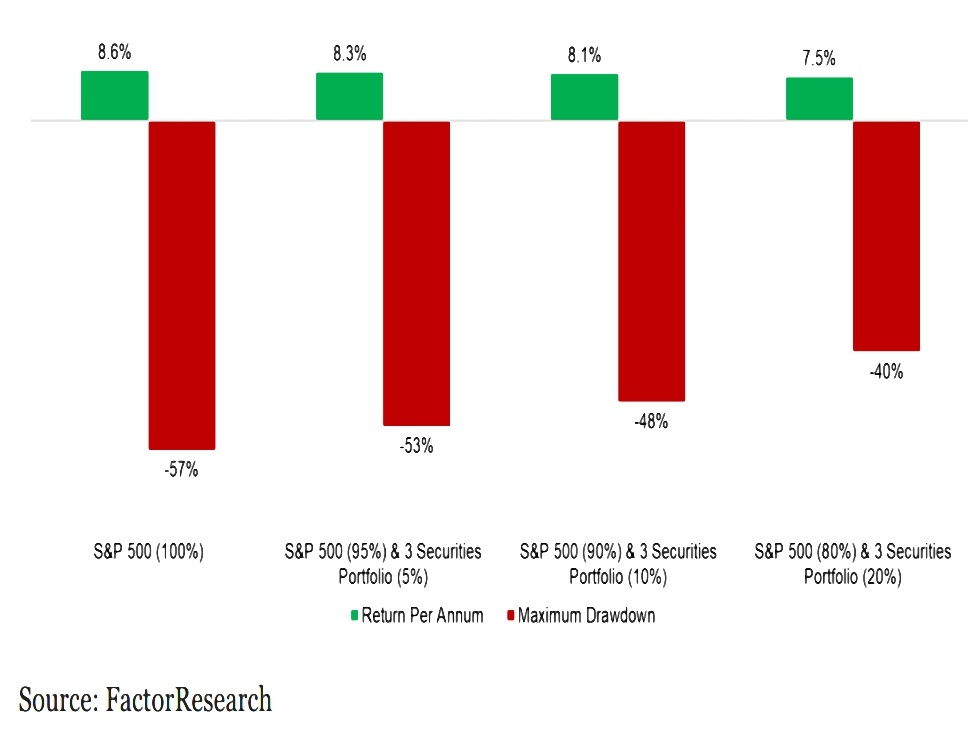
But the max drawdown also decreased, and the Sharpe Ratio (risk-adjusted returns) increased.
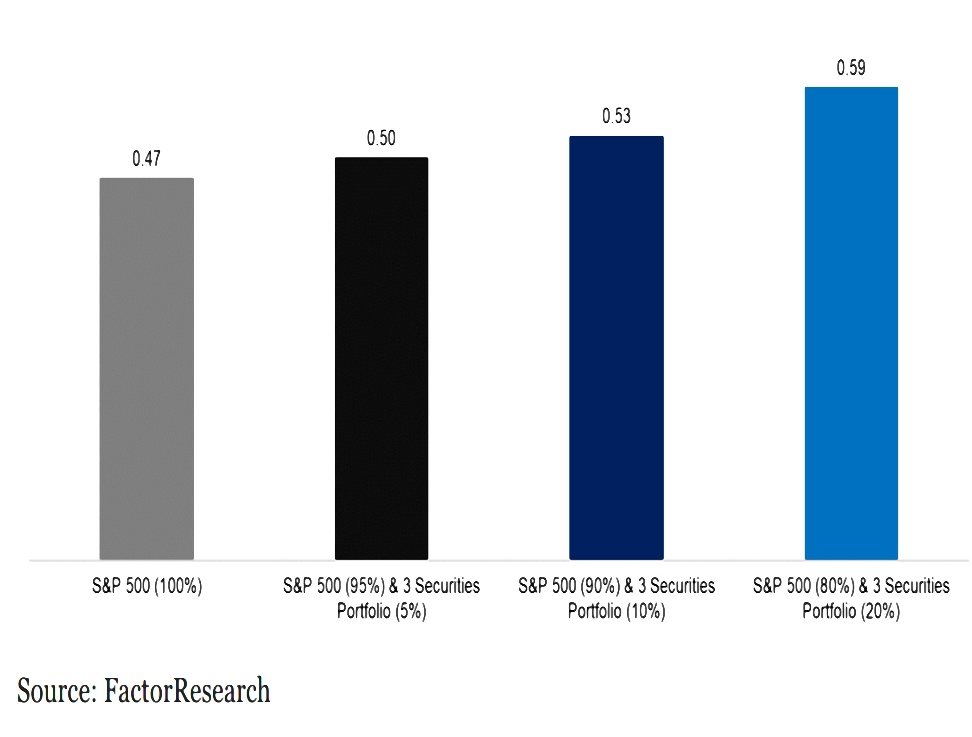
Although investors can’t “eat” Sharpe ratios, most also can not execute a buy-and-hold strategy over a market cycle. The typical investor enters the market at peaks and sells at the bottom, driven by greed and fear. Adding a strategy that improves the consistency of returns on portfolio level and perhaps mitigates some of this behaviour seems desirable.
Other risk metrics
In the third note, Nicolas looks at alternative risk metrics.
We started our exploration of long volatility strategies by analyzing the Eurekahedge Long Volatility Hedge Fund Index. The index suffers from survivorship bias and requires investors to conduct due diligence on mostly complex option-based strategies.
So instead he used VIX correlations, but:
The VIX is a difficult time series to work with given its extreme volatility and limited data history.
The new indicators are realized volatility and the U.S. option-adjusted high yield spread to Treasuries.
- Nicolas uses the same 59 asset indices with a one-year lookback and a one-week price lag.
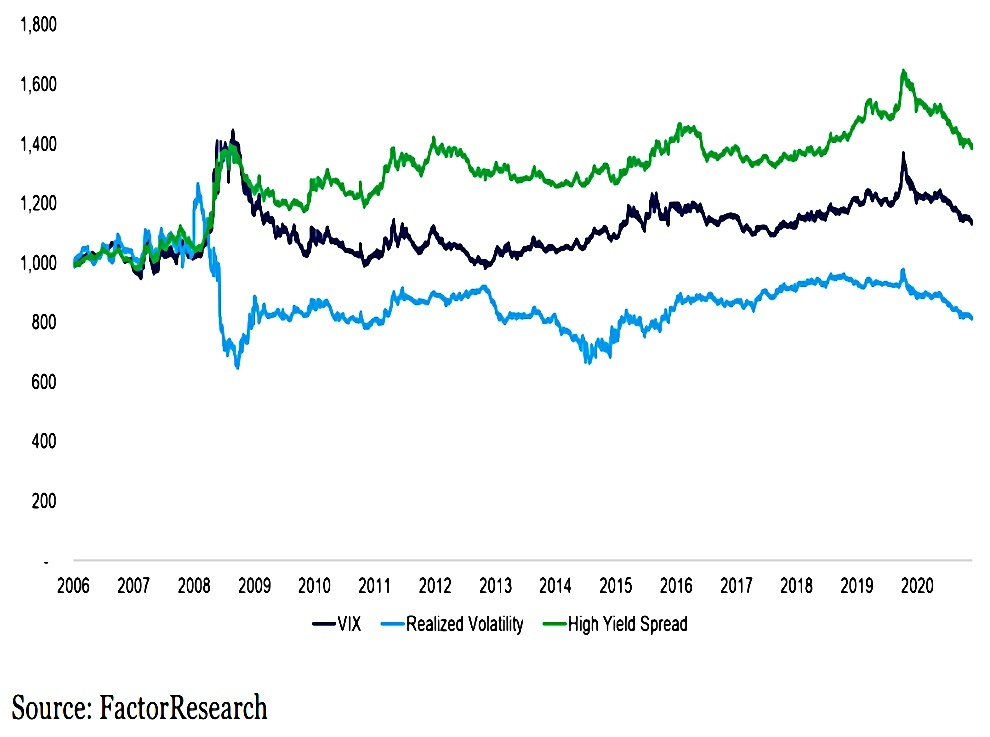
Although the returns of the three systematic long volatility strategies were different, the trends in performance were similar.
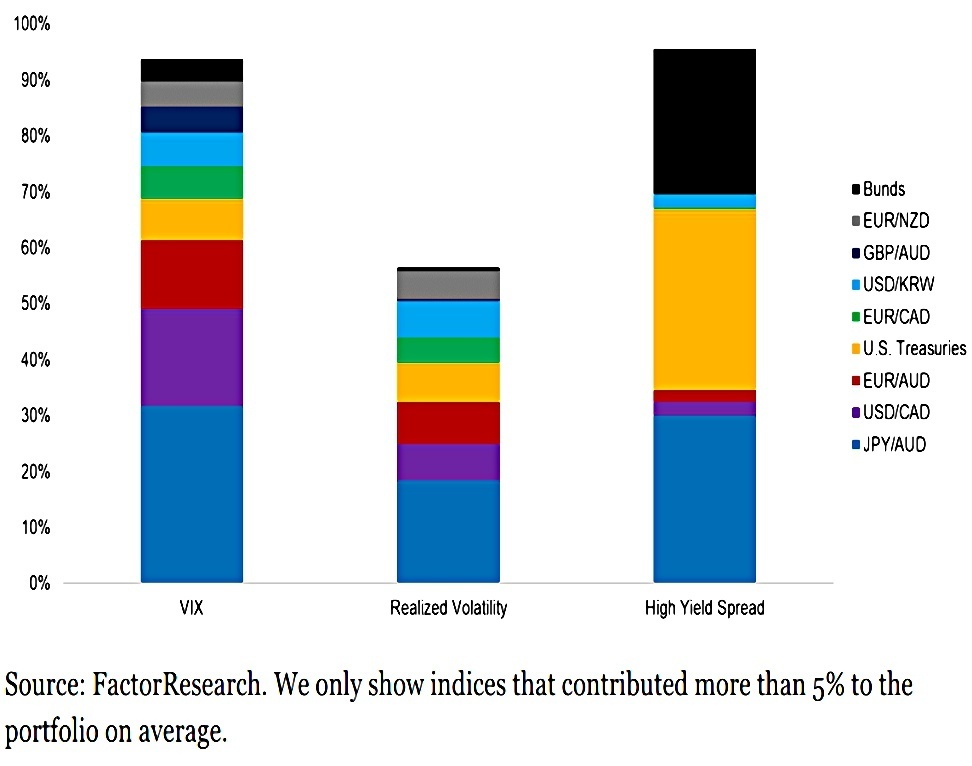
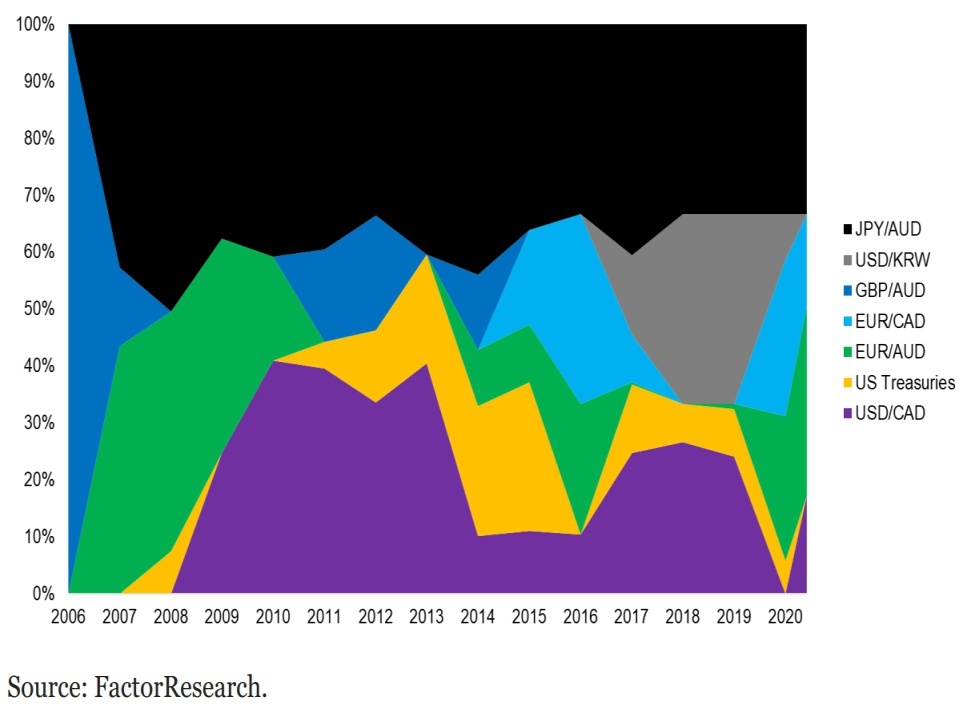
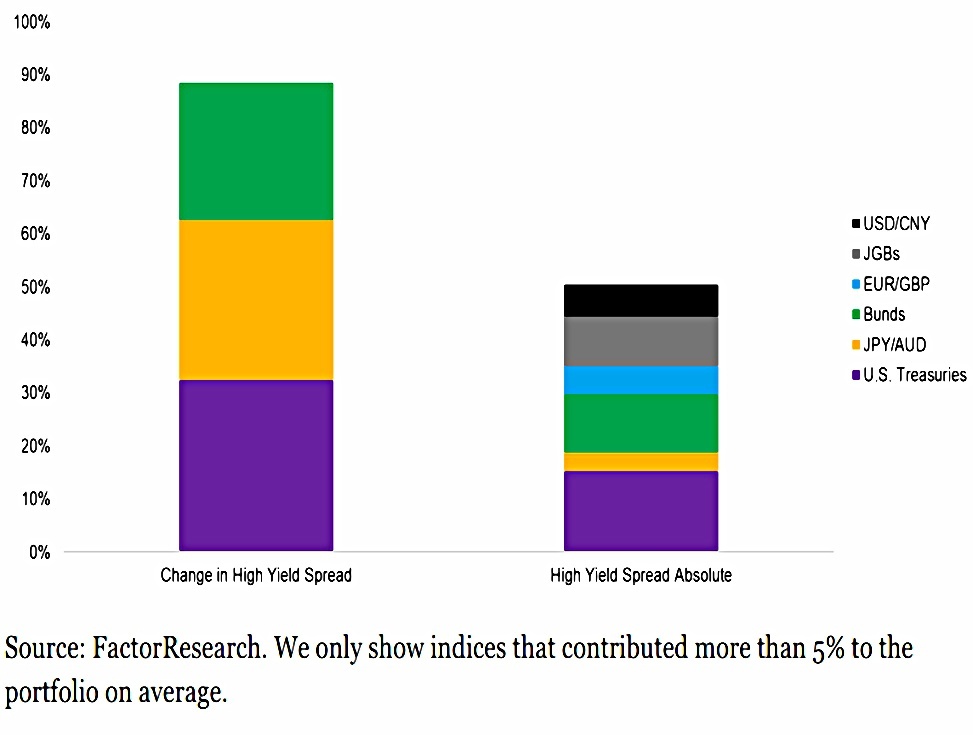
The portfolios differed in their composition of these safe-haven instruments, e.g. the portfolio based on the high yield spread had basically only three constituents: German bunds, U.S. treasuries, and JPY / AUD. The long volatility portfolio based on realized volatility was much more diverse.
Changes in values
Next, Nicolas introduces a change to his calculations.
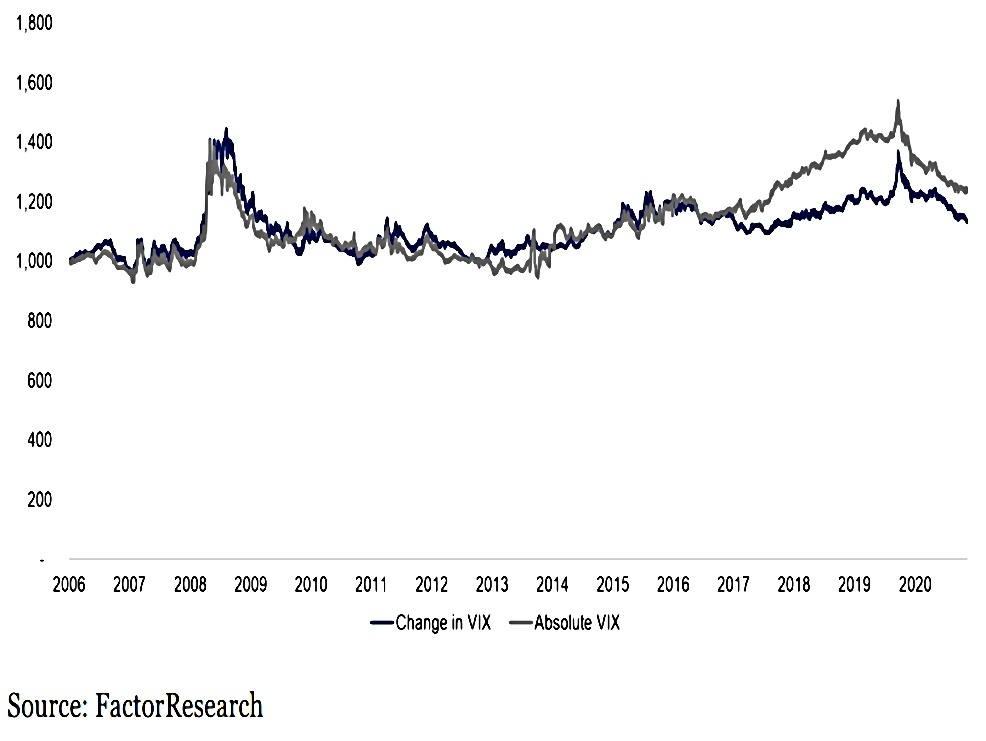
We should use the returns rather than absolute values. Having said this, with regards to the VIX, which is already expressed in percentage points, this would have made only a minor difference.
Where it does make a difference it to the performance of the high yield spread portfolio.
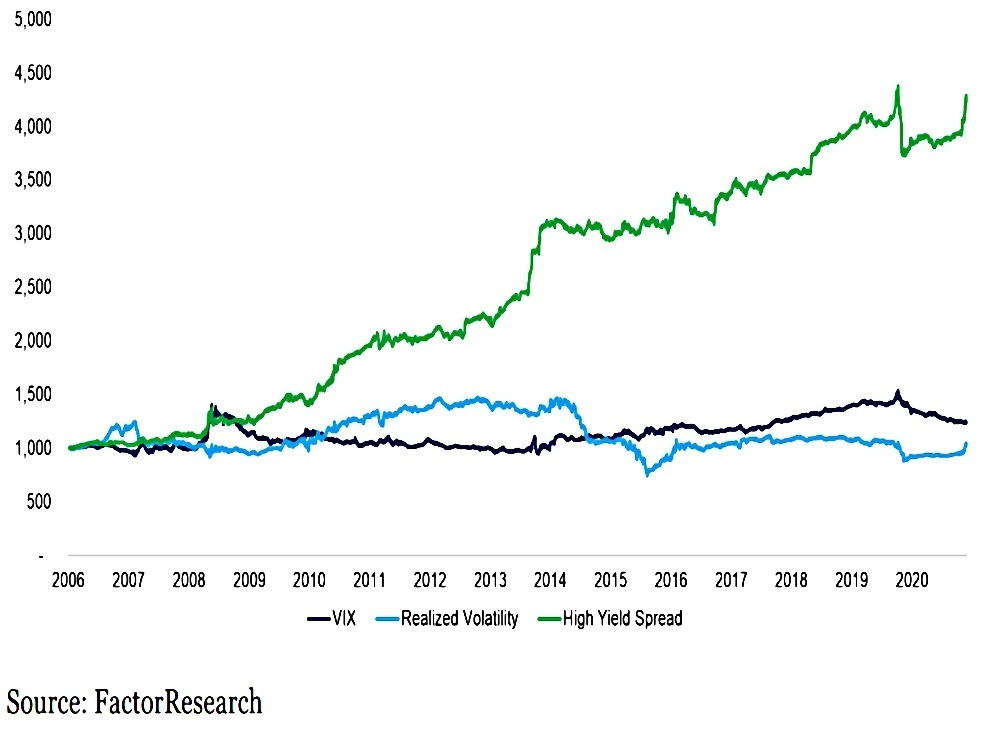
Have we stumbled across something truly interesting, or is there some hindsight bias that explains the attractive returns?
The absolute portfolio is more diversified but that doesn’t fully explain the improvement.
- Part of the improvement is from a higher bond allocation in the change portfolio, but Nicolas is still investigating.
Multi-metric benefits
Nicolas next looks at combining the risk metrics.

The return profile of the multi-metric long volatility portfolio does not change significantly compared to the single-metric portfolios, but it seems a more robust approach.
That’s it for today.
- Nicolas has demonstrated that relatively simple long vol strategies can be built without options, by using government bonds and FX pairs instead.
Nicolas’s approach involves an active approach to choosing instruments, but a passive version using say four types of government bonds and four types of currency pairs is likely to capture most of the effect.
- Nicolas’ portfolios lack the explosive response of hedge fund long vol strategies, but their improved Sharpes mean that they can be juiced with leverage.
I’ll be back in a few weeks with another post on Long Vol.
- I have another four notes to work through from Nicolas on related topics, and then I can move on to other sources in a third article.
Until next time.
Mike Rawson
Mike is the owner of 7 Circles, and a private investor living in London. He has been managing his own money for 40 years, with some success.