Risk Parity and The Covid Crash
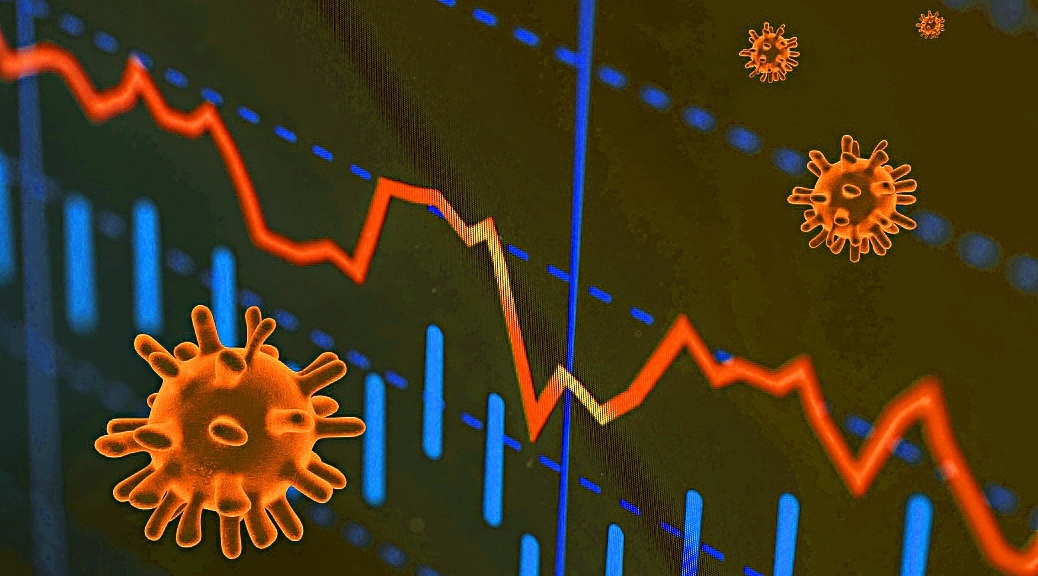
Today’s post looks at an article from Markov Process International on the performance of Risk Parity funds through the Covid Crash of 2020.
MPI
I only came across Markov Processes International (MPI) in June 2021, when I started listening to a podcast called Risk Parity Radio (RPR – more on them in a later post).
- One of the early episodes of the podcast (which now runs to more than 100 in total) suggested the paper that we are looking at today.
It also revealed to me that in the US there are a number of public Risk Parity (RP) funds.
- I initially hoped that as well as looking at their covid crash performance today, I would be able to revisit them in the follow-up post to our article on US ETFs.
But it looks as though they are mostly mutual funds rather than ETFs.
- The exception is RPAR, which we will come back to.
Today’s paper is from April 2020, in the heart of the crash, and is called Quant Funds in the Coronavirus Market Rout: Risk Parity.
Not so bad
The article starts by noting that RP is often blamed for increasing volatility during crashes, even those with real external (rather than financial) causes, as with Covid.
- RP is also thought by many to be outdated, and not suited to the recent (and current) low interest rate environment.
MPI define RP as:
A multi-asset strategy designed to perform relatively well in all investing climates by balancing risk across its components. Generally, portfolio volatility is targeted at 10-15% and the bond allocation, due to the historically lower realized volatility in fixed income, is typically leveraged.
They note that there is room for some discretion in implementation and therefore some variety of outcomes.
- And so some of the public RP funds have done okay. (( Most RP money – some $175 bn to $400 bn – is held within hedge funds, with Ray Dalio’s Bridgewater All Weather fund the largest at $60 bn ))
US Mutual funds don’t disclose intra-month positions and so MPI uses a technique that they call Dynamic Style Analysis (DSA) within their Stylus platform.
- They compare the funds to two passive 60/40 benchmarks (domestic and global) and two S&P Risk Parity Indices (10% and 12%).
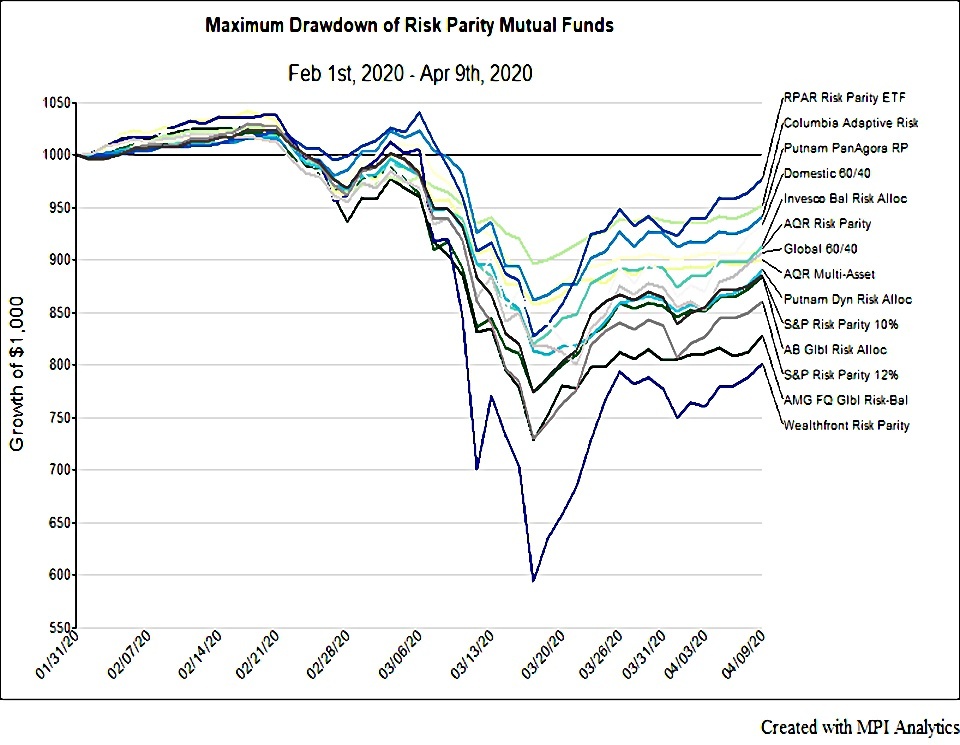
Drawdowns
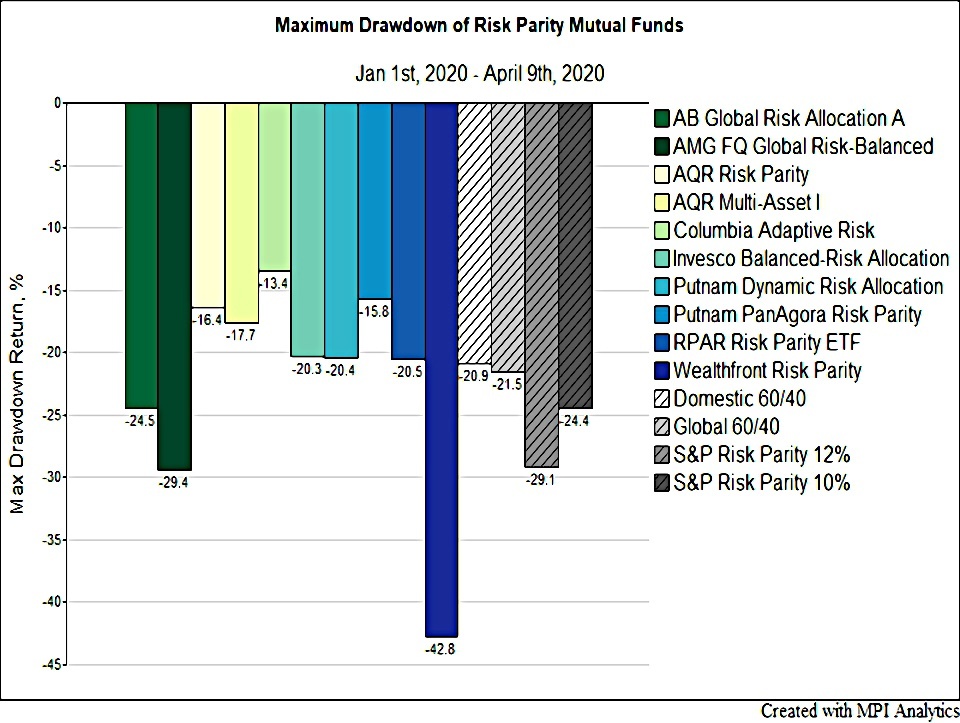
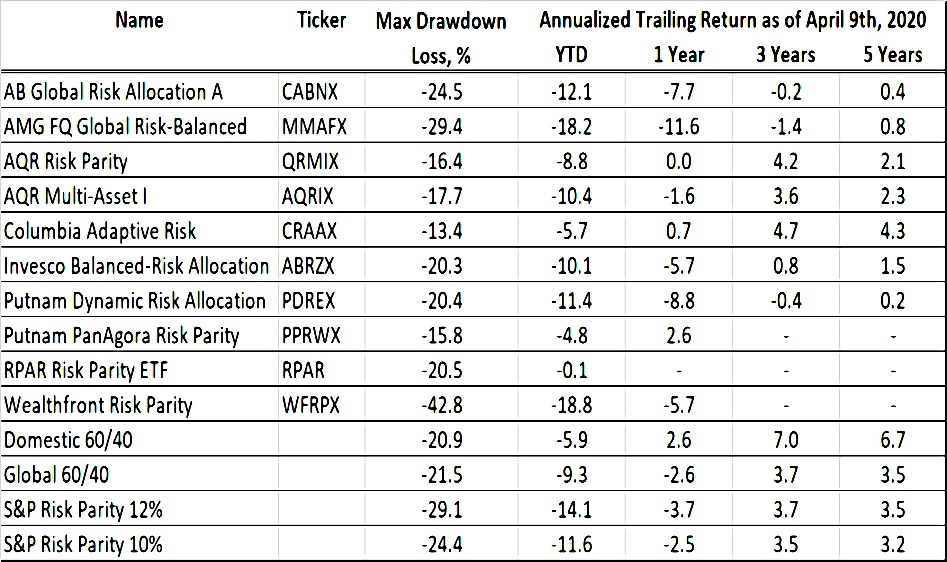
On max drawdowns:
- All four benchmark portfolios had a max drawdown between slightly better than -20% and slightly worse than -29%.
- The risk parity mutual funds lost between -13.4% (Columbia Adaptive Risk CRAAX) and -42.8% (Wealthfront Risk Parity WFRPX).
- On average, the mutual funds’ losses of -22.2% were similar to benchmarks for the balanced portfolios and better than the selected risk parity strategy indices.
- AQR Risk Parity and Multi-Asset as well as Putnam PanAgora also had notably smaller drawdowns than any of the benchmarks.
Leverage
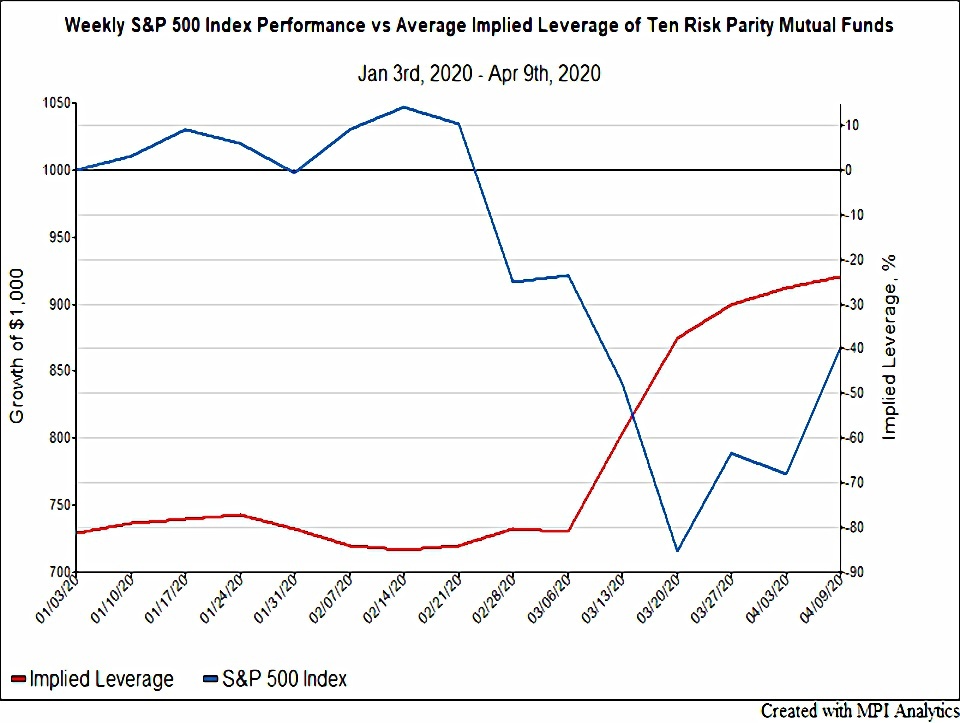
Implied leverage of the funds fell, on average, from about 80% to under 30% between the start of January and the week ending April 9th.
This forced selling (because of increased volatility) could have made the crash worse:
If the upper end of the estimated asset base ($400B) was similarly levered, and if hedge funds and other risk allocation strategies behaved like the mutual funds, this does represent a significant deleveraging during a period of intense market stress that extended to the most liquid and traditionally safe assets.
In practice, interventions by the Fed and/or rebalancing in the opposite direction meant that the crash didn’t spiral out of control, and in fact ended very quickly.
Outliers
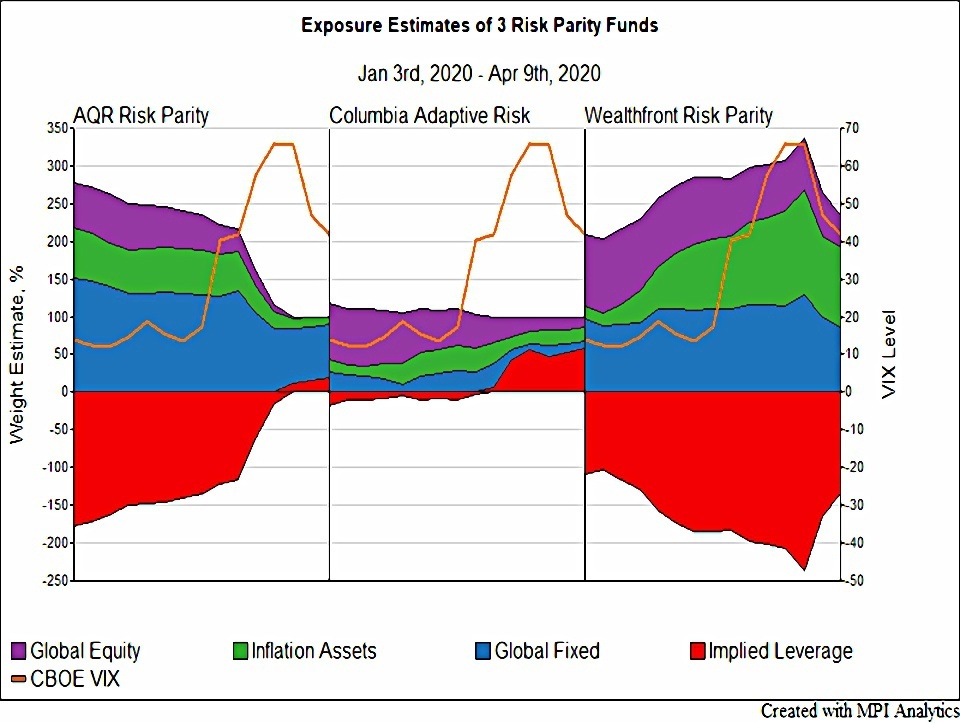
Columbia Adaptive Risk’s performance implies that it began to de-lever quite early on, although its leverage appeared moderate to begin with. Wealthfront Risk Parity appears not to have de-leveraged at all, while the AQR Risk Parity fund appears to have behaved closer to the mutual fund averages and risk parity indices.
The chart overlays the VIX to make the differences between these strategies clearer.
- MPI also not risk reduction in terms of lower equity allocations.
Conclusions
Correctly measuring, estimating and actively managing risk is key for risk parity to keep the volatility of each asset constant and to maintain an overall portfolio risk target.
In a crash or flight to quality, lots of asset classes fall together.
A lot depends on recognizing or better yet, anticipating, a shift in risky assets and continued liquidity, allowing funds to de-lever at an optimal time. Some risk parity funds may be quite good at forward expectations.
RP did OK during the Covid Crash.
- That was my own experience, also.
- My max drawdown was 12%, compared to 33% for the FTSE All-Share and 21% for a Global 60/40.
That’s it for today.
- Until next time.
Mike Rawson
Mike is the owner of 7 Circles, and a private investor living in London. He has been managing his own money for 40 years, with some success.