Return Stacking

Today’s post looks at a recent joint paper from ReSolve Asset Management and Newfound Research called Return Stacking.
The problem
Many investors find themselves recommending portfolios that are uncomfortably far out along the risk curve, stretching for higher yields and increasing pro-cyclical asset exposure.
- Current valuations of equities and bonds are high, implying low future returns (and possibly some market crashes along the way).
- Trying to compensate for low returns can lead to increased risk.
- Adding non-correlated assets and alternative strategies can reduce risk, but might also reduce returns.
Return stacking is design to provide higher returns with lower risk by increasing net exposure.
Stretching for returns
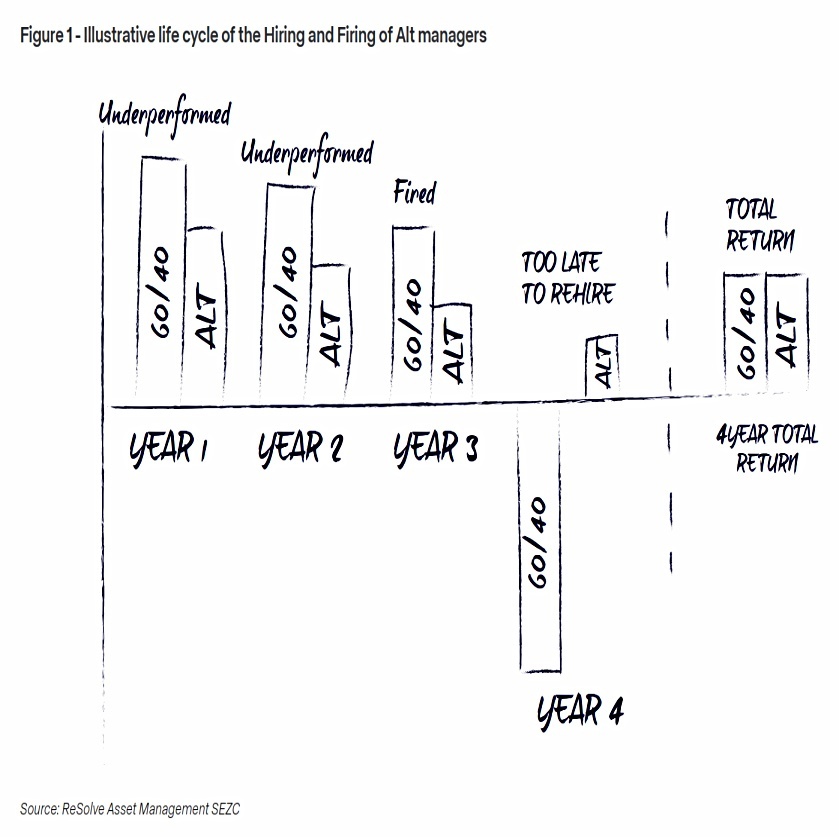
Many investors abandon diversifiers before they experience the expected pay-off. This behavior is especially common in periods when traditional portfolios have dominated for several years in a row.
The paper begins by imagining a portfolio formed by adding 30% of alternatives to a traditional 60/40 portfolio.
- Both portfolios are assumed to have Sharpe ratios of 0.5
- The correlation between the two components is zero
- The volatility of the 60/40 is double that of the alternatives (due to the stock component)
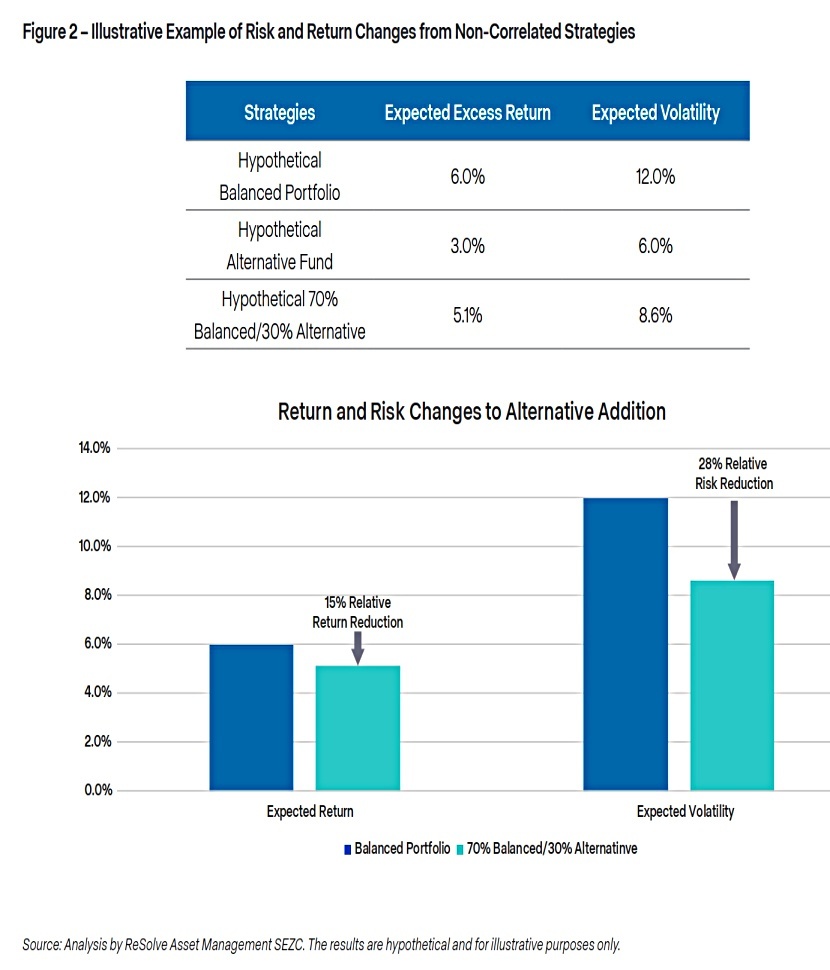
The alternatives reduce risk by 28% at a cost of a 15% reduction in returns (0.9% pa real).
Scaling
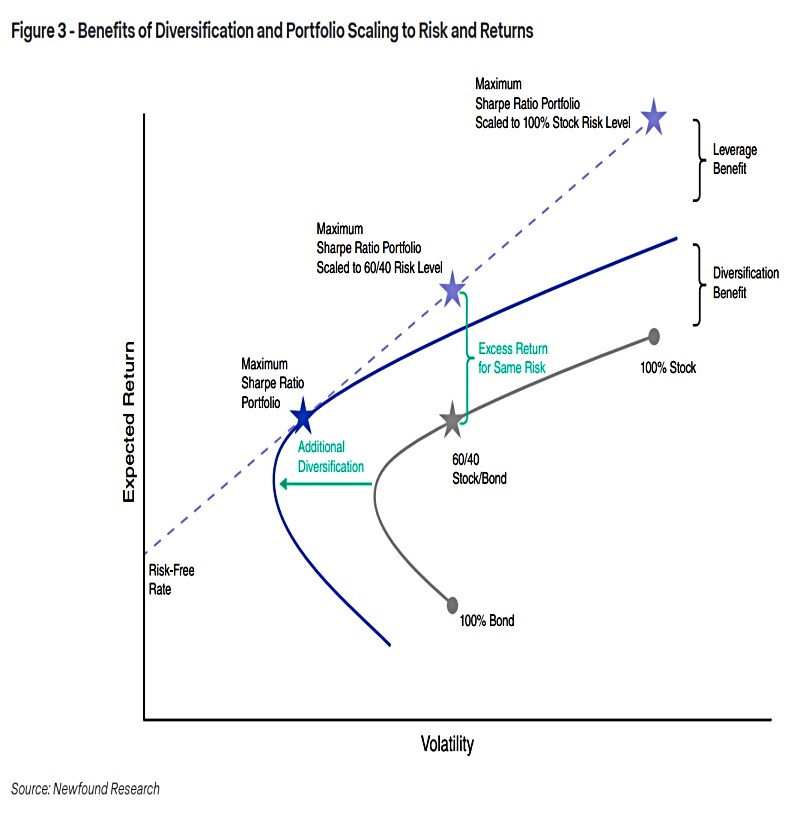
The way around return reduction is scaling (leverage).
- A 150% allocation (50% geared) to the 60/40 portfolio will outperform a 100% equity allocation in both absolute and risk-adjusted terms.
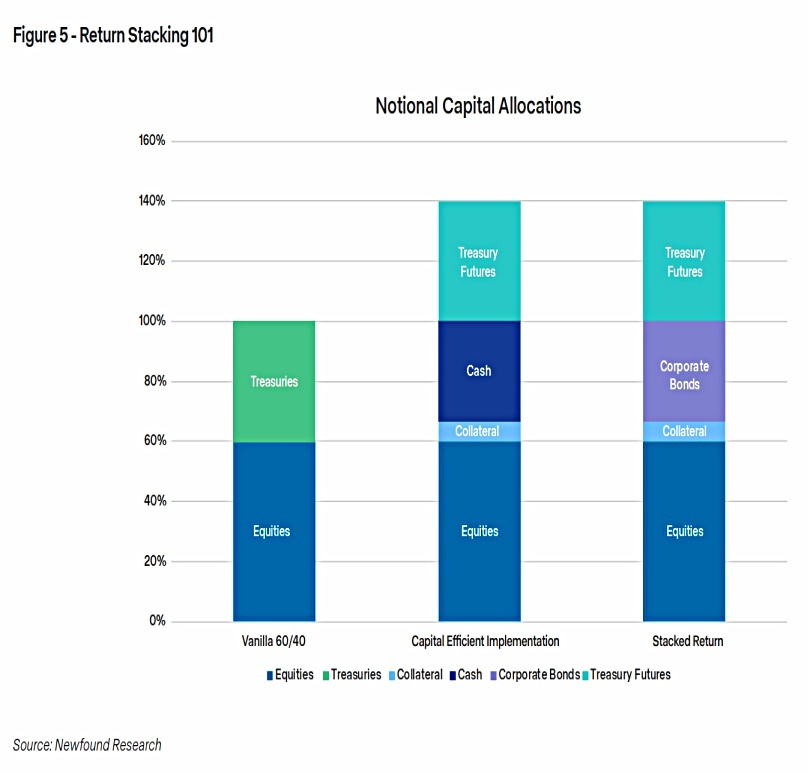
So the return stacking approach is to use derivatives to provide core beta exposures (known as capital efficiency) and then allocate the residual capital to excess return sources (higher-yielding and/or longer-dated investments.
NTSX
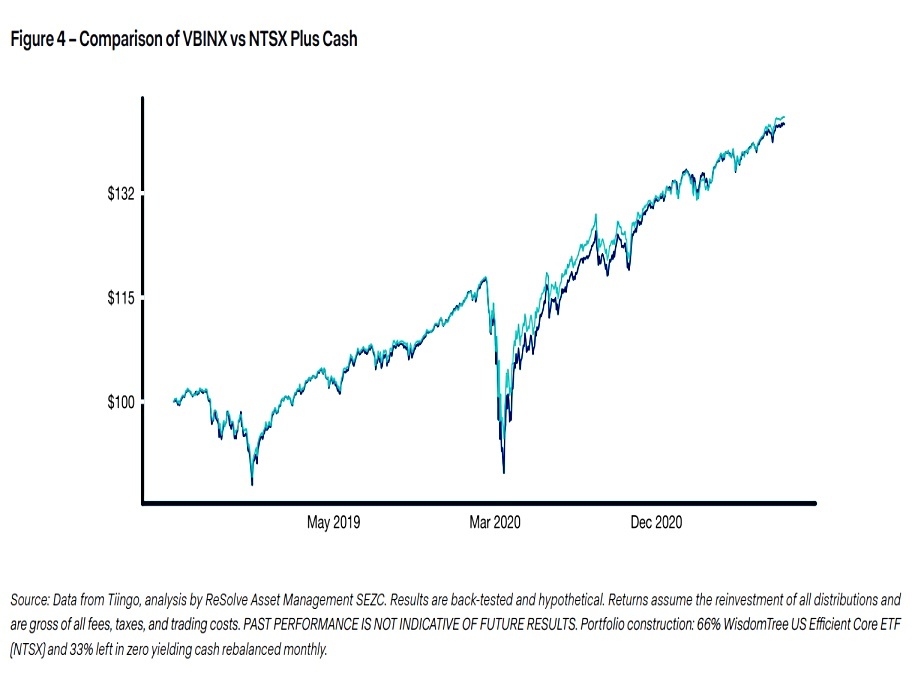
A practical example uses the WisdomTree US Efficient Core ETF (NTSX) which is a 1.5x levered 60/40 portfolio (what you might think of as a 90/60 portfolio).
- Using 2/3 of your money to buy this gives you a 60/40 portfolio and frees up the remaining third to be used in diversifying (and return stacking) investments.
The most conservative investors might just buy more bonds (leading to effectively a 60/90 portfolio, though the extra bonds would probably be more short term).
- Note that at present, very low (and often negative) returns on bonds make this approach unattractive.
Over 20 years to June 21, this bond stacking returned 7.7% pa with 8.9% volatility, compared with 6.9% pa for the 60/40 (with 8.6% volatility).
Practical examples
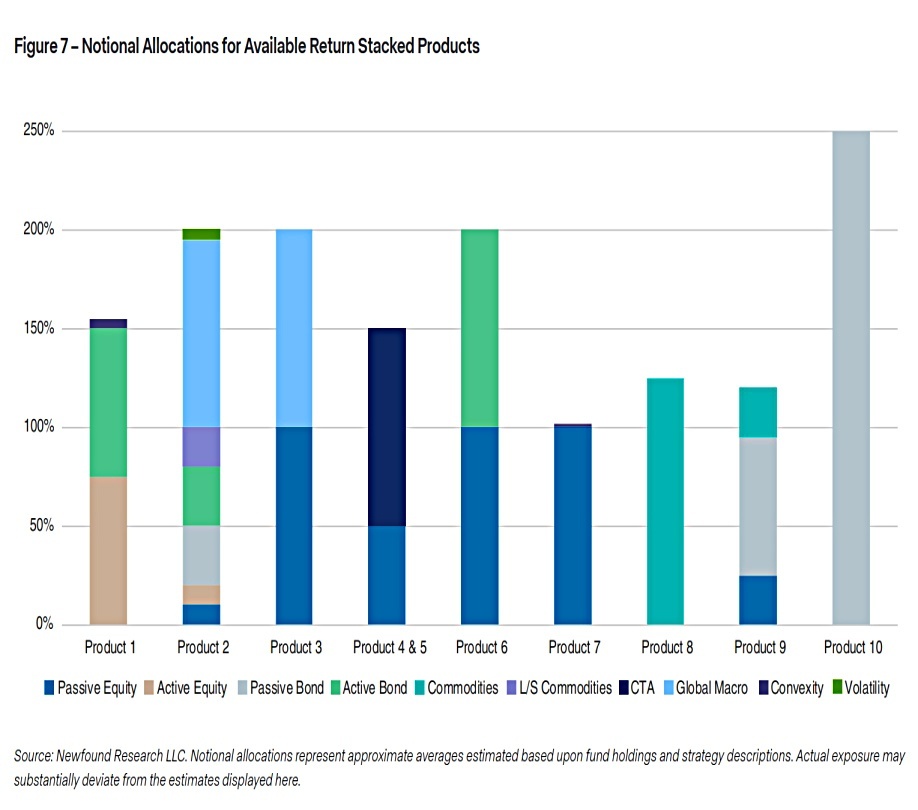
The paper provides many different flavours of return stacking portfolios.
A key element in our product selection was to source funds whose alternative overlays have an expected, structurally-driven low correlation to the 60/40 portfolio.
There was a common target, though:
A “look-through” exposure approximating 60 percent equity, 40 percent bonds, 30 percent CTA Managed Futures, and 30 percent Global Macro.
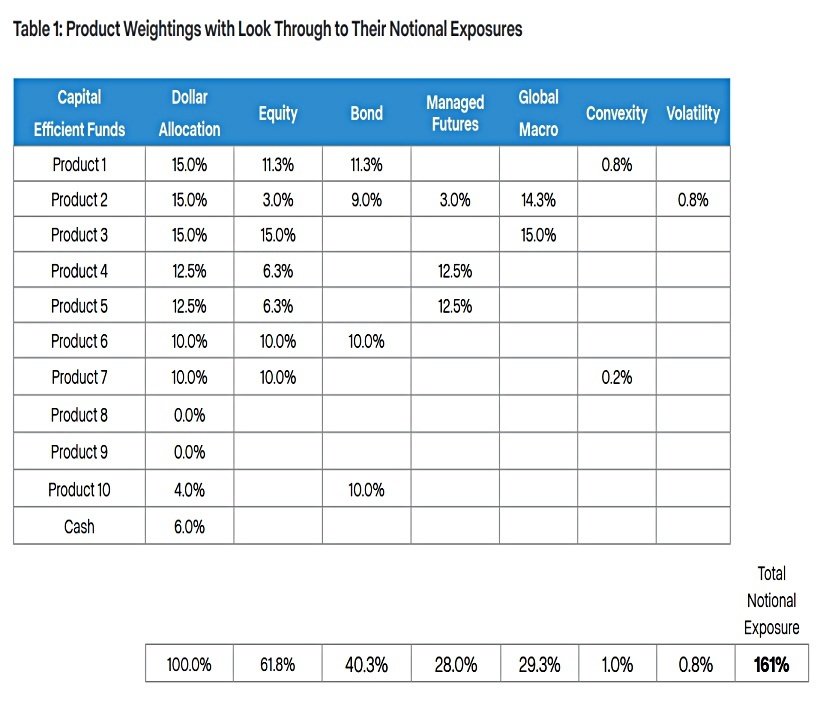
This now sums to 161%, so we have 60% gearing (since none of the items is necessarily/structurally short of one of the others).
These two alternative categories were selected due to their embedded global diversification across traditional and nontraditional asset classes as well as their ability to go long and short. CTA Managed Futures and Systematic Global
Macro are readily available in capital efficient fund structures.
If tracking error (relative to 60/40) is not an issue, other candidates could be commodities, REITs and even crypto, along with long/short equity, event-driven strategies, and private credit.
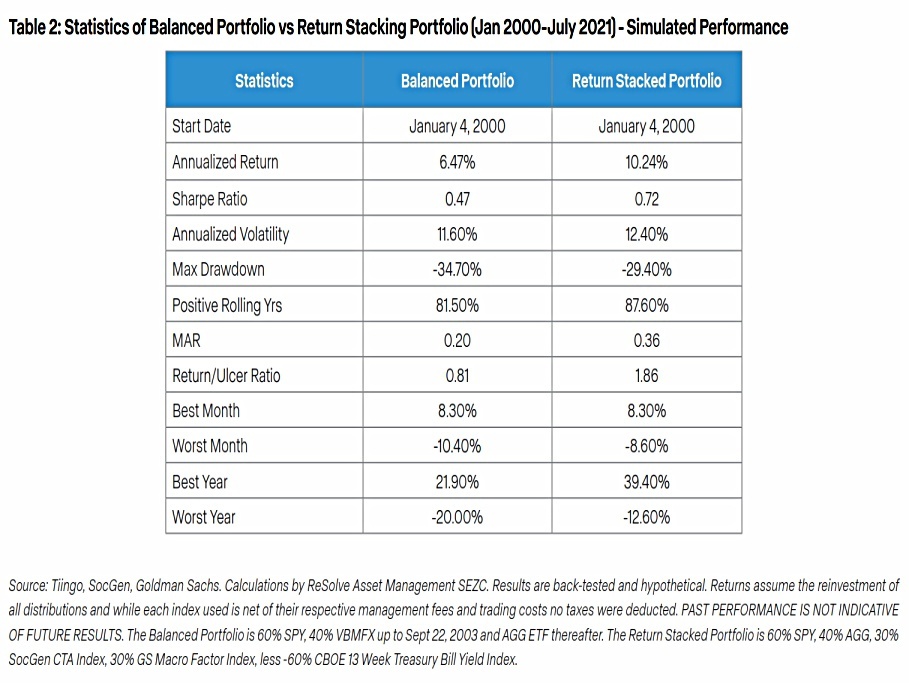
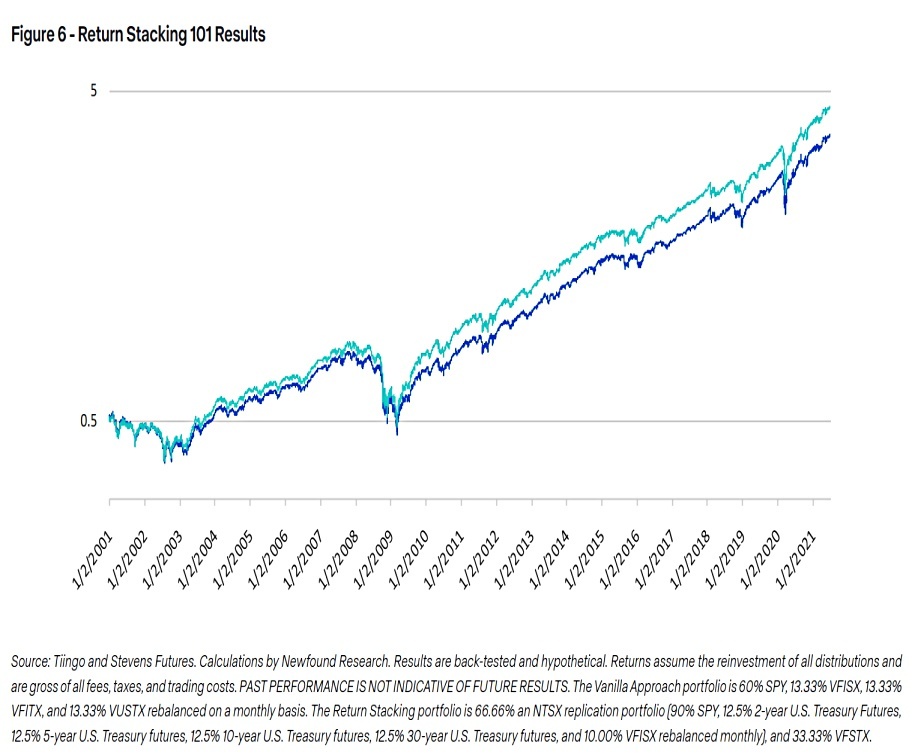
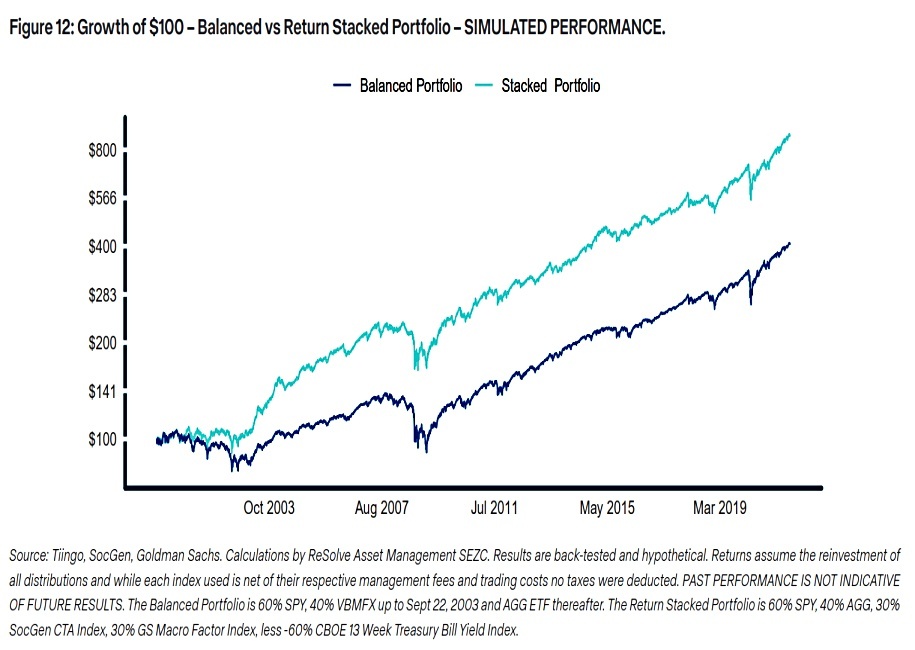
The Return Stacked (RS) portfolio returned close to 4% more than the 60/40 – 10.2% vs 6.5% pa.
- Volatility increased from 11.6% to 12.4%
- The Sharpe Ratio improved from 0.5 to 0.7
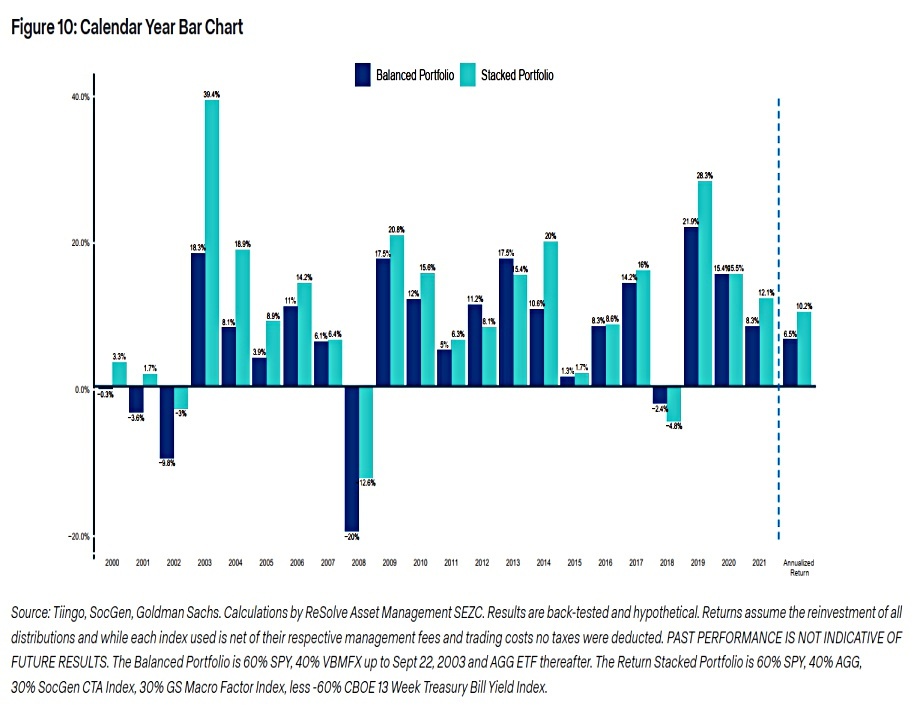
The RS portfolio outperformed in 18 out of 21 years.
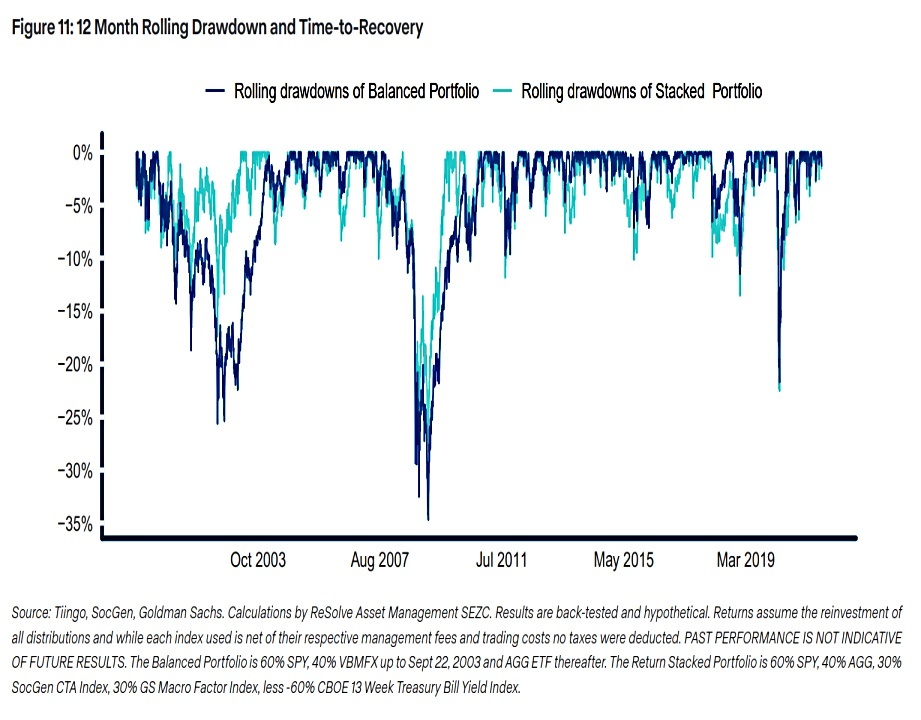
Despite all that leverage, the RS portfolio had similar drawdowns to the 60/40.
And despite annual running costs of more than 1.2% higher than the Vanguard 60/40 fund (VBIAX), the RS portfolio outperforms handsomely.
Conclusions
I’ve been giving some thought to how to incorporate modest leverage into my strategies, and so this paper is both timely and stimulating.
- The authors note that during extreme crashes, diversification would collapse.
This means that a strategy like this should be used only for a portion of your overall portfolio.
- Probably the easiest way to set a limit would be to measure overall leverage, from all sources.
Tail hedging (eg. long vol) should also be considered.
- Until next time.
Mike Rawson
Mike is the owner of 7 Circles, and a private investor living in London. He has been managing his own money for 40 years, with some success.