Project X-Ray – What’s in the Box?

Today we’re going to start Project X-Ray – a look at my legacy investment accounts to see if any holdings fit within the 7 Circles portfolios.
The legacy accounts
Regular readers will know that I have a lot of investment accounts:
- four pensions, and
- four ISAs (though I’m in the process of merging two of these)
And then there are my partner’s accounts:
- five pensions
- four ISAs
That’s far too many accounts, but bear in mind that these have been accumulated by two people over thirty years – that’s only one account every three and a half years.
- It’s a medium-term goal to reduce these seventeen accounts down to perhaps eight (2 x ISAs and 2 x SIPPs per person), but that will take time and planning.
In the short-term, it would be nice to know exactly what was in them all.
Prior to starting this blog, my investment style – apart from the odd flirtation with active trading, as in the dot-com boom and bust – could best be described as not just buy and hold, but buy and forget.
- I’ve been very conscientious about using up my pension and ISA allowances each year,
- but once the year’s money has been spent (sorry, invested) I usually ignore it apart from an annual check on the value.
Now this, in theory, is a fine approach to investing.
- Studies have found that the best-performing retail brokerage accounts are those belonging to dead people, whose style is very similar to mine.
But what about in practice?
The 7 Circles portfolios
Since starting the blog, we’ve assembled some example portfolios, either on paper or with real money:
- SmallCap (AIM stocks, real money)
- Dividend (main market stocks with yield > 3.5% – not invested yet but will be real money)
- PiggyBack (other Main market stocks, paper so far)
- Bonkers (Momentum stocks and funds, real money)
- IT (Investment trusts, idealised version of my real holdings)
- ETF (idealised version of my real holdings)
You can find links to all of the posts about each of these portfolios in the sidebar on the left of this page.
- I’ve now pretty much run out of cash to fund these portfolios, so in order to manage and grow them, I need to use my legacy accounts.
The plan
The first stage is to analyse what’s inside each of the legacy accounts and see if any holdings can be allocated into the six portfolios. I’m sure that lots can.
- Then I plan to look at the historical performance of the holdings in each section.
- Next I’ll come up with a strategy for replacing some of the old holdings with stocks and funds that have better prospects.
- I also want to reduce the number of holdings (hundreds at the moment) to make my accounts more manageable and increase my average deal size to something more economical to trade.
And finally, I’ll work on achieving a better mapping of portfolios to accounts, rather than having each portfolio spread between a number of locations.
The tools
That’s the what, now here’s the how.
- Using Google sheets, I can import the holdings from each account into a separate page, and get live prices to value them.
- I can then allocate each holding into a portfolio (or into none).
- Then I can use the Filter() function to copy each portfolio’s holdings onto a portfolio page.
The formula looks like this:
Filter(account_page, index_field="Portfolio_name")
Project X-Ray
The thought of doing this for hundreds of holdings in 17 accounts fills me with dread, which is probably why I’ve put off doing it for so long.
To boost my spirits I’ve decided to give it a sexy name – Project X-Ray.
- It sounds a lot better than “Project long-overdue tidy-up”.
My other technique to get through this will be to break the task down into smaller bite-sized chunks.
So today I’ll just mark up a single account, and then when I’ve worked through a few more, I’ll come back with an update on how things are looking.
I’ve chosen one of my three SIPPs to begin with. It should be a good example, as its one of the bigger accounts in terms of its number of holdings, and it contains a wide variety of stuff.
- I hope (for the purposes of this post, not for my general investment planning) there will be something in every one of the five portfolios.
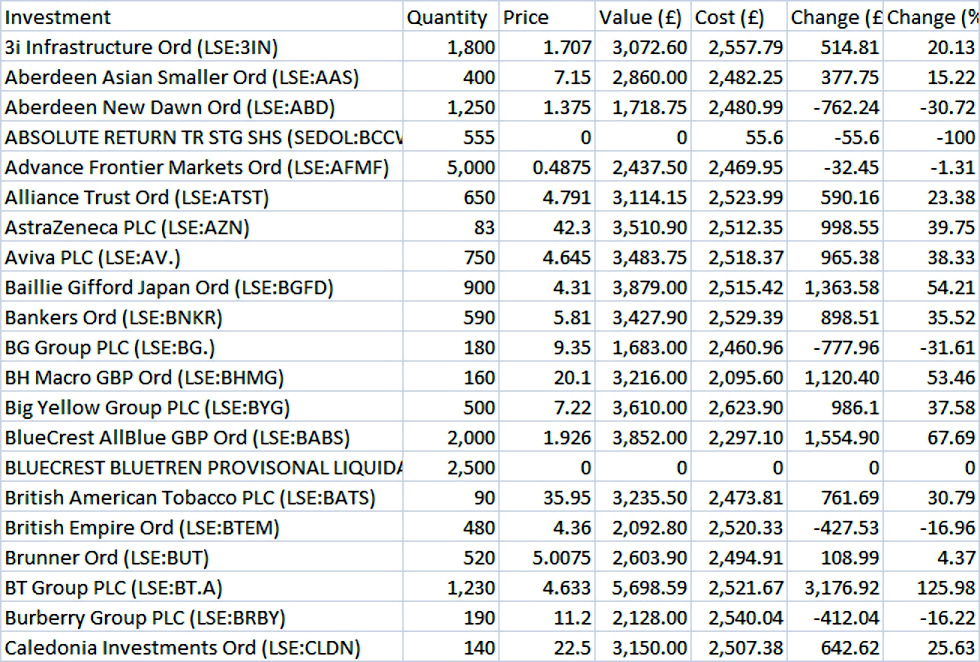
Here’s how the first few lines in the export of all the holdings looks:
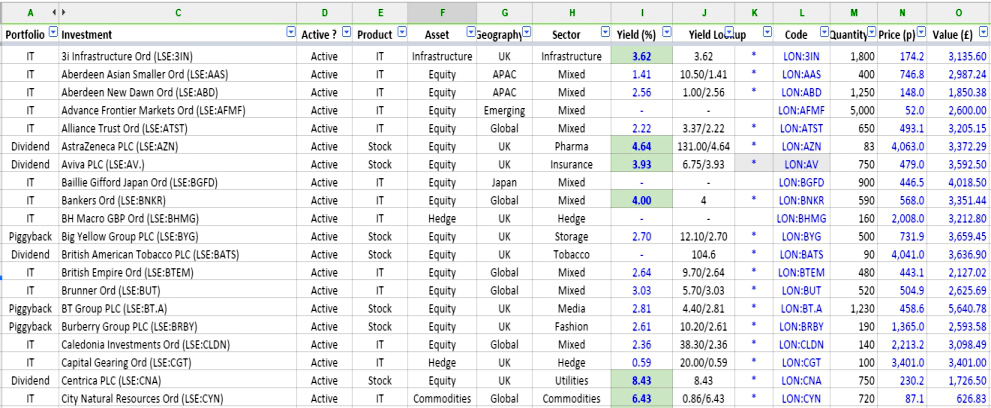
And here’s the same thing imported into Google sheets and coded up.

I’ve added five codes to let me analyse my overall portfolio. From left to right:
- Active or Passive?
- Product (Stock, IT, ETF etc)
- Asset Class (Equity, Hedge Fund, Commodities, Infrastructure etc.)
- Geography
- Sector
The next column shows the yield, taken directly from Google.
The column beyond Yield (Yield Lookup) uses a rather complicated formula to import XML data from the relevant page in Google Finance:
Yield Lookup = ImportXML( concatenate( "http://finance.google.com/finance?q=",L2), "//td[@data-snapfield='latest_dividend-dividend_yield']/following-sibling::*")
This sometimes returns a single yield percentage (eg. 8.43%) and sometimes returns a dividend payment plus a yield (eg. 5.70/3.03).
So I have to reformat this data in the Yield column:
Yield = If (Len (Yield Lookup)=5, "-", value( right(Yield Loookup,4) ) )
I’ve colour coded the Yield Column to go green for holdings with a yield above 3.5%.
The next column shows the Google Finance code for each holding.
- In the case of this SIPP, the output data has the code in brackets after the stock name, rather than in a separate field.
This means that I have to do some reformatting to extract the code and substitute LON for LSE:
G_Code = CONCAT( "LON:", mid(name, find("LSE:",name)+4, (Len(name)-find("LSE:",name)-4 ) ) )
The Quantity Column is taken from the SIPP output data, but the current price is looked up live in Google.
Value = Price * Quantity
The next picture shows the same holdings with a Portfolio code added as Column A:
Most of these holdings are investment trusts, but there are a few for the Dividend and PiggyBack portfolios.
Now let’s look at the portfolios in turn. As we saw earlier, we can filter the account page to produce a list of the matching holdings in the Portfolio page:
Filter(account_page, index_field="Portfolio_name")
Here’s the full list of the 14 PiggyBack stocks from this SIPP – quite a mixed bag:
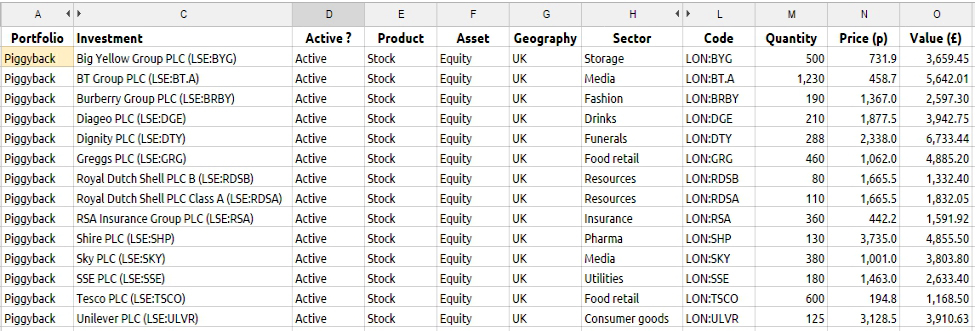
The cell shaded yellow at the top left is the one that holds the filter formula which generates the rest of the data.
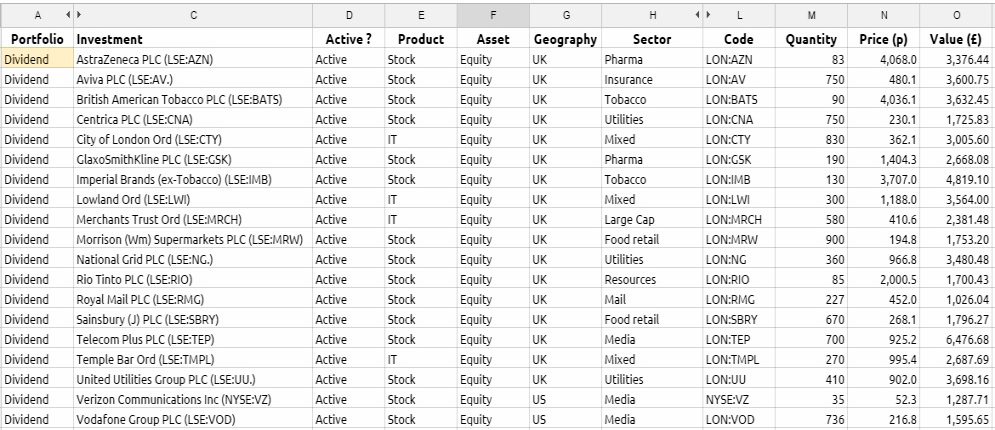
Here are the 19 stocks in the Dividend portfolio – note that I’ve included four high-yielding investment trusts.
This SIPP is dominated by investment trusts – there are 45 of them, not counting the four in the Dividend portfolio:

There are also seven ETFs:
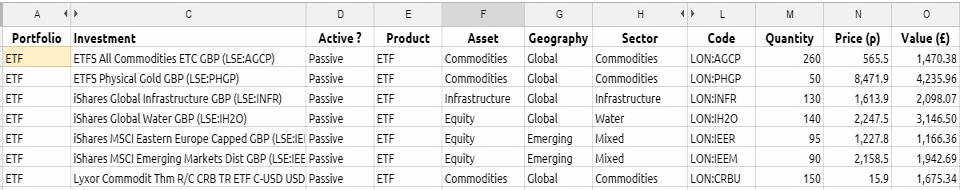
And finally there is one holding from the Momentum (Bonkers) portfolio:
![]()
Phew! We made it through the first of the seventeen accounts.
- Just the 86 holdings in this one.
- Hopefully, the other sixteen aren’t quite as bad.
I’ll be back with an update when I’ve done a few more accounts.
Until next time.
Mike Rawson
Mike is the owner of 7 Circles, and a private investor living in London. He has been managing his own money for 40 years, with some success.