Quantica on Trend

Today’s post looks at a recent study from Quantica Capital on the benefits of trend-following.
Contents
Quantica
Quantica Capital is a systematic trend-following firm based in Switzerland.
- The analysis we’re looking at today is called “All you need is Trend” and was published in the August 2022 edition of their Quarterly Insights publication.
The paper came out on the back of a good period for trend:
Trend-following strategies returned double-digit returns in the first half of 2022, offering valuable diversification to any balanced equity/bond portfolio during a truly challenging period for most investors.
Summary
The analysis looks at the portfolio diversification benefits of trend and finds that they are largely insensitive to:
- the existing risk allocation of the investor’s portfolio
- the timing of the investment in trend-following
- the investor’s expectations about future trend-following performance
The addition of a benchmark trend-following strategy to any well-balanced and diversified liquid portfolio is likely to improve its risk-adjusted returns over a reasonable timeframe.
Which sounds pretty good to me. As well as 20-year returns, the paper also looks at rolling five-year impacts and finds:
The portfolio diversification benefits of trend-following have been (1) persistent over time, and (2) strongest when it’s most needed, i.e., during periods of adverse market conditions for the underlying portfolio.
The authors next simulate a degradation in trend returns and find that the lack of correlation to stocks and bonds means that the addition of trend still provides diversification benefits.
They conclude:
A sizeable allocation to trend-following is sensible for most investors and market scenarios.
Equity risk
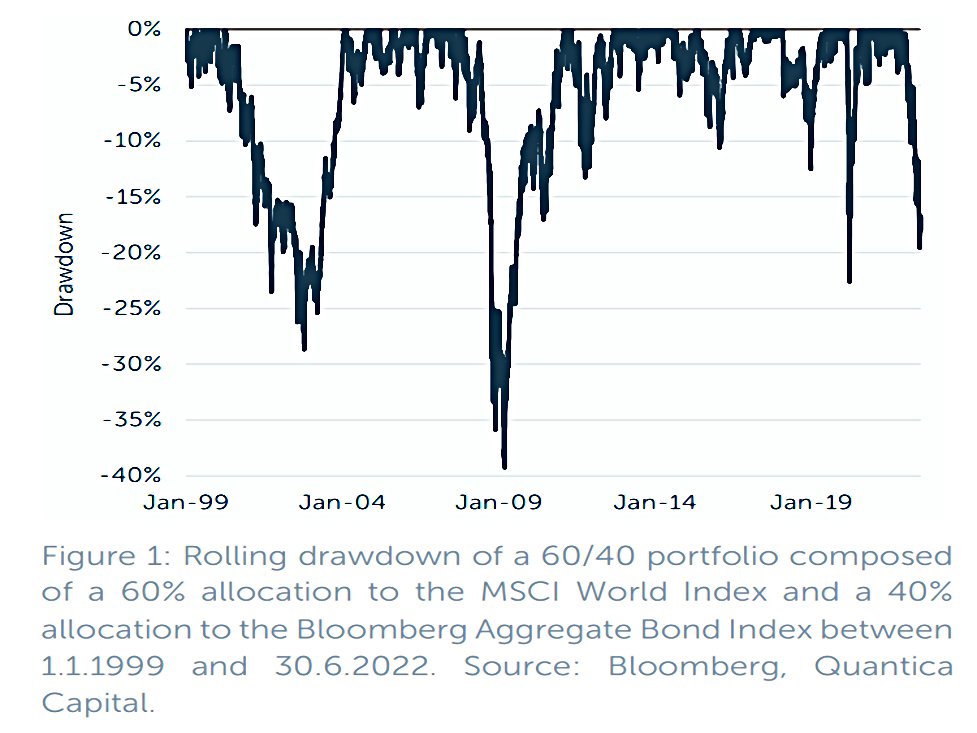
Equity risk is the dominant risk in most portfolios and the typical hedge in recent years relies on the negative correlation between stocks and government bonds.
- The recent rise in inflation and interest rates has reversed this correlation and led to a near 20% drawdown in the typical 60/40 portfolio during 1H22.
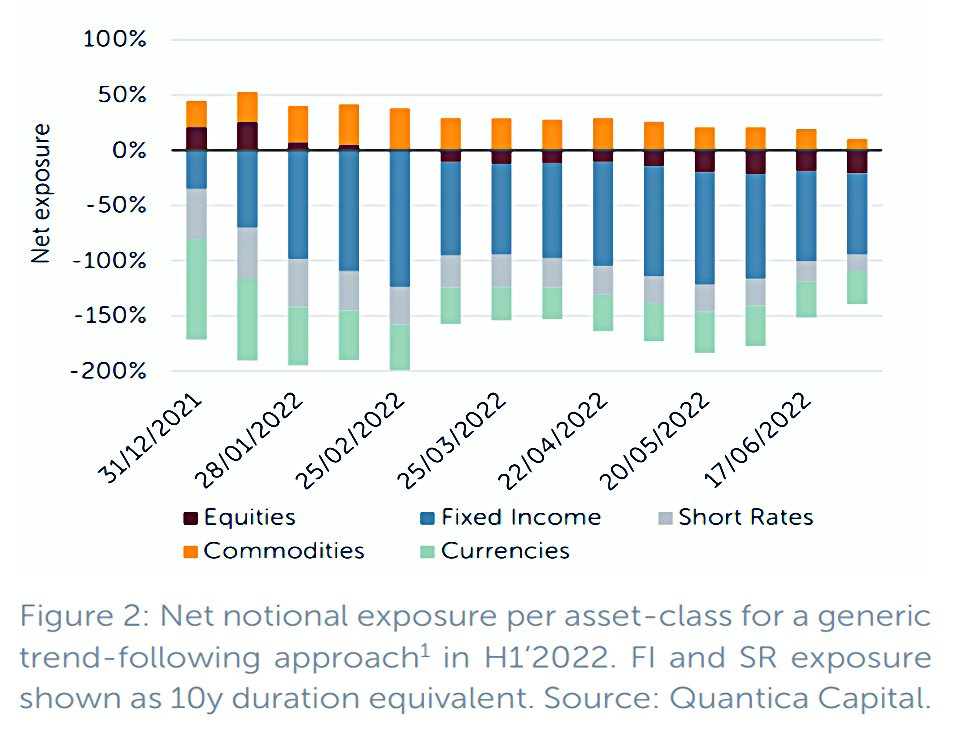
Trend has had a good 1H22 (+28%):
By taking a long risk exposure to commodities, a short risk exposure to government bonds and rates, and a short risk exposure to equities.
Liquid portfolios
Step one of the analysis looks at adding trend to a range of liquid portfolios.
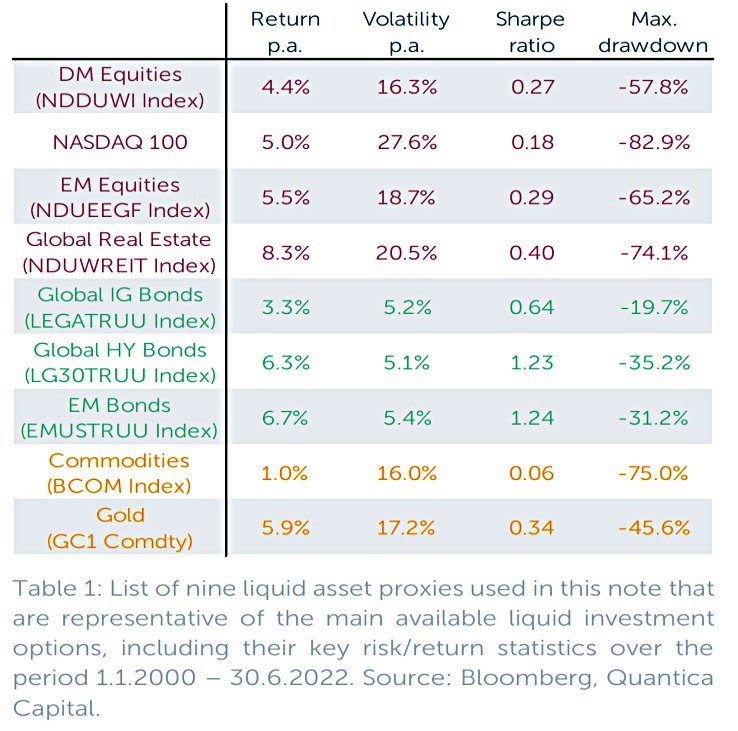
- Nine asset-class proxies (3 stocks, 3 bonds, 2 commodities and 1 listed real estate) are used as the basis of the portfolios.
We chose to create 10,000 different portfolios by randomly combining the nine basis instruments introduced above. Specifically, each portfolio is constructed by allocating a random positive weight between 0% and 100% to each of its nine constituents, such that the sum of the weights equals 100%.
So no shorting.
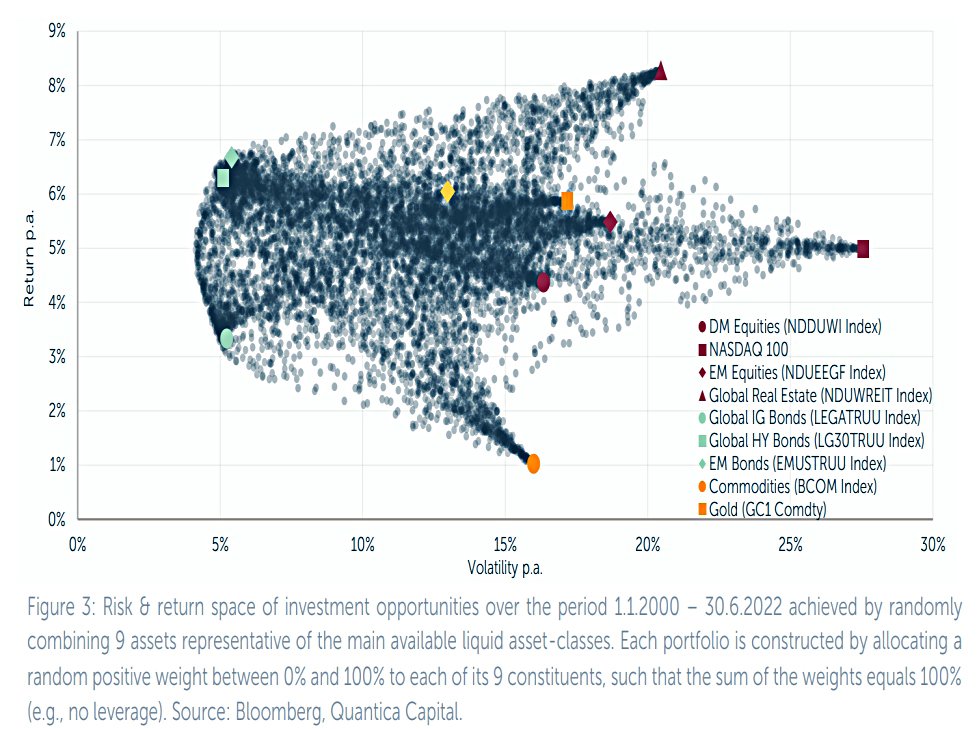
Each dot shows the annualised return and volatility of one of these portfolios from 2002 to 2022.
- The portfolios made up of a single instrument are marked with coloured dots and mostly define the corners of the risk/return space.
Returns vary between 1.1% and 8.6% pa, whilst volatility ranges between 5% and 28% pa.
- Real estate has the highest returns and tech stocks have the highest volatility.
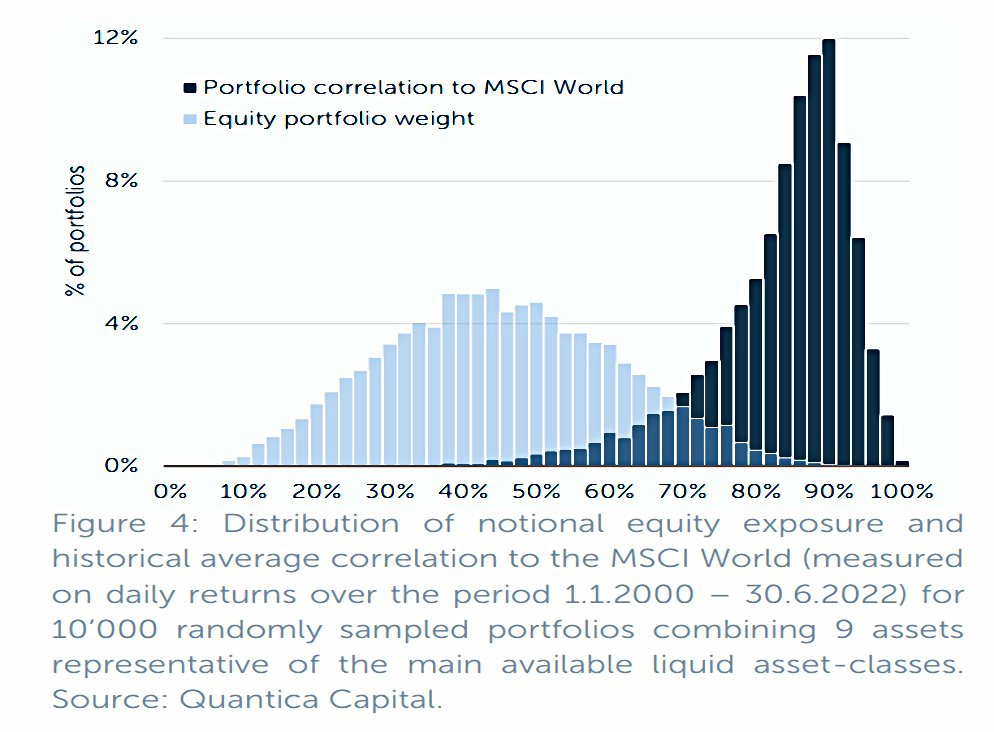
As is usual with “diversified” portfolios, equity risk remains dominant.
- Average equity exposure (including the listed real estate) is 44%.
But the average correlation to the MSCI world index is 82%, and the minimum average (over the 2000 to 2022 period) is 29%.
Trend benefits
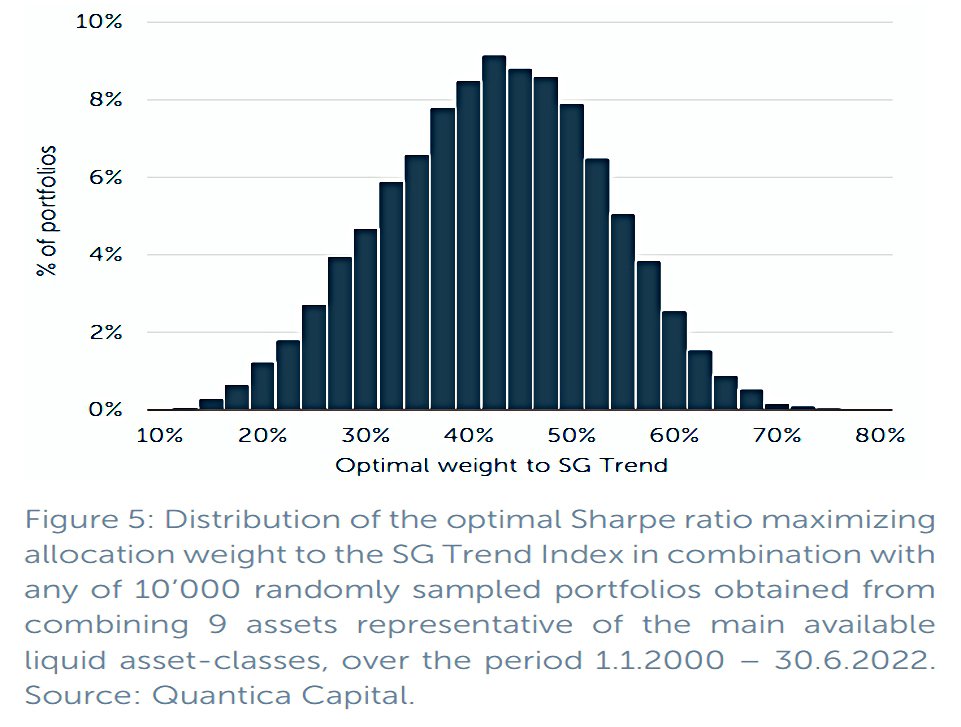
The next step is to add an allocation to trend, to the point where the Sharpe ratio of the portfolio stops increasing.
If, and only if, the addition of trend following does not increase the Sharpe ratio of the portfolio, the resulting allocation weight to the SG Trend index will be zero.
In practice, the trend allocation is never less than 10% and the average across all portfolios over 22 years is 40%.
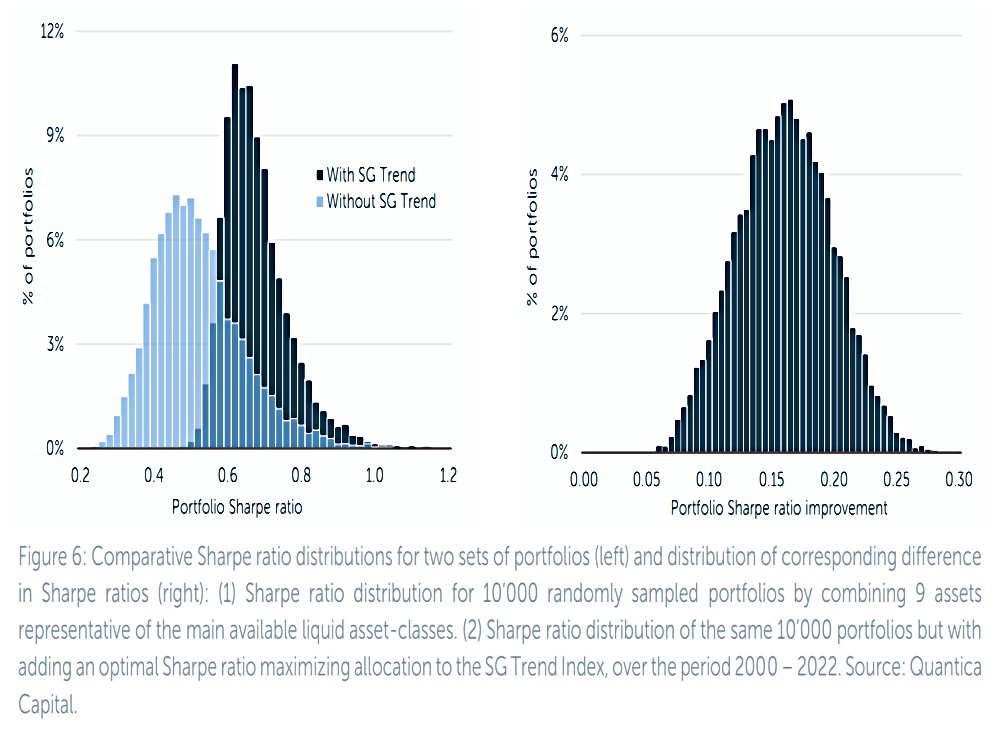
Sharpe ratios increase by 0.16 (31%) on average, from 0.51 to 0.67
Good when it counts
The next stage of the analysis looks at adding trend on a rolling 5-year basis, rather than a fixed allocation to trend over 22 years.
- The analysis recalculated the trend allocation every six months, looking back 5 years).
- This is a sample size of 360K periods (10K portfolios x 36 half-years).
The average allocation to trend under this analysis is 30%.
- The dispersion of optimal weights is higher, and trend would not have improved the Sharpe ratio for around 20% of portfolios.
Most of these cases are concentrated in the following three specific fiveyear periods: 2003 – 2007, 2009 – 2013, 2015 – 2019. These periods coincided with a generally positive market environment for both equities and bonds.
When things are good, you don’t need trend.
- The average 5-year Sharpe during these periods was 1.22, compared to an average 5-year Sharpe of 0.7 over 22 years.
The average Sharpe for the period when trend did help was just 0.61.
Trend-following leads to portfolio diversification when it matters, i.e. when the underlying portfolio performs below its historical average. The stronger the riskreturn characteristics of the underlying portfolio, the smaller the benefit of a complementary trend-following allocation.
10% allocation
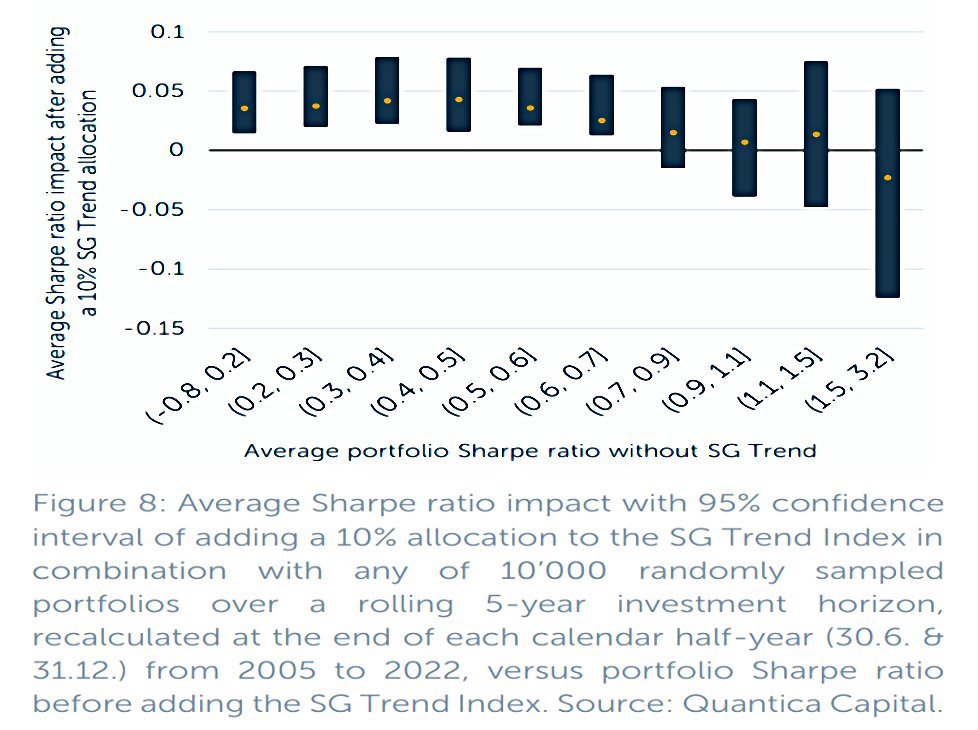
Next, the authors looked at adding a fixed 10% allocation to trend.
[This] can be compared to the allocation weighting typically chosen by institutional investors for the so-called “risk-mitigating” sleeve of their portfolios.
Adding a 10% trend allocation benefits all portfolios where the initial 5-year Sharpe is below 1.5, which was 90% of portfolios.
- The benefit is statistically significant for portfolios with a starting Sharpe below 0.75 (60% of portfolios).
The (negative) impact of adding trend to the best portfolios is minimal since their Sharpes are so high.
Lower trend returns
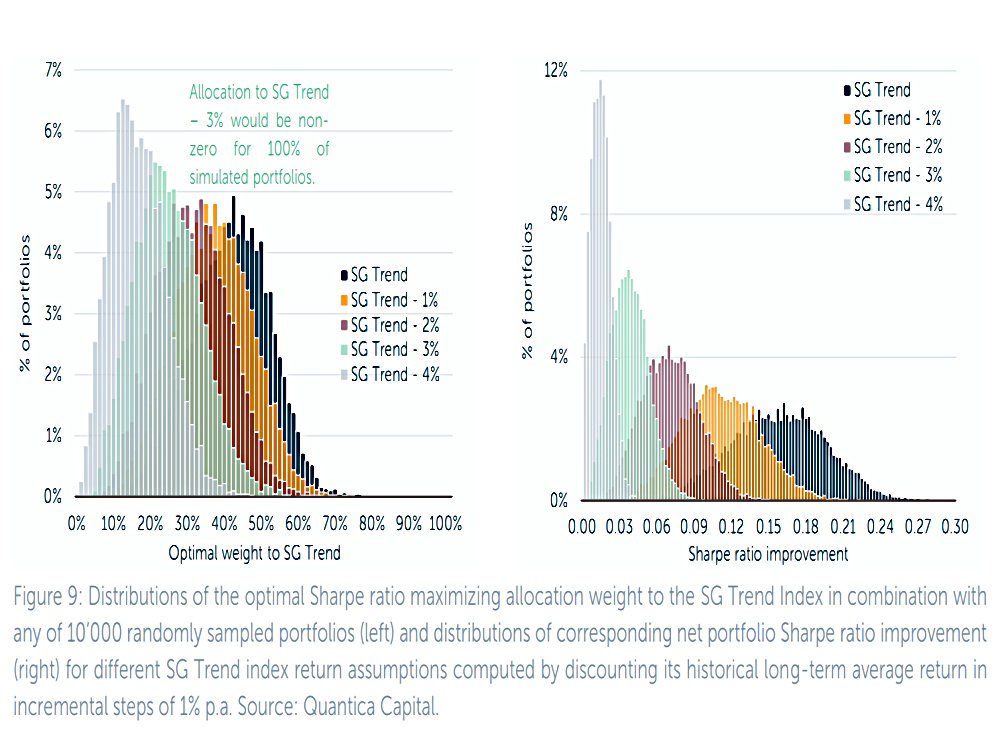
The final step in the analysis looked at the sensitivity of the portfolio diversification benefit to the returns generated by trend.
The SG Trend Index has on average returned 6.3% per year since its inception in 2000, with an annualized volatility of 13.5%.
The analysis applies penalties of 1%, 2%, 3% and 4% pa to this historical return (with volatility held constant).
Even if the average annual return of a benchmark trend-following strategy were to be only half its historical average, the optimal allocation to the SG Trend Index would still be non-zero for 100% of all randomly sampled liquid portfolios.
Trend returns would need to fall below 2% pa before the diversification benefits become questionable.
- The persistence of the benefit arises from the low correlation of trend with stocks and bonds.
That’s it for today.
- This short and clear paper makes it difficult to argue against a 10% allocation to trend, and in all probability, a 30% allocation.
Alas, for the UK private investor, implementation is not straightforward.
- Until next time.
Mike Rawson
Mike is the owner of 7 Circles, and a private investor living in London. He has been managing his own money for 40 years, with some success.