Meb Faber on Trend

Today’s post looks at an old paper from Meb Faber on trend following.
Contents
Meb Faber

We’ve come across Meb many times before.
- He runs Cambria Investment Management and has a lot of interesting (US) ETFs.
He also has a podcast and has written a few good books.
Today we’re looking back to one of his earliest papers, published in 2010 and called “Relative Strength Strategies for Investing”.
- The goal of the paper is to present a simple (quant) method for improving risk-adjusted returns in both US stocks and a global portfolio.
The RS model gives higher returns for equity-like risk and outperforms buy and hold in 70% of years.
- An improved version which uses a trend parameter to dynamically hedge gives lower volatility and smaller drawdowns.
Momentum
Meb starts by referencing the momentum literature – he’s not trying to be original here.
Our intent is to describe some simple methods that an everyday investor can use to implement momentum models in trading. The focus is on the practitioner with real world applicability.
Which is just what we’re looking for.
Sectors
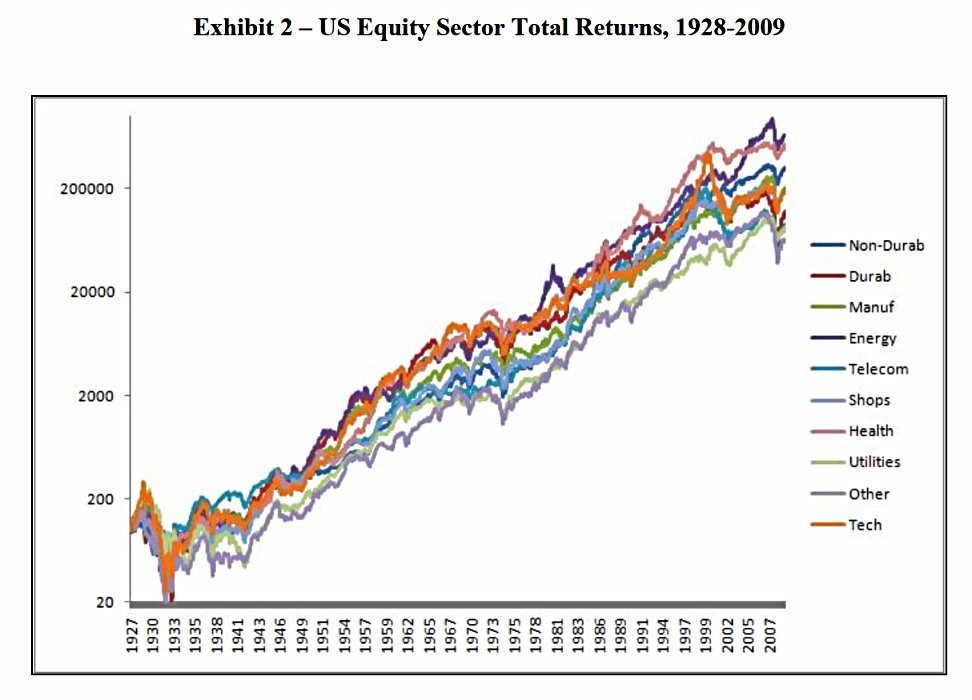
The first analysis is of US sectors, using the French-Fama CRSP Data Library, with data from 1926 through 2009.
Here are the sectors:
- Consumer Non-Durables — Food, Tobacco, Textiles, Apparel, Leather, Toys
- Consumer Durables — Cars, TV’s, Furniture, Household Appliances
- Manufacturing — Machinery, Trucks, Planes, Chemicals, Office Furniture, Paper, Commercial Printing
- Energy — Oil, Gas, and Coal Extraction and Products
- Technology — Computers, Software, and Electronic Equipment
- Telecommunications — Telephone and Television Transmission
- Shops — Wholesale, Retail, and Some Services (Laundries, Repair Shops)
- Health — Healthcare, Medical Equipment, and Drugs
- Utilities
- Other — Mines, Construction, Transportation, Hotels, Business Services, Entertainment, Finance
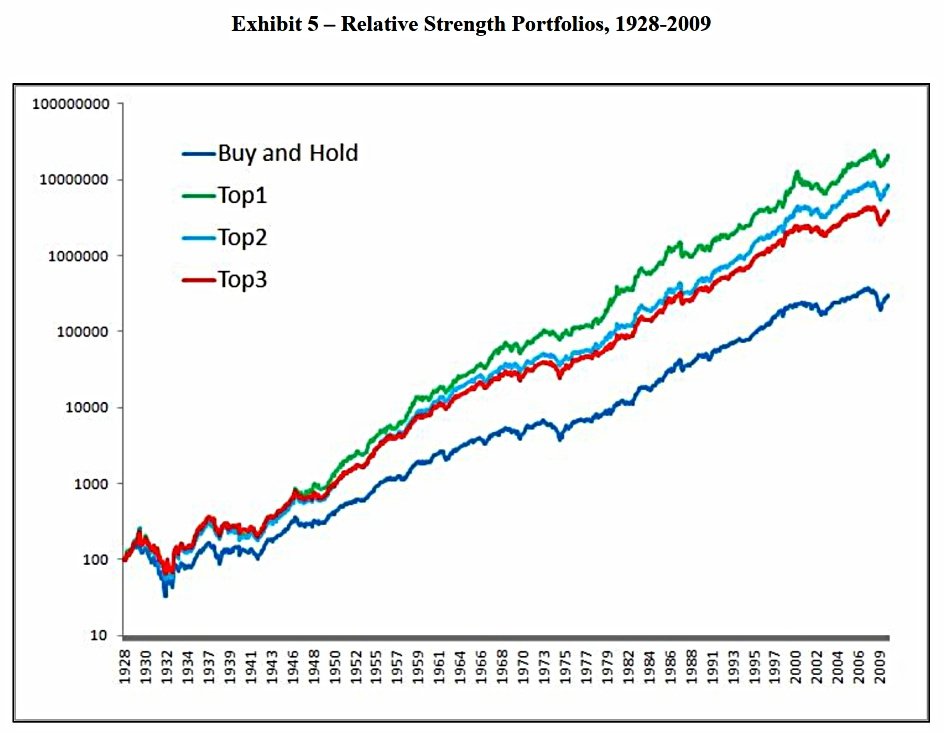
Buy and hold in these sectors shows strong returns:

A portfolio equally weighted across all sectors also does well:
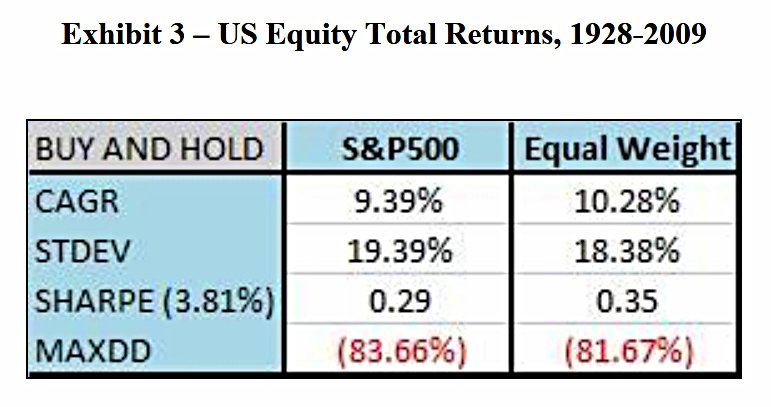
The issue with buy and hold was not the returns, but the volatility and the massive drawdowns.
The system
- The sectors are ranked each month by trailing total returns (including dividends)
- Different lookback periods are used, including a blend of lookbacks (average of returns across different periods)
- The system invests equally in the top X sectors (with X ranging from 1 to 9)
- Sells only occur when a sector falls out of the top X at the monthly rebalance
The initial results ignore commissions, but there is an Implementation section below.
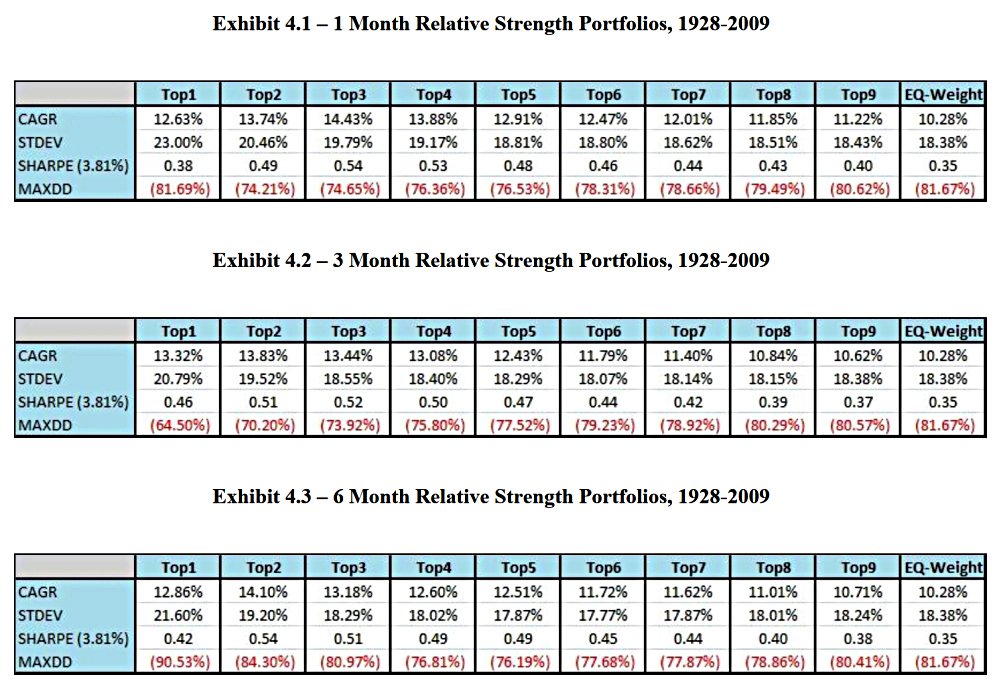
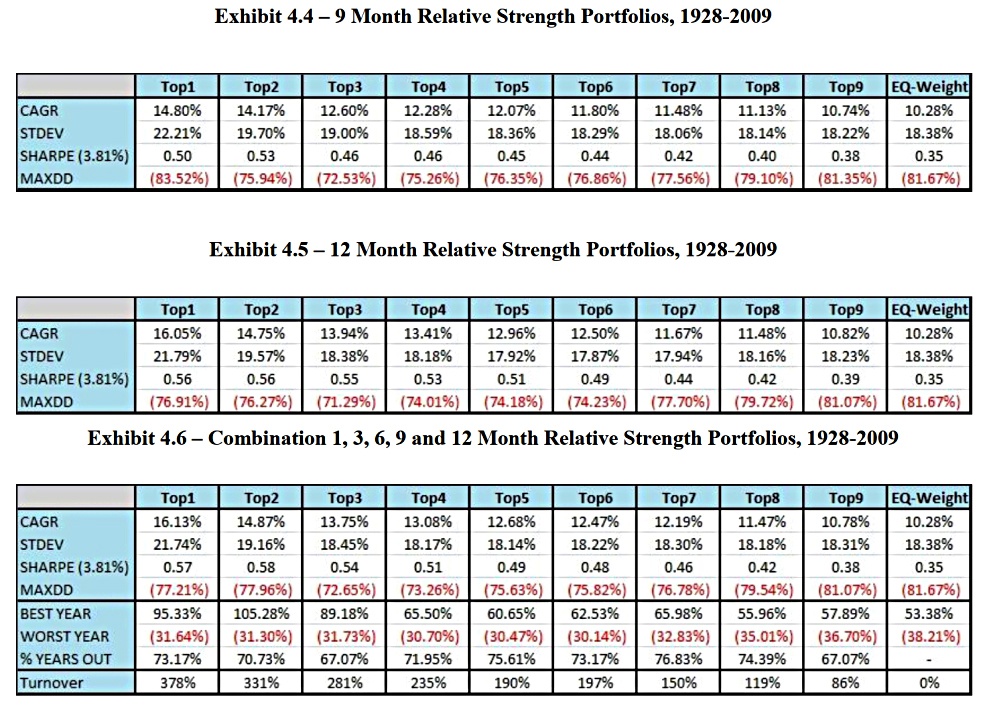
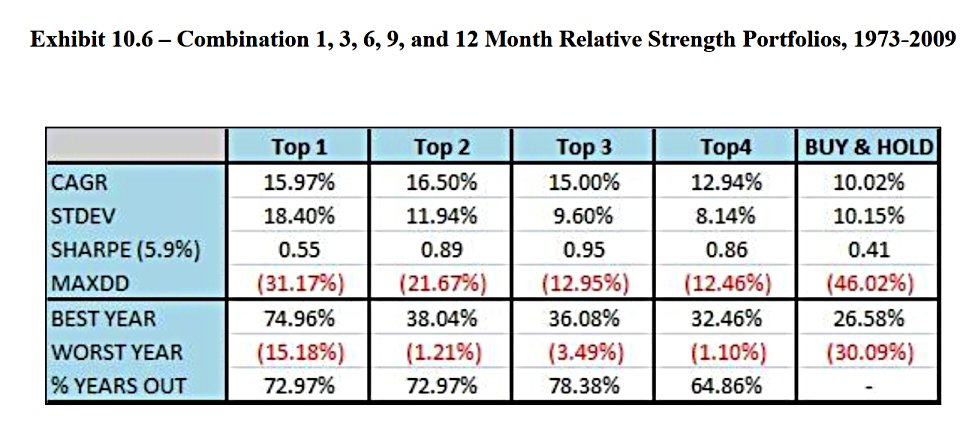
The relative strength method works on all of the measurement periods from one month to twelve months, as well as a combination of the 1, 3, 6, 9, and 12 month time periods. The system outperforms buy and hold in roughly 70% of all years.
Meb estimates average outperformance at 3% to 6% pa.
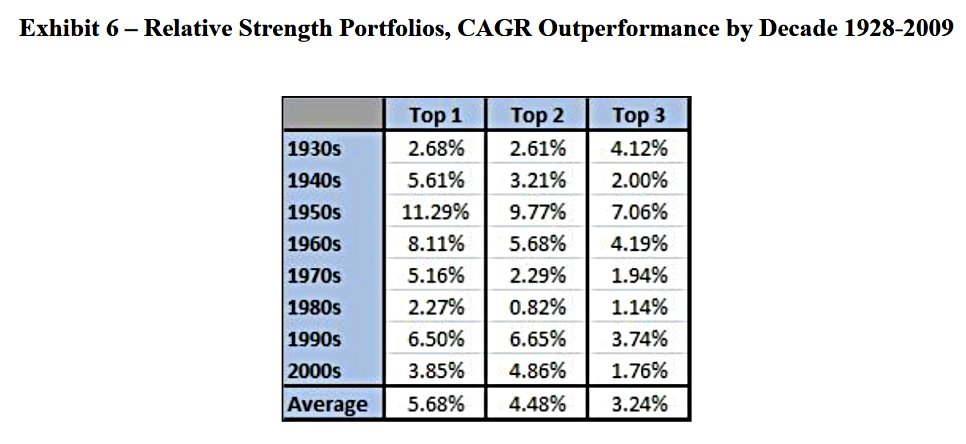
This chart shows the CAGR outperformance by decade.
Issues
The biggest issue for the basic system is that is it long-only and fully invested, so it is exposed to US stock risk.
- This shows up in the high volatility and large drawdowns.
There are two possible solutions:
- some form of hedging
- adding some non-correlated asset classes
Hedging
Meb chooses a dynamic hedging technique using a long-term moving average.
- This is detailed in another of Meb’s papers which we will cover in a future post.
The portfolios move entirely to 100% cash (T-Bills) when the S&P 500 is below its 10 month Simple Moving Average (SMA).
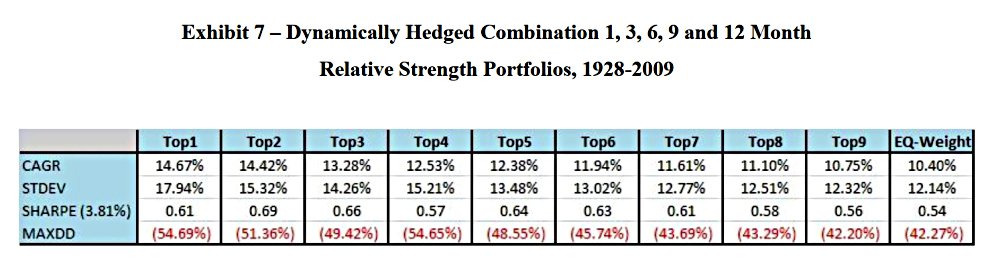
Most of the portfolios keep their returns, but massively reduce their drawdowns and volatility.
- The Top 1 approach loses 1.5% pa of returns.
Diversification
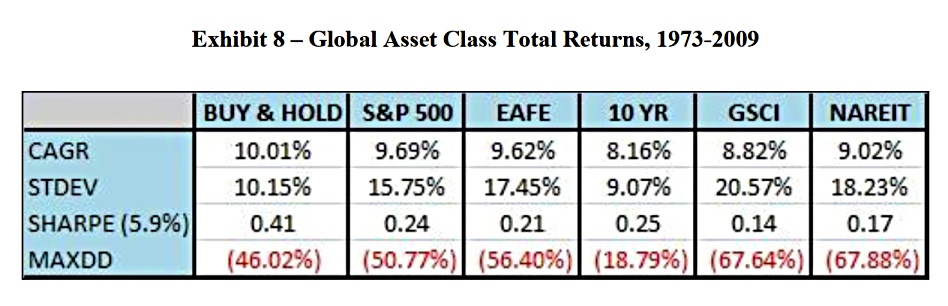
Here Meb uses five asset classes.
We detailed this method in our book The Ivy Portfolio with a global rotation system that adds foreign stocks, bonds, REITs, and commodities to the portfolio.
First, let’s look at the buy and hold returns for these asset classes (buy and hold in the table below is an equal allocation to all five assets).
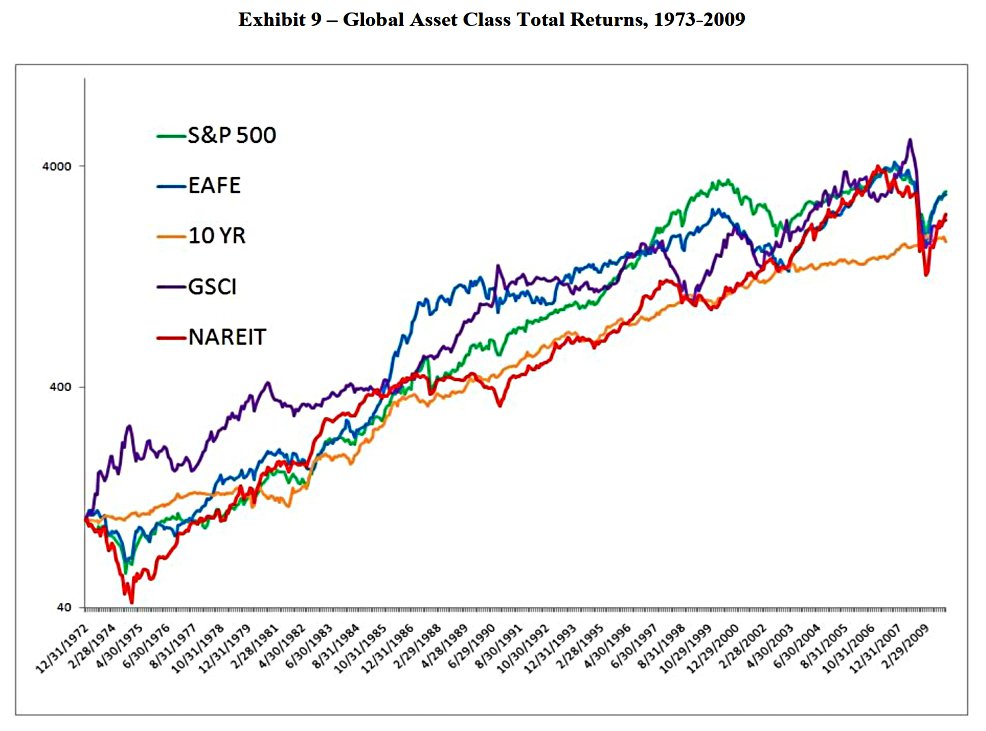
Here are the results for the system using the five asset classes:
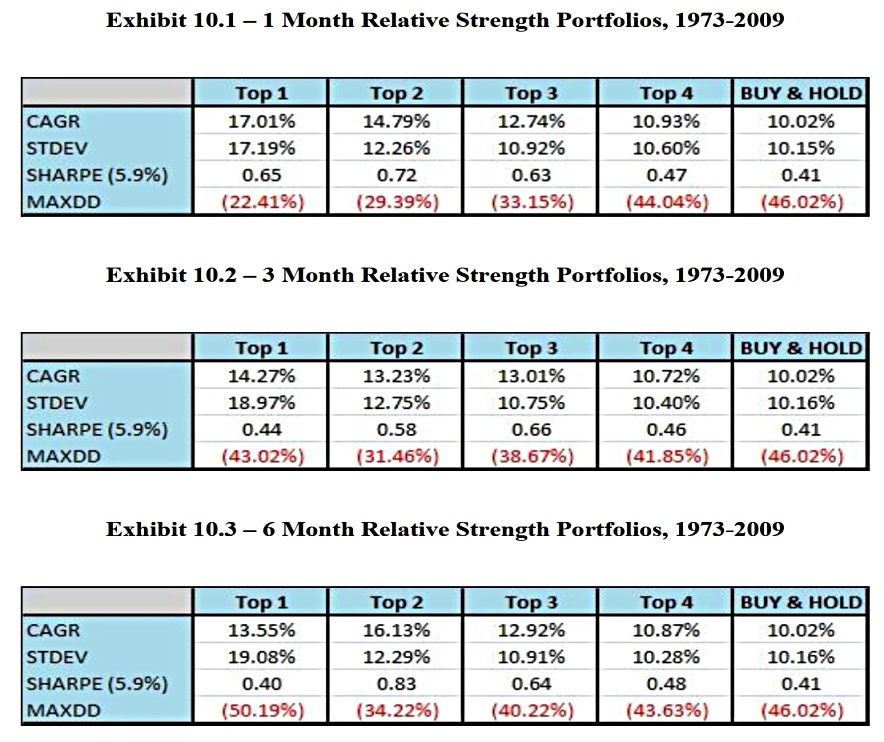
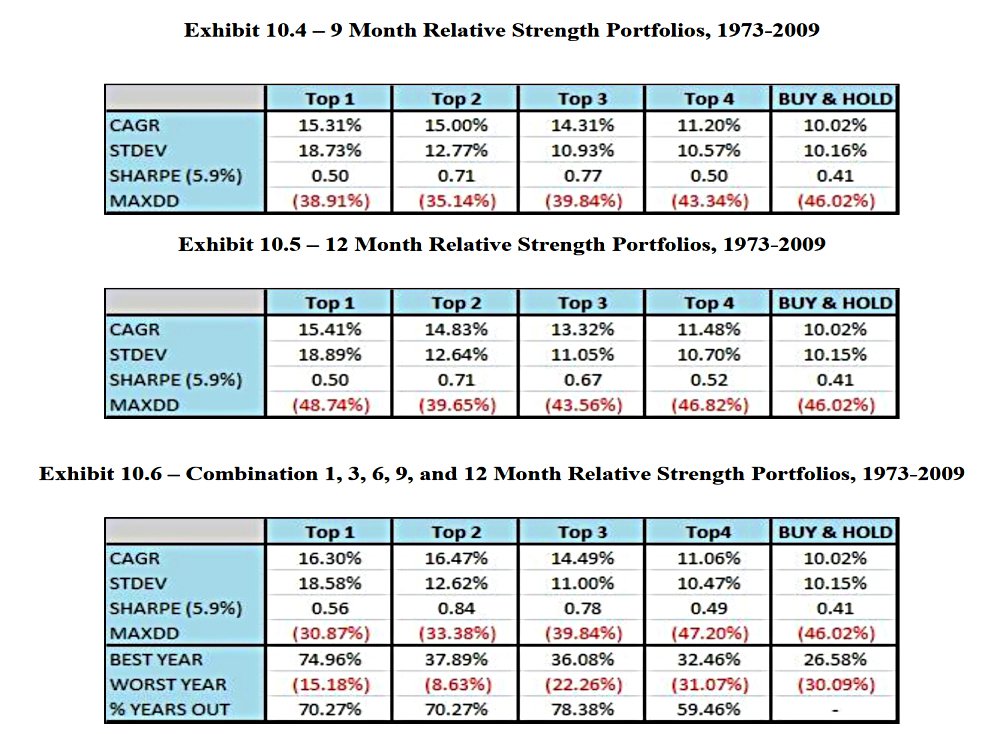
Once again the system works on all periods and the blend of lookbacks, with outperformance in most years, and similar relative improvements over buy and hold as for US sectors.
Here’s the equity curve:

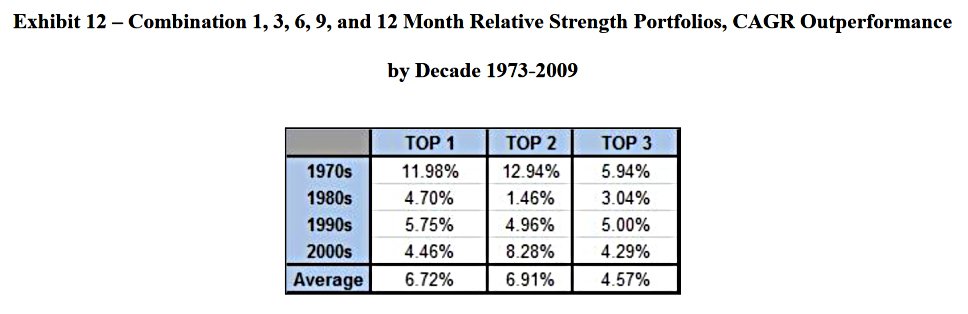
And here’s the outperformance by decade:
Hedging and diversification
As the last exercise, Meb combines the two fixes:
Rotation among global asset classes but only investing in the asset class if it is trading above its 10 month SMA. The results are slightly improved Sharpe Ratios and similar absolute returns, but with marked reductions in drawdown. The effect is most seen in the portfolios that utilized more asset classes.
Implementation
The main issue for implementation is transaction costs, which were somewhat larger when Meb wrote the paper. But:
Assuming a round trip cost of 1% would still allow for excess momentum profits.
This should be feasible with larger transactions in ETFs, or trades on the newer low-cost brokerage apps.
Meb also suggests a sell filter:
Assuming a universe of ten funds, the investor could buy the top three funds and sell them when the funds drop out of the top five funds. This approach would lower the turnover to sub-100% levels.
Taxes are also an issue, but more so in the US, where short-term trading is penalised.
- Ideally, a tax-sheltered account would be used.
Conclusions
This is a pretty convincing paper – across eight decades, the basic system improves returns (but not volatility or drawdowns).
Even better, this is a system that could be implemented via ETFs in an ISA or SIPP.
- I will add it to my list for further investigation.
Until next time.
Mike Rawson
Mike is the owner of 7 Circles, and a private investor living in London. He has been managing his own money for 40 years, with some success.