Qian on RP

Today’s post looks at three papers from Edward Qian, who first used the term Risk Parity.
Contents
Edward Qian
These days, the Risk Parity (RP) approach to portfolio construction is usually associated with Ray Dalio and Bridgewater.
- But the first person to use the term back in 2005 was Edward Qian, the Chief Investment Officer and Head of Research, Macro Strategies at PanAgora Asset Management.
PanAgora have actually used “Risk Parity” and “Risk Parity Portfolios” as trademarks, though I’ve never seen anyone else refer to them as such.
Today I want to look at three of Edward’s papers on RP:
- Risk Parity Portfolios: Efficient Portfolios Through True Diversification (September 2005)
- Risk Parity Portfolios: The Next Generation (November 2009), and
- Risk Parity and Inflation (April 2010).
Risk Parity Portfolios
The first paper explains what RP portfolios are – something that we have covered in several previous articles.
Risk Parity Portfolios are a family of efficient beta portfolios that allocate market risk equally across asset classes, including stocks, bonds, and commodities.
I take efficient to mean the highest available return for a particular level of risk.
Edward also notes the imbalance in the traditional 60/40 portfolio:
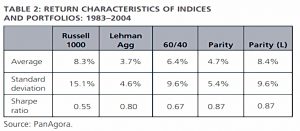
From 1983 to 2004, the excess return of the Russell 1000 Index had an annualized volatility of 15.1% and the Lehman Aggregate Bond Index had an annualized volatility of 4.6%, while the correlation between the two was 0.2. Stocks contributed 93% of risk and bonds contributed the remaining 7% for a 60/40 portfolio.
Loss contribution
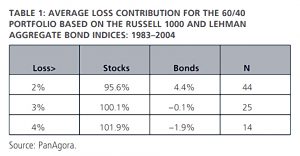
The point about risk contribution is that it is an accurate predictor of loss contribution.
For losses above 2%, stocks, on average, contributed 96% of the losses. For losses greater than 3% or 4%, the contributions from stocks are higher, above 100%.
Thus the diversification from bonds in a 60/40 portfolio is insignificant.
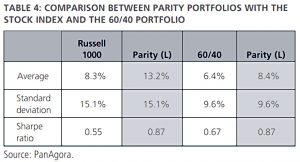
This table compares the 60/40 to an RP portfolio which is 23% stocks and 77% bonds, and to a leveraged RP portfolio.
- Note the much higher Sharpe ratios of the RP portfolios.
The leveraged RP portfolio has better returns than 100% stocks, with lower volatility.
If we are prepared to tolerate the volatility of the 100% stocks portfolio, we can increase the leverage on the RP portfolio still further until we reach that point.
- In this case, we need 280% leverage, but in return, we outperform by almost 5% pa.
The “original” levered RP portfolio has 180% leverage and outperforms the 60/40 portfolio by 2% pa.
RP efficiency
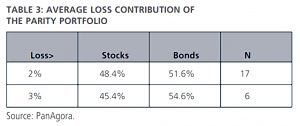
What about loss contribution in RP?
For a loss of 2% or more, stocks contributed 48% and bonds 52%; for a loss of 3% or more, stocks contributed 45% and bonds 55%.
Which is pretty close to parity for relatively small sample sizes.
Risk Parity Portfolios are actually meanvariance optimal if the underlying components have equal Sharpe ratios and their returns are uncorrelated.
Neither of these requirements will be met in practice, but we can get close.
RP also makes efficient use of correlations:
Assets that have exhibited higher correlations with other asset classes will have a lower weight and those that have exhibited a lower correlation will have a higher weight. Commodities, for instance, would have a significant weight due to its low correlations with both stocks and bonds.
The Next Generation
The second paper was written after the 2008 financial crisis, and draws lessons from that:
A mere reallocation among risky assets, for instance moving into private equity, real estate, high-yield bonds, hedge funds, etc., by reducing traditional equity stake, does not provide true diversification as the correlations among the risky assets rise significantly during financial stress.
Next, Edward looks at some of the major world indices, to reveal the skewed risk contribution within them.
First up is commodities:
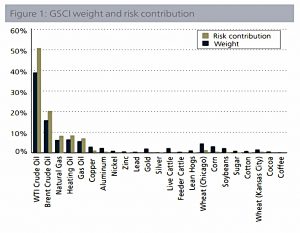
The index has over 70% of its weight in the energy sector, which in turn comprises 95% of the risk, while the remaining four sectors account for just 5% the total risk.
There are echoes here of the 60/40 portfolio.
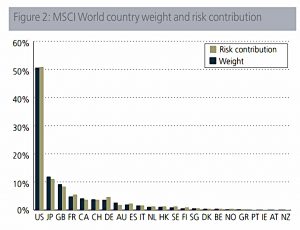
As we know, stock indices are dominated by the US, with Japan the next largest country and Europe the next largest region.
- And within individual country indices, particularly in the US, the top few firms dominate.
This will lead the index to underperform an equally-weighted portfolio in the long run.
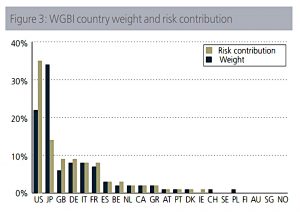
Bonds are also dominated by the US, along with Japan, Great Britain, Germany, Italy, and France.
- Japan has a higher weight than the US, but a lower risk contribution because its bonds have lower volatility.
To counteract these issues, PanAngora extended their RP portfolios to a broader range of stocks, bonds and commodity components.
- They developed RP products within each of these asset classes, which could then be combined into a higher level RP portfolio.
Our backtest results show that in all cases without exception, the Risk Parity Portfolios provide better Sharpe ratios with higher long-term returns relative to the traditional benchmarks with similar or lower risk.
On an annual basis, Risk Parity Commodity Portfolio outperformed the GSCI Index by over 700 basis points, Risk Parity Equity Portfolio outperformed the MSCI World Index by 250 basis points, and Risk Parity Bond Portfolio outperformed the WBGI Index by 40 basis points.
I assume these are levered portfolios with the same volatility as the benchmark.
RP and Inflation
The third paper looks at how RP deals with inflation, which is once again relevant today.
Risk Parity portfolios tend to have a larger exposure to fixed income because investmentgrade bonds have relatively lower return volatility. With bond yields near the lower end of their historical range, one natural concern about a Risk Parity portfolio is its exposure to a “leveraged” bond position.
Rising inflation threatens higher nominal interest rates, which hurt bonds and may not be kind to stocks either.
In theory, equity should provide inflation hedging since equity investors have a claim to real company earnings. In practice, however, this has not been the case.
RP (specifically, PanAgora’s RP product) has two ways of protecting against inflation:
The first line of defense is through exposure to commodities and TIPS. The target baseline risk allocation to these two asset classes is 20%, which amounts to a significant notional exposure of 40% on average.
That really is a significant exposure.
The second element is a “dynamic risk allocation process”:
Dynamic risk allocation is highly responsive to inflation cycles.
Historical analysis
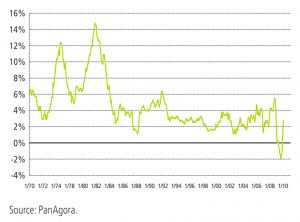
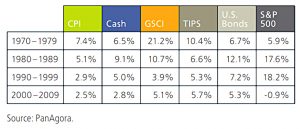
US inflation fell from 7.4% pa in the 1970s to 5.4% in the 80s, 2.9% in the 90s and 2.5% from 2000 to 2009.
- It stayed low until 2021 when it rose sharply, and it still hasn’t stopped rising at the time of writing.
The 1970’s lends itself to be an ideal stress-testing environment for the Risk Parity approach to asset allocation. In addition to elevated inflation, the 1970’s also experienced a massive increase in the level of interest rates.
During the decade, the federal funds rate was increased by 1200 basis points (from 3.50% to 15.50%) and 10-year yields increased by 400 basis points (from 5.35% to 9.35%).
To test the performance of RP, Edward uses a simulated portfolio of US stocks, US bonds, TIPS and commodities (GSCI).
The table shows the performance of these assets during each of the four decades before the paper was written.
In the 1970’s when inflation was high and volatile, cash, nominal bonds, and stocks had positive returns but they all underperformed CPI, resulting in negative real returns. GSCI was by far the bestperforming asset while TIPS also returned 3% higher than CPI.
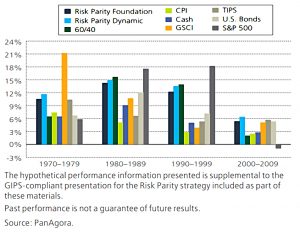
This table compares an RP portfolio (and a Dynamic RP portfolio) to the 60/40 portfolio (and to CPI).
The hypothetical Risk Parity portfolios performed quite well in the 1970’s. The Risk Parity portfolios generated nominal returns above 10%, and real returns above 3%, while the 60/40 portfolio delivered an annualized average real return of -0.9% for the decade.
The allocations to commodities and TIPS worked.
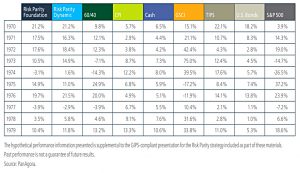
Edward also looks at the returns in the 1970s on a year by year basis.
There were two inflation cycles in the 10-year period. From 1970 to 1972, inflation declined only to spike in 1973 and 1974. From 1975 to 1976, inflation declined again only to spike again from 1977 to 1979.
Asset classes behaved largely as expected:
In 1973 and 1974, equities were down sharply while commodities and TIPS kept up with rising inflation and nominal bonds had positive nominal returns but negative real returns. From 1977 to 1979, commodities performed well throughout while other asset classes showed some deviations.
RP portfolios outperformed 60/40 in both the rising and declining inflation periods of the 1970s.
That’s it for today – we’ve seen another source (( Some would say the original source )) of evidence in favour of RP portfolios, even in high inflation environments.
- Until next time.


