Engineered Portfolios

Today’s post is a look at Engineered Portfolios – a site run by a couple of engineers with a passion for investing.
Contents
Engineered portfolios
I came across the site because one of the founders submitted a featured question to the Risk Parity Radio podcast.
- They asked Frank about using momentum in his Risk Parity portfolios.
We’ll look at the system they proposed in a future post, but today I want to look at their asset allocation strategies, or what I would call their Lazy Portfolios.

Chris Ludlow has an aerospace engineering degree and an MBA and works as the CFO at a small company.

Steve Hanly has a mechanical engineering degree and works in the same firm as Chris.
Our goal is to help everyone understand that though investing is a complicated process, it can be made simple. How? By constructing a diversified efficient portfolio based upon your personal risk tolerance.
So far, so good.
The rules

![]()
The portfolio page on the website kicks off with a quote from Charles Ellis’ famous book, Winning the Loser’s Game:
Portfolio management is neither an art nor a science. It is instead an unusual problem in engineering, determining the most reliable and efficient way to reach a specified goal, given a set of policy constraints, and working within a remarkably uncertain, probabilistic, and always changing world of partial information and misinformation, all filtered through the inexact screen of human interpretations.
The main rule that separates the EP portfolios from my own is simplicity.
- EP will only allow allocations of 10% and 20% to any single asset class, whereas I have allocations right down to below 1% of net worth.
So the EP portfolios all have between five and 10 asset classes, whereas I use more than 50.
- The single exception to this rule is EP’s least risky portfolio, which has a 60% allocation to T-bills (but still five asset classes).
I can see the attraction of very simple portfolios to investors who are just starting out, or who have a small pot (say £50K or less) but in general, I think that portfolios should be as diversified as is practical.
Metrics
EP used data from 1972 to 2016, with annual rebalancing.
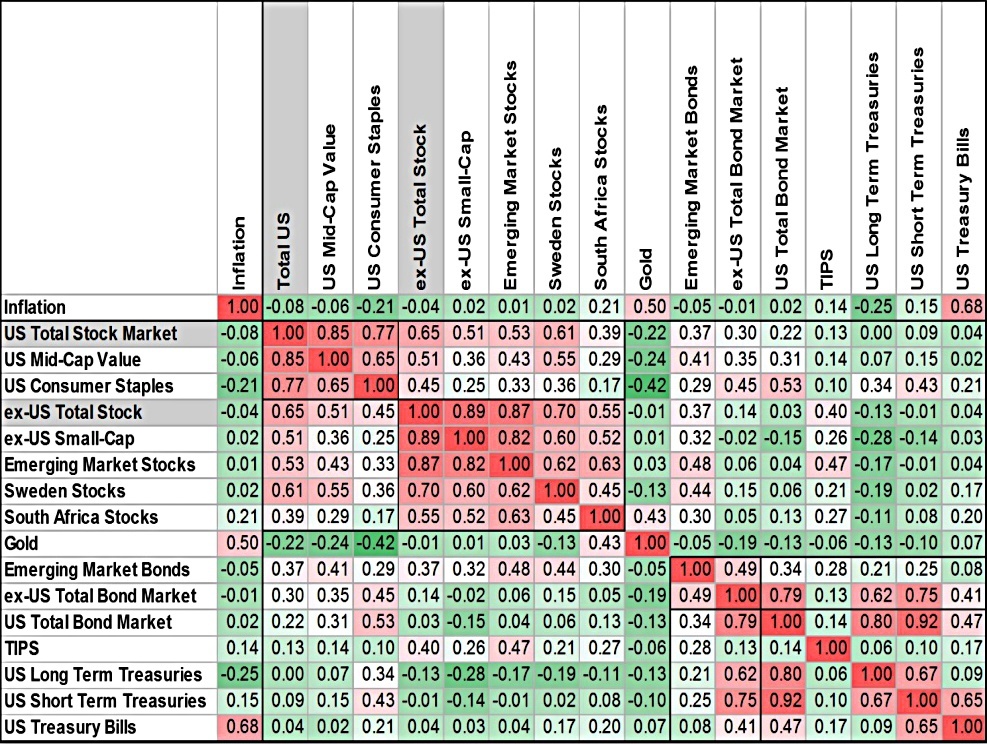
The chart below shows the correlations between the asset classes that they looked at:
EP has four return metrics:
- Average annual return
- Annualized return (CAGR)
- Average 10-year return
- Worst 15-year return
These are fine, assuming that the averages are geometric rather than arithmetic.
They also have four risk metrics:
- Volatility (standard deviation) of annual returns
- Downside risk (RMS of losses)
- The volatility of 10-year returns
- Largest drawdown (the worst peak to trough)
These also look good.
Time horizons
The six EP portfolios are designed to match the time horizon of the investor:
- 1 year (savings)
- 2 years (conservative income)
- 3 years (income)
- 5 years (conservative growth)
- 10 years (growth)
- 20 years (aggressive growth)
I find it hard to think of investing over anything but the longest timescales, so the 20-year portfolio will be of most interest to me.
The portfolios
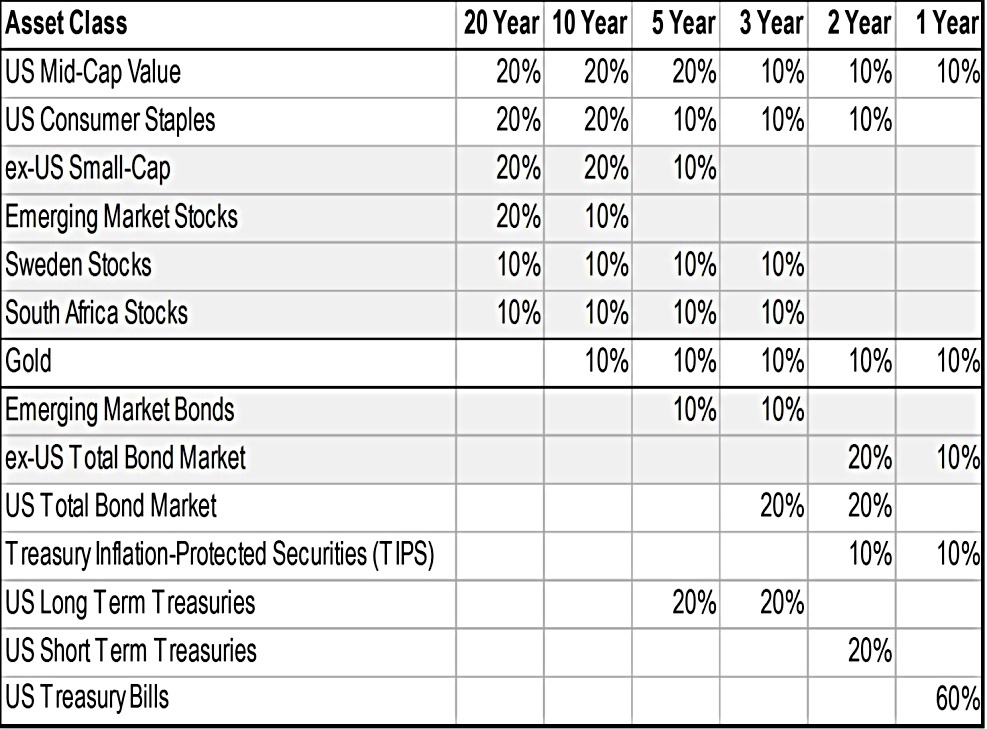
The portfolios for five years and less have bond allocations, but the 10-and 20-year portfolios do not.
- The 10-year has a 10% allocation to gold, but the 20-year is 100% stocks.
I don’t think this idea – which seems to be popular amongst younger investors – is a good one.
- Most research points to a sweet spot of 20% to 25% non-equities.
Bonds are in a dark place at the time of writing, but in general, damping down volatility (the main drawback of stocks) will work out over the long run.
The longer-term portfolios are very US-centric (60%) and use some big sector tilts (mid-cap value, consumer staples).
- The non-US elements are particular and bold – 10% to Sweden and South Africa.
I am a fan of splitting out sub-sectors within regions as your portfolio grows, but my Nordic allocation is 0.5%, as is my African allocation.
- The EP allocations suggest an element of cherry-picking (data mining) to me).
Comparisons
EP benchmark their portfolios against those from Vanguard, Betterment, and Wealthfront:

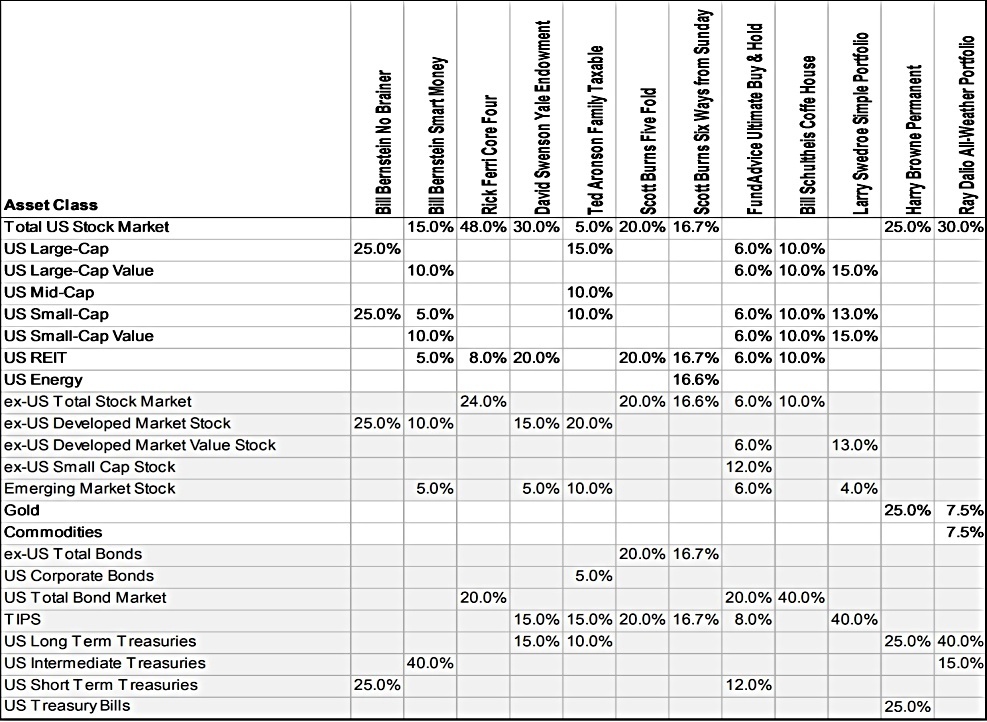
And they also look at many of the popular Lazy Portfolios:
Results
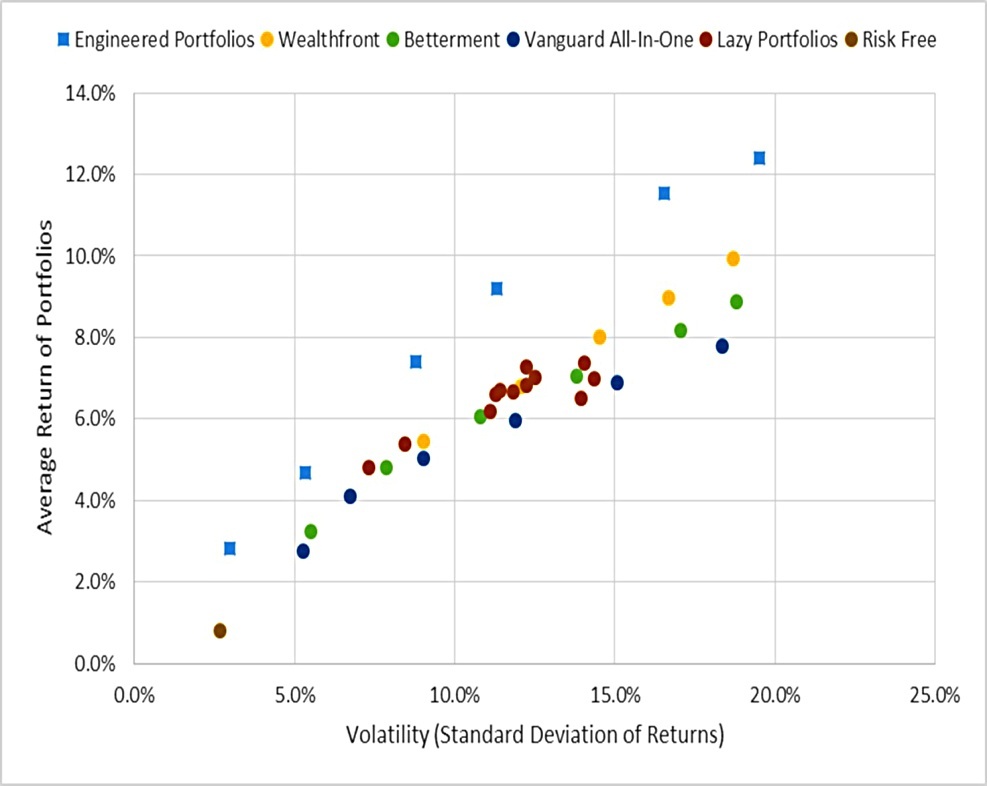
Most investors will start by comparing returns to volatility, though EP has its reservations:
These metrics don’t weight losses harshly enough and they penalize upside volatility – something that an investor typically doesn’t care about.
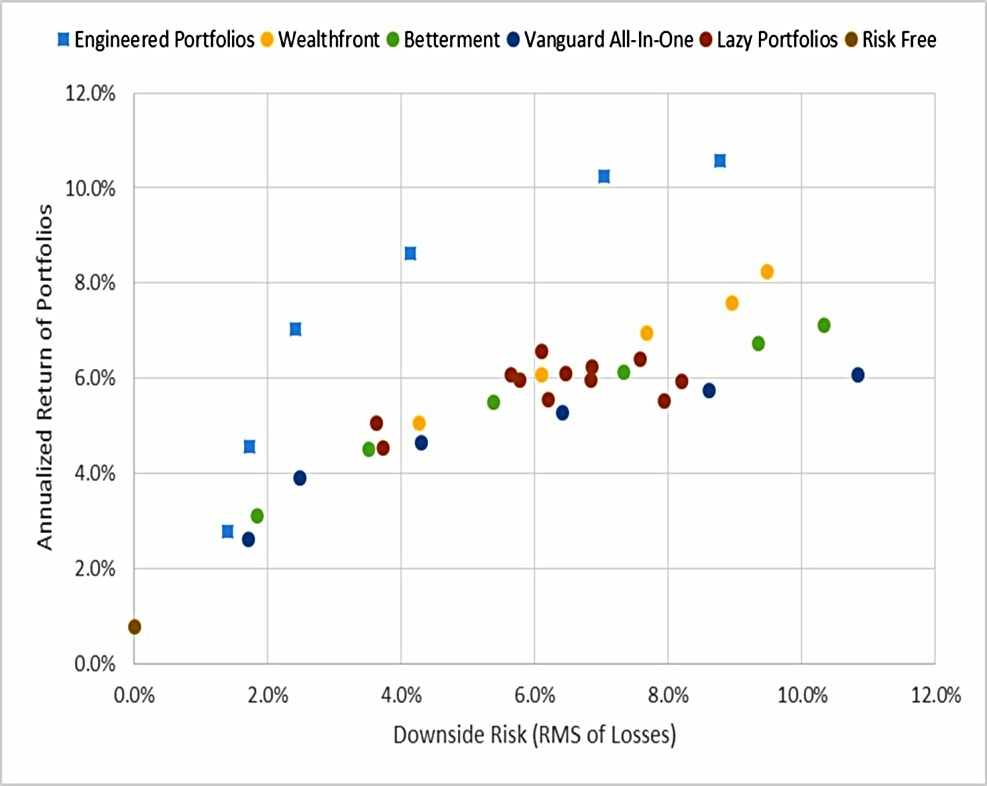
The EP portfolios look very good when comparing annualized returns to downside risks.
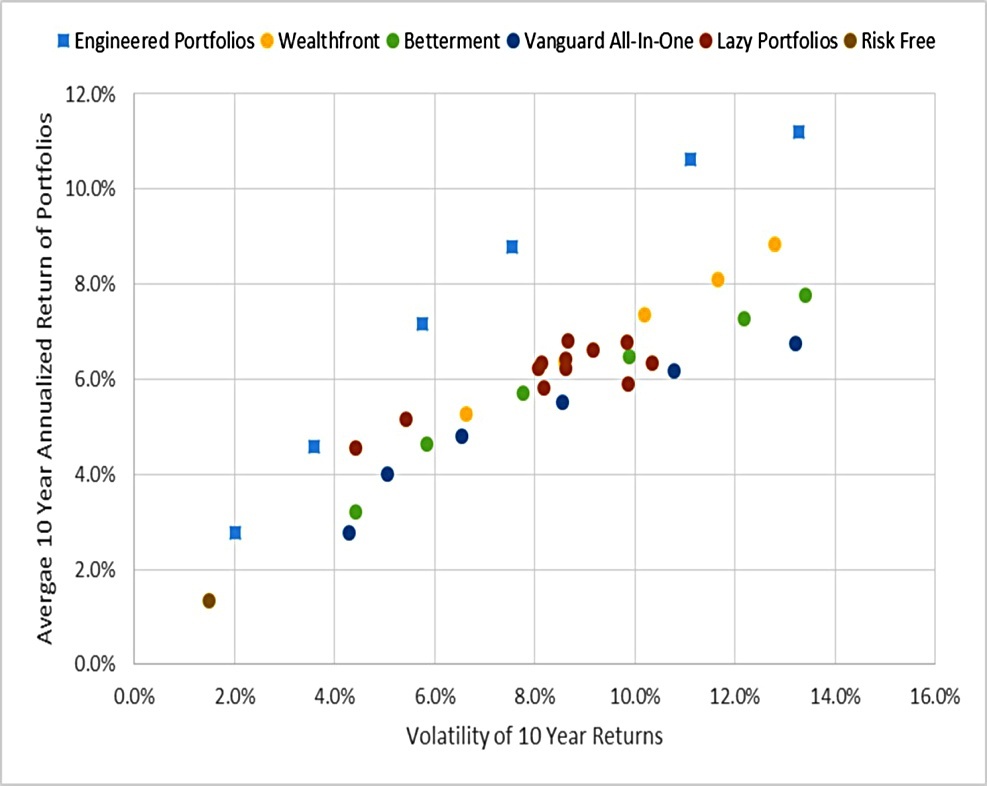
The next chart looks at consistency, comparing 10-year returns with their volatility.
- The EP portfolios still do well.
The two “lazy portfolios” that appear to do okay here are the only two that contain gold: Harry Browne and Ray Dalio (he also has commodities).
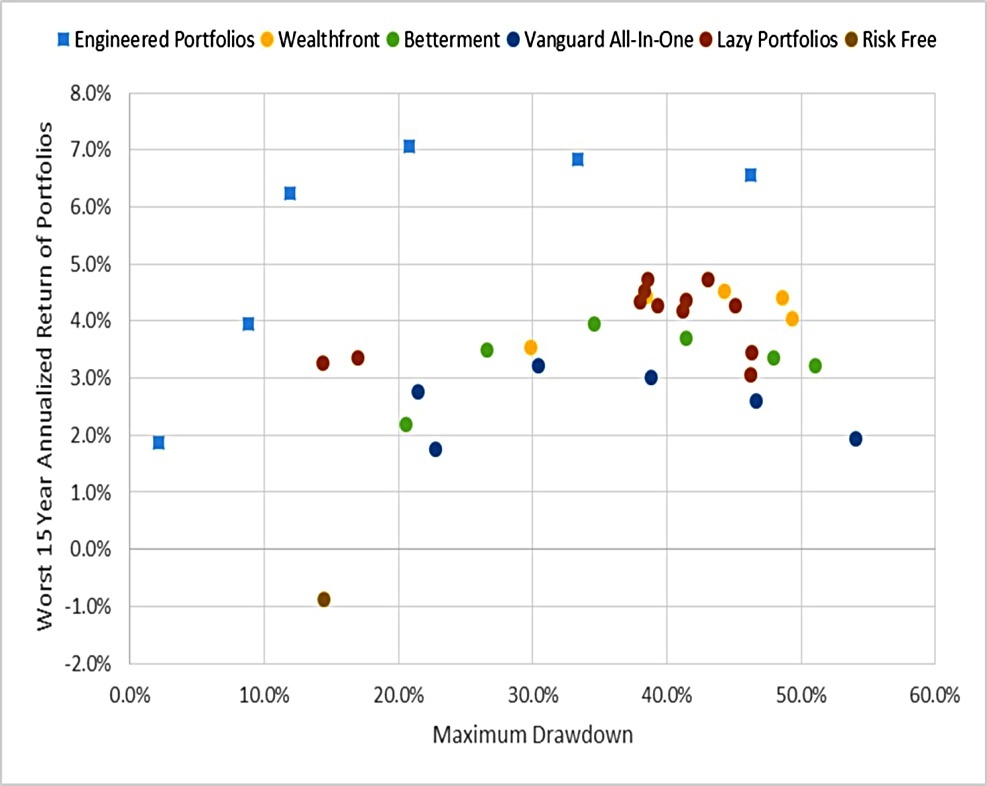
The next chart plots the worst 15-year returns against the largest drawdown to see “how bad things could get”.
- The long-term EP portfolios don’t fare so well here, with big drawdowns (though also decent returns).
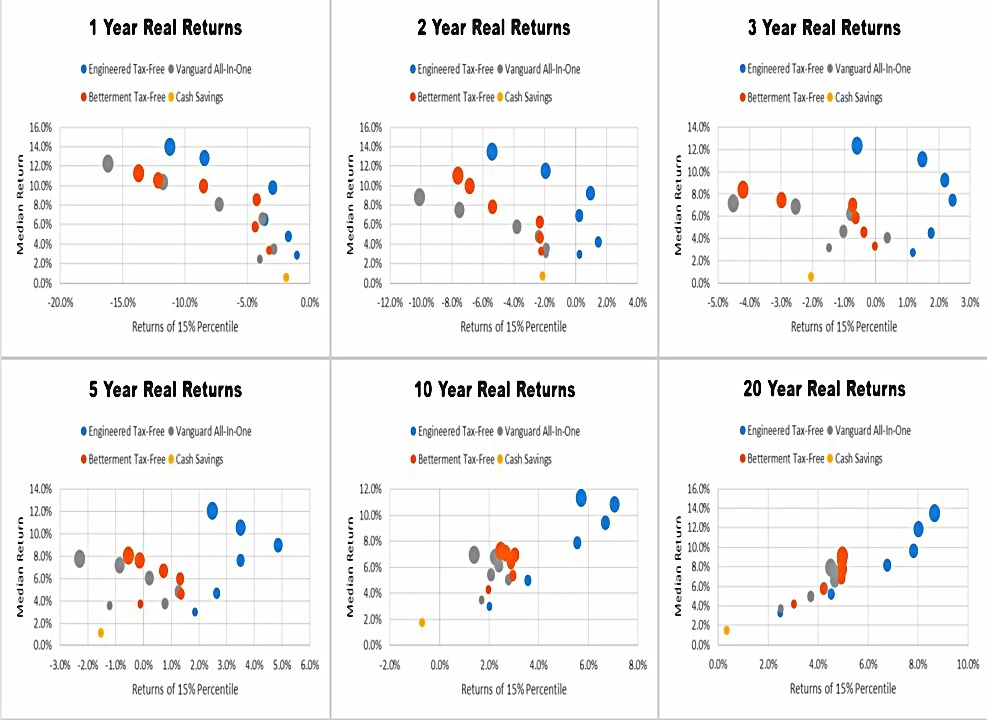
The final chart looks at 15th percentile returns (bad, but not the worst) over all of the EP timeframes, plotting this against the median return (50th percentile).
- I don’t see this point – I want to know about the average return and the worst return, not the 15th percentile.
It reminds me of the studies on withdrawal rates which look at 95% success rates over 25 or 30 years.
- I’m more interested in 100% success over 40 and 50 years.
Conclusions
It’s been an interesting exercise, but I’m not sure that the guys at EP have drawn the right conclusions.
- They appear to have cherry-picked sector tilts and foreign countries to outperform over a specific (and relatively short) time frame.
- There’s no reason to believe that Sweden and South Africa are uniquely positioned to improve your portfolio’s future returns.
- The long-term portfolio uses 100% stocks, rather than 75% to 80% as most studies would recommend.
- They have a large home (US) bias. (( I don’t buy the argument that because the US has 60% of the global stock market capitalisation, that should be its weight in your portfolio ))
- They have arbitrary limits on asset allocation that lead to portfolios that are too simple for me.
I would call these portfolios not just engineered, but over-engineered.
- Until next time.
Mike Rawson
Mike is the owner of 7 Circles, and a private investor living in London. He has been managing his own money for 40 years, with some success.