Irregular Roundup, 20th November 2023

We begin today’s Weekly Roundup with inflation.
Inflation

We had a Goldilocks inflation print in the US last week, followed the next day by a UK CPI reading of 4.6%, down from 6.7% in September (Core inflation fell from 6.1% to 5.7%).
John Authers looked at the US numbers – and the market reaction – in his Bloomberg newsletter.
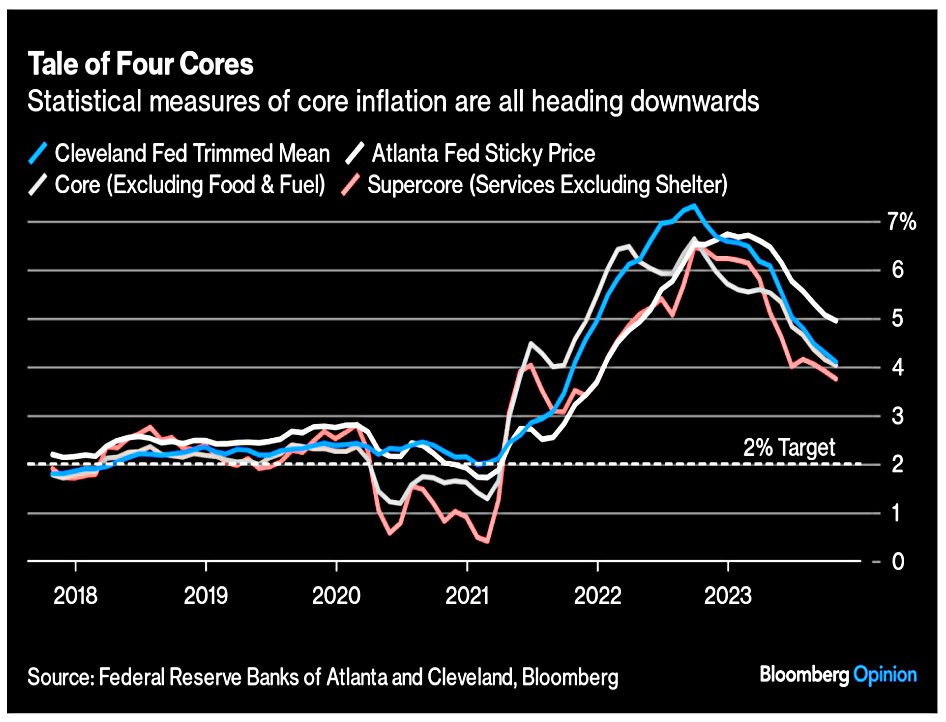
All of the main measures are looking pretty good now.
In all cases, these measures are declining slowly and remain above the 3% upper limit of the Fed’s target, but the direction of travel is clear. Also, very importantly, the supercore measure rose much less last month after a succession of ominous increases.
Supercore remains at 4.9% annualised over the last quarter.
The significance of the services sector is that costsare driven largely by wages, so sticky wage inflation could intensify as a problem.
John also notes that inflation is higher in poorer states, and lower in wealthier ones.
The bond market reaction was to be expected, as people were waiting to buy.
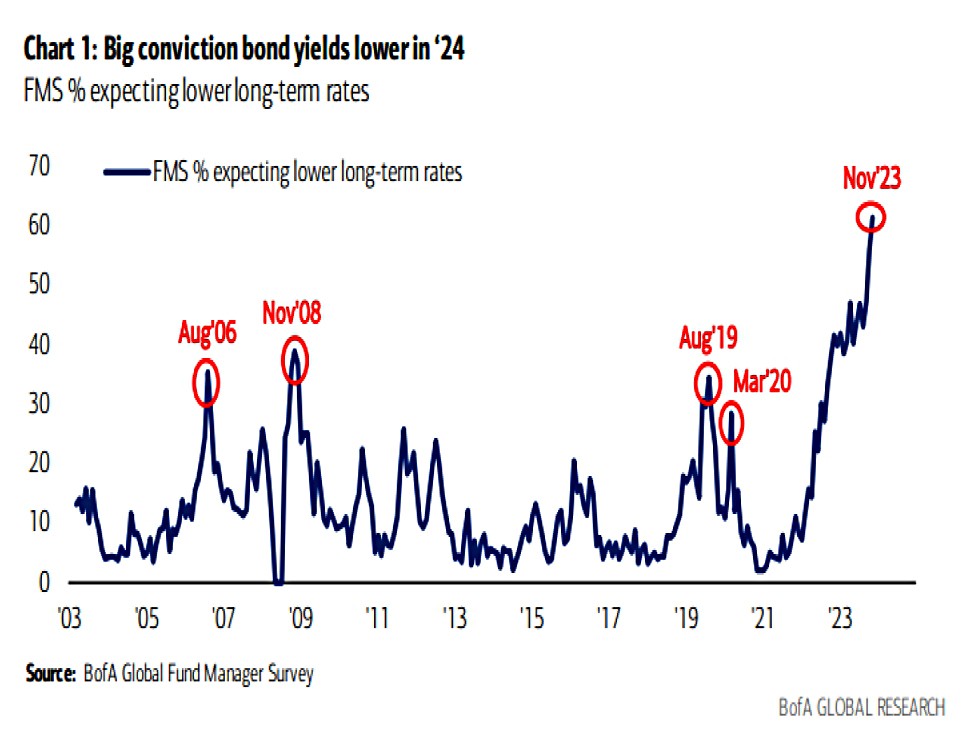
- The BoA fund manager survey published just before the inflation data had “the biggest conviction on record that long-term yields are heading downward”.
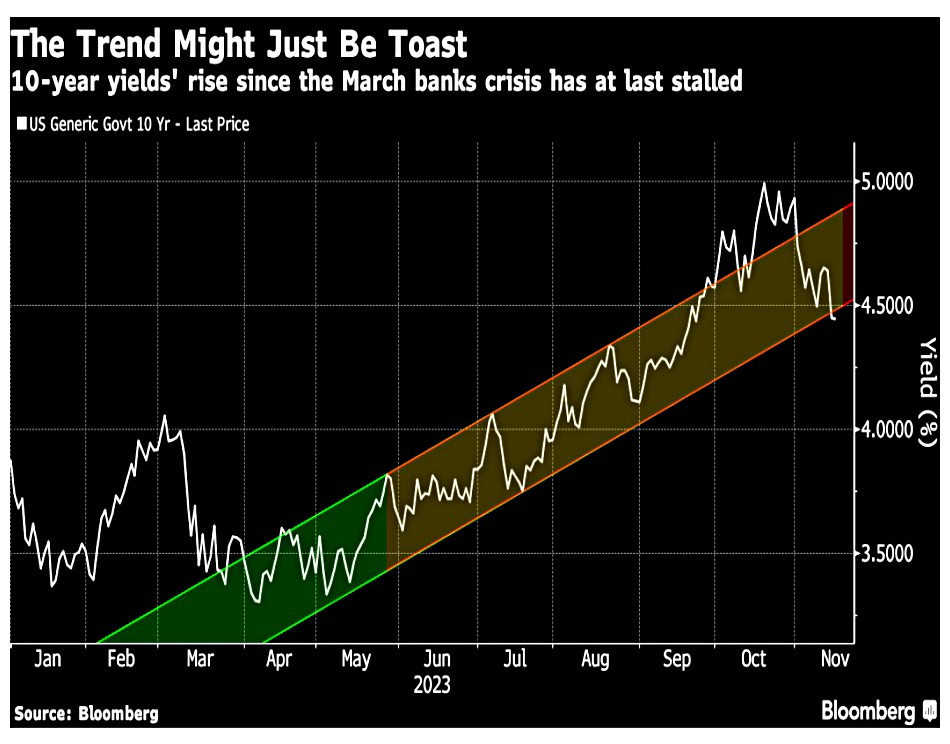
The 10-year bond has broken its upward trend.
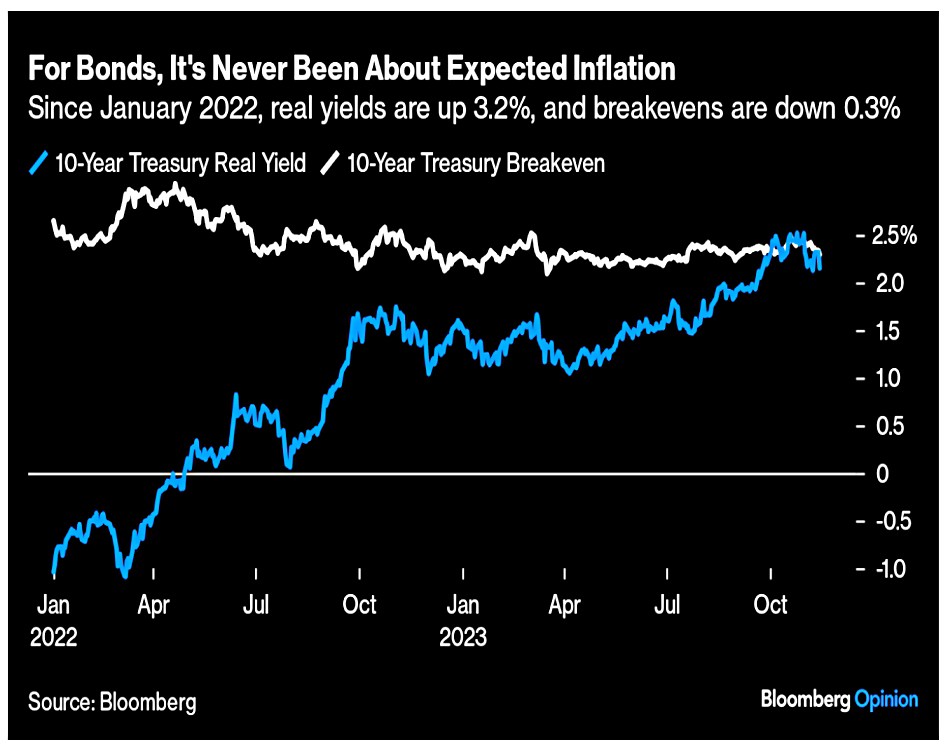
John breaks the 10-year yield in two:
The expected inflation over the next 10 years, and the “real yield” payable over and above the rise in prices. real yields have surged to more than 2% from below -1%— while the inflation breakeven, representing the bond market’s best guess, has actually fallen slightly.
How to explain this?
Confidence in the central bank to keep price rises within bounds barely ever wavered. What has changed, in a big way, is the fear of the interest rates the Fed might need to impose to get this result. That includes the fear that they take tightening too far.
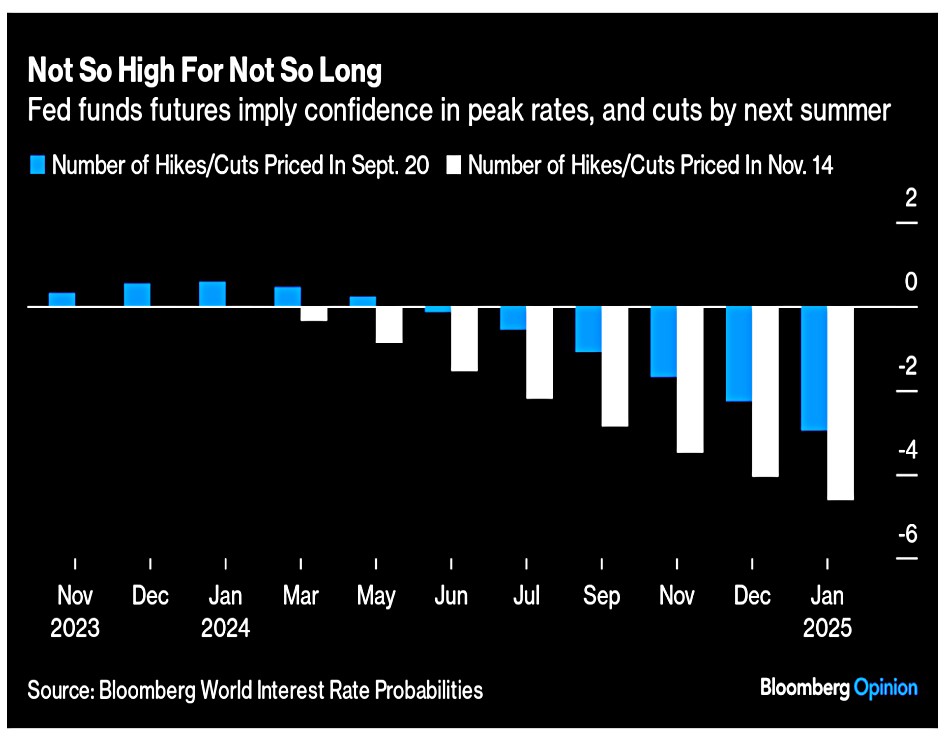
Since September, the fear of “higher for longer” has been replaced by more cuts being priced in.
- But rates are still expected to be above 4% at the end of 2024, which makes sense absent a recession (to provoke more cuts).
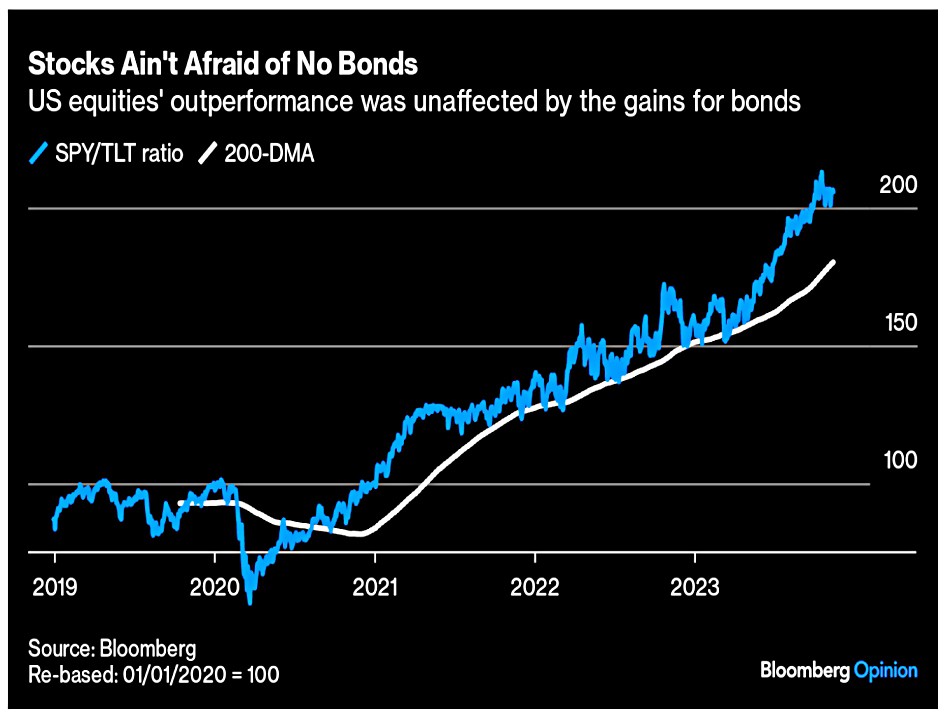
Stocks continue to do well, and to outperform bonds.
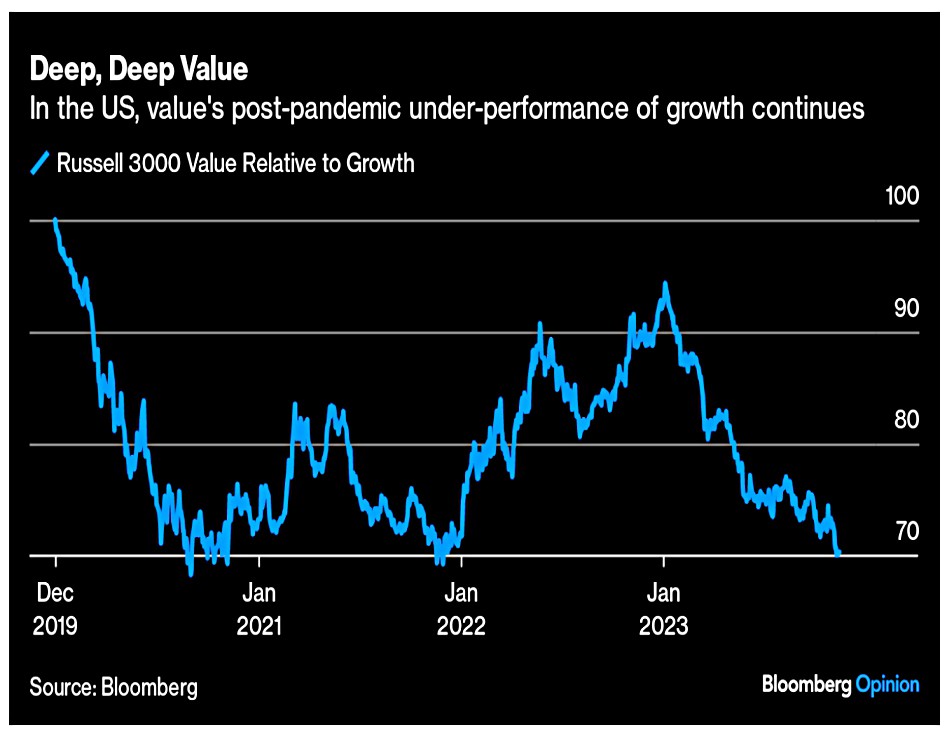
The only surprise is that value continues to underperform.
As the Fed tightened monetary policy to the most aggressive levels in decades, Economics 101 would dictate that the more sedate value stocks, with less of their value tied up in the future, should reign supreme. That’s not what happened.
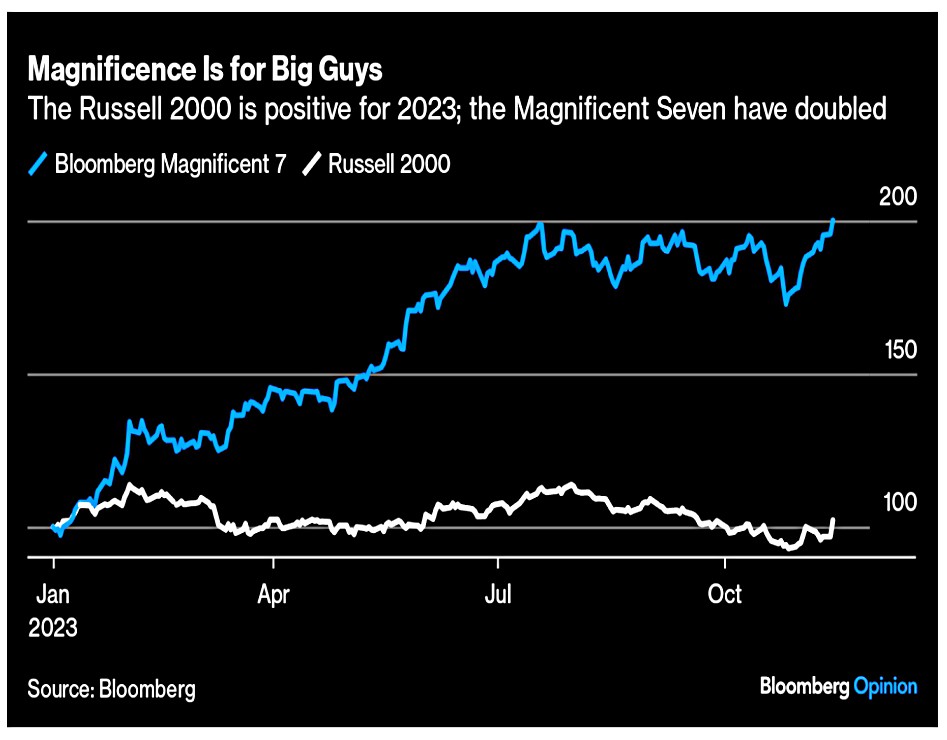
The explanation is of course the outperformance of the Magnificent Seven (which are not value stocks).
- They have now doubled since the start of the year.
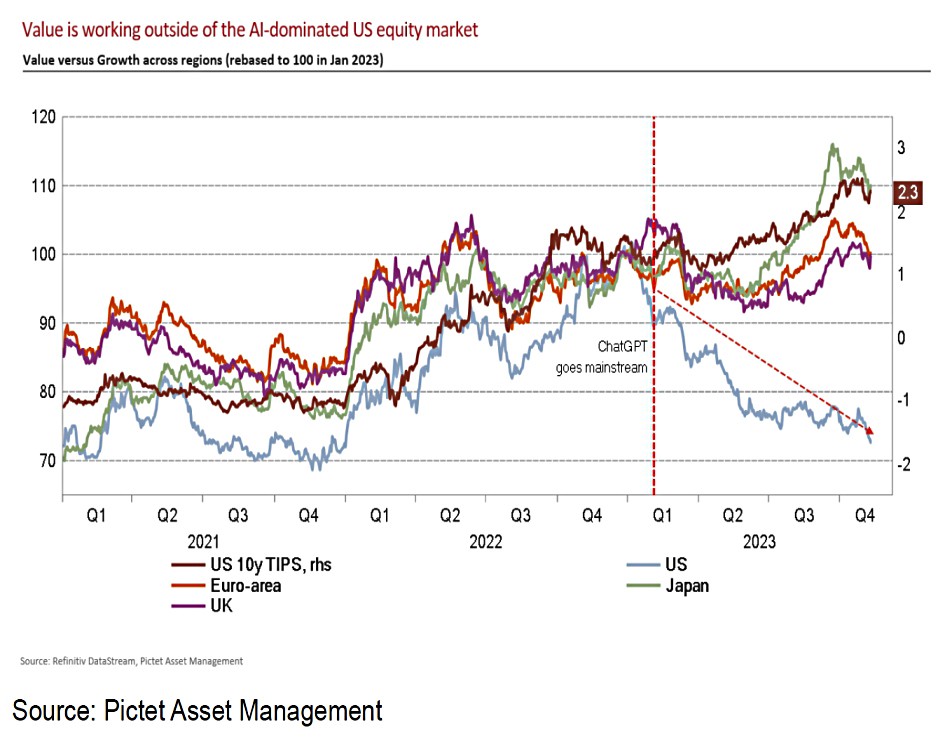
John notes that outside of the US, value is working.
- But it’s now about to lose the tailwind of rising rates.
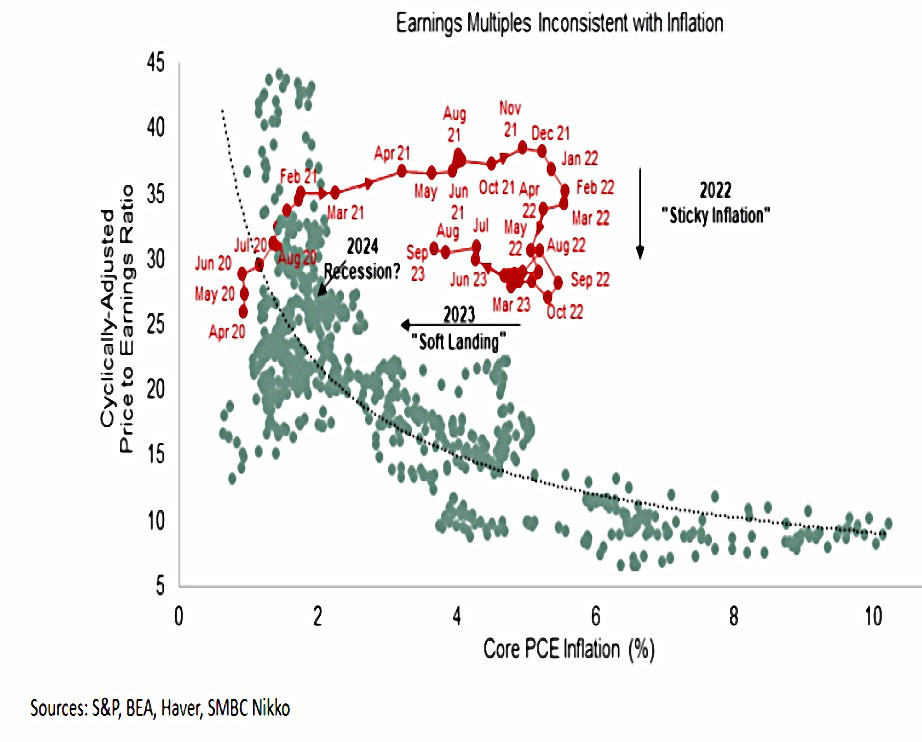
Although falling inflation should support higher earnings multiples for stocks (since lower inflation has less impact on real equity returns), multiples are currently above the curve, so they still need to fall.
- On the chart above, the red line of recent values is well above the grey curve of historical data points.
The rally of 2021 shows up asa massive outlier. Late 2021, still the top for the S&P 500, looks like madness. After that, multiples dropped as inflation rose in 2022, and this year they have moved toward the historical trend. They’ve done this relying on falling inflation.
This still leaves stock investors relying on a soft landing – a recession would hurt them.
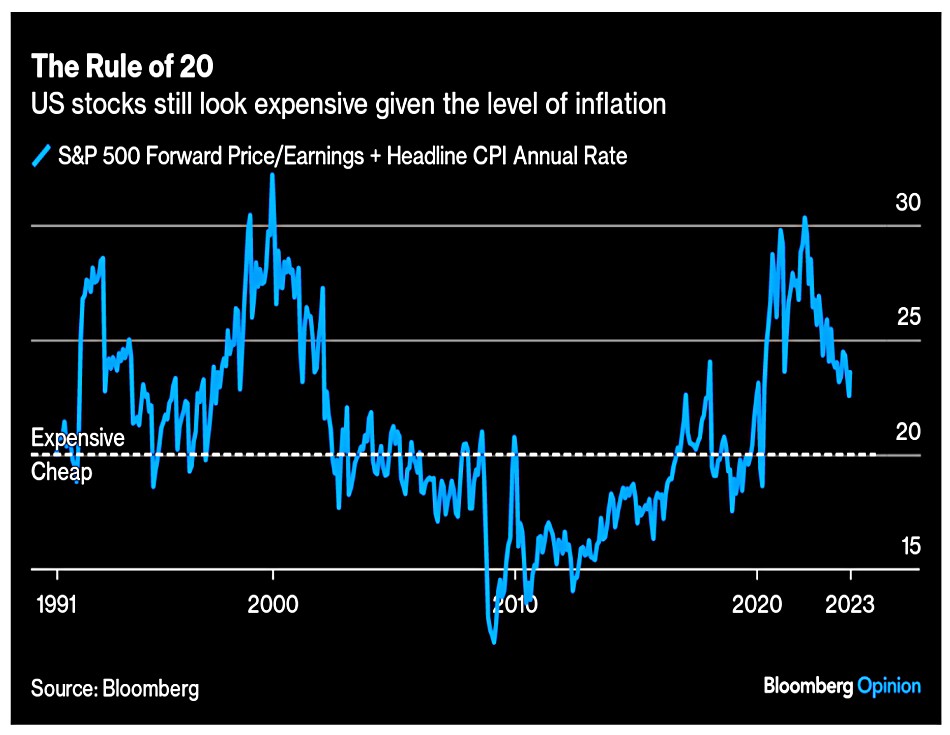
John mentions an unfashionable valuation rule:
The “Rule of20” stated that the prospective price/earnings multiple should be the number derived from subtracting the rate of inflation from 20. If these two added up to more than 20, then the market was probably too expensive.
With inflation so low for so long, people have forgotten about the rule, though it worked for buying after the 2008 crisis and selling in 2000.
- We are still above 22, so still expensive (though well past the worst numbers of the last couple of years).
Skewed returns

Joachim Klement looked at skewed returns, referencing an old post of his from 2020 that is his most popular.
Most investors start out thinking that stock market returns are normally distributed.
- Then they come across Taleb (or someone who has read Taleb) and they learn that stock returns have fat tails (extreme things happen more often than you would expect).
But returns aren’t even monomodal, i.e. they don’t just have one peak in the middle. Instead, it is easy to identify different market regimes in the return distribution.
Joachim looked at the Shiller data for the S&P 500 since 1871.
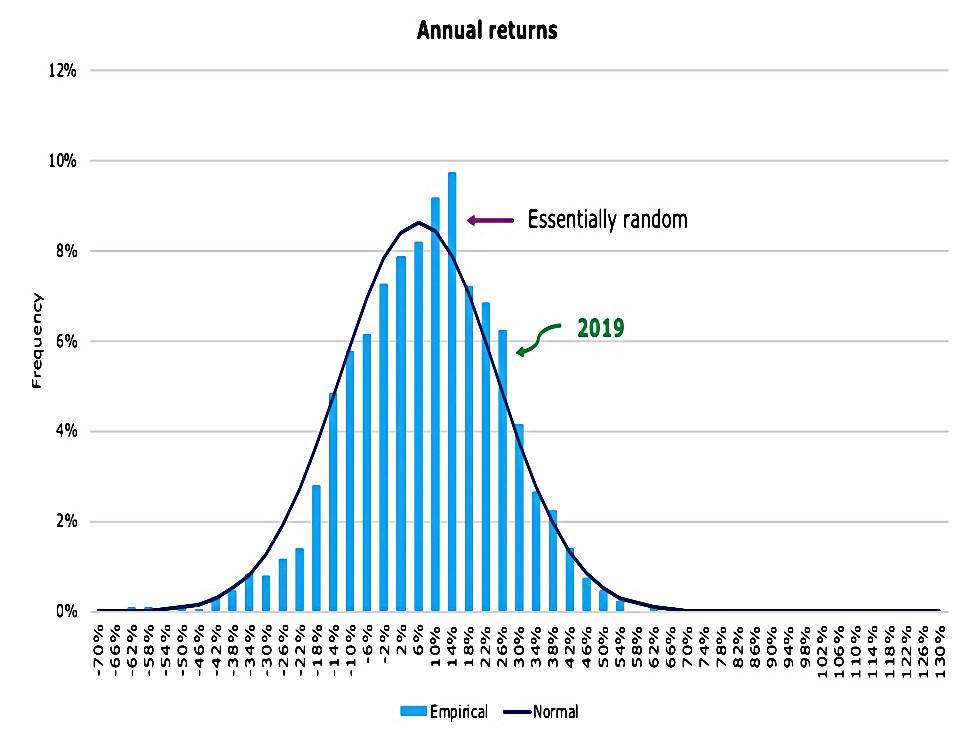
Annual returns are close to normal.
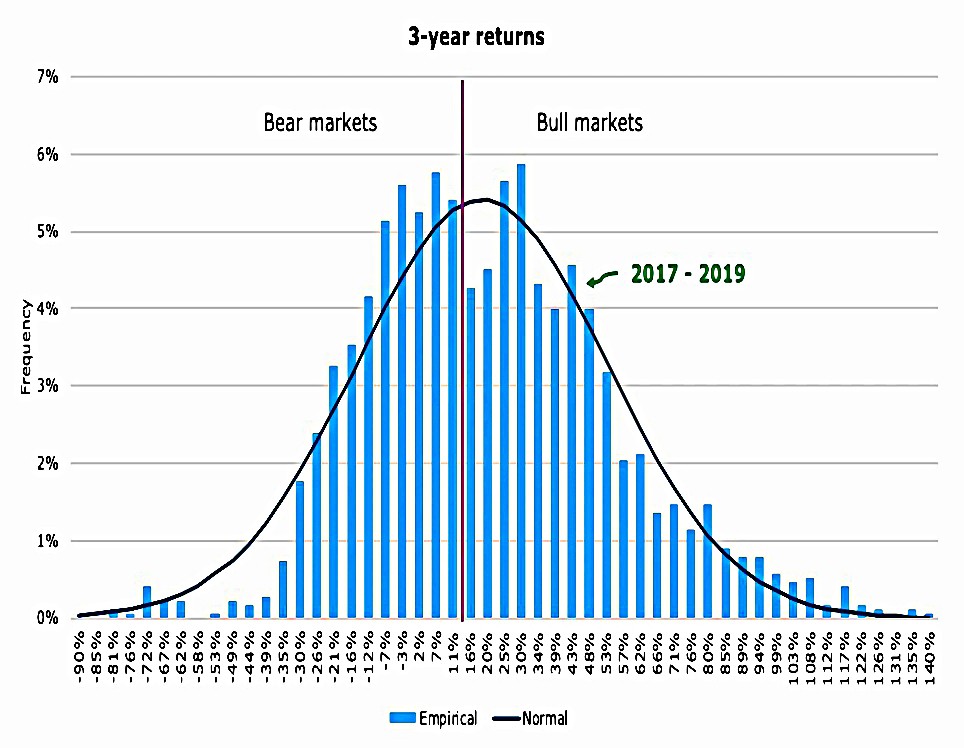
But 3-year returns are bi-modal- there’s a peak around zero and another near 30%.
- The first is a bear market and the second is a bull market (at the end of 2019 we were in a bull market).

Ten-year returns have three peaks:
- Secular bear markets like the 1970s or 2000s
- Mixed bull and bear markets, with some good years and some bad
- Secular bull markets like the 2010s
The next decade will likely be a mixed period where we experience the tail end of the current secular bull market and the front end of the next secular bear market. Because there has not been a single secular bull market in history that has lasted for two full decades. The current bull market is already the longest bull market in history.
And indeed this came to pass, albeit in an unusual fashion (via a pandemic).
- We should also note that mixed markets are not to be sniffed at – they keep up with inflation and return an average of more than 60% over ten years.
The recent article looked at a 2023 study from Antti Petajisto on individual stock returns using the CRSP database of data going back to 1926.
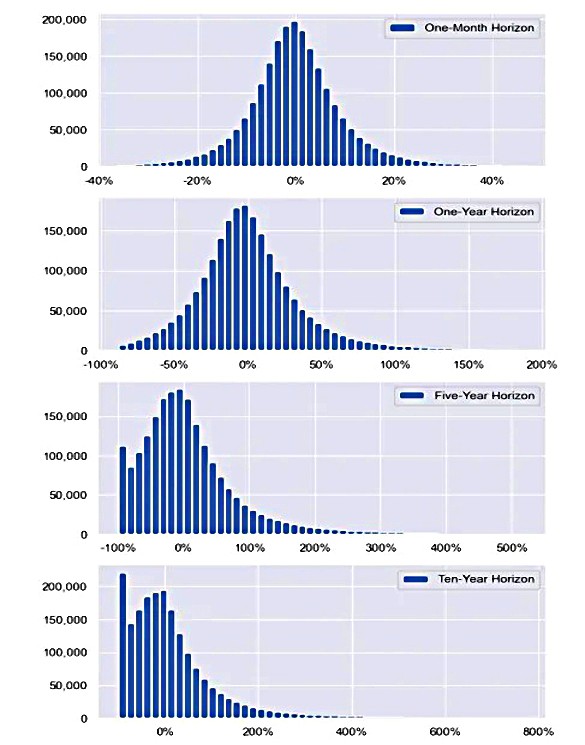
As the investment horizon increases from one month to ten years, the distribution skews to the left and the left-hand side of the curve reaches out towards total loss of capital.
This is not just the result of speculative companies in high growth sectors going bust all the time. In every sector you look, more than half of all companies have a negative return over ten years.
This means that you are more likely (55% chance) to lose money than make it from a random stock pick held for 10 years.
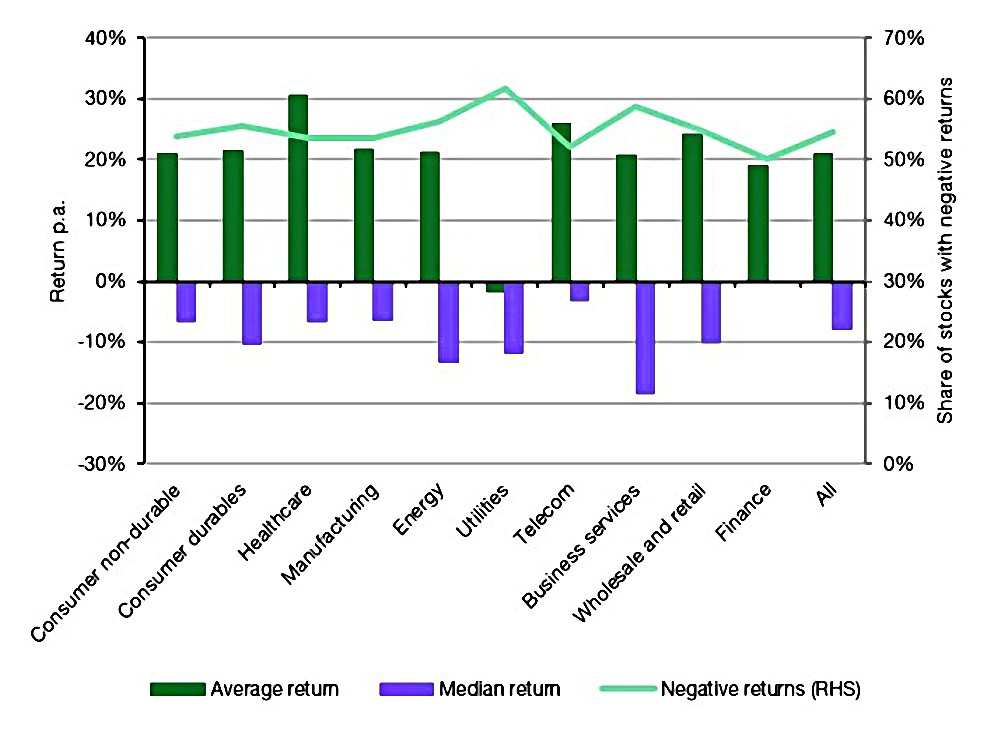
But the big winners make up for all the losses, such that all sectors show an average (mean) return of around 20% even though the median return for every sector is negative.
- This is where diversification comes in – with 20+ stocks in a portfolio, you have a decent chance of enough winners to balance out the losers.
When I was in wealth management, most clients had less than five stocks in their portfolios and household surveys confirm this. Indeed, most wealthy private investors have just one or two stocks in their portfolio and then add a few ETFs or mutual funds to the mix to diversify. But that one stock often takes up 20%, 40% or more of their wealth.
Which is obviously a bad idea when it has a 55% chance of losing money over ten years.
VCTs

It’s VCT season, so there have been a number of articles in recent weeks, mostly with the objective of drumming up business.
In the Investors Chronicle, Leonora Walters explained why now might be a good time to buy into AIM (which is possible via VCTs).
- At first glance, it doesn’t seem that way.
Aim companies face near term uncertainty because of economic reasons and the possible abolition of inheritance tax (IHT) by the Conservatives or business relief by Labour, if it wins the next election.
AIM VCTs don’t target IHT-exempt companies in the way that specialist IHT portfolios do, but most AIM firms qualify, so there is likely to be a big overlap.
- If the Chancellor abolishes IHT, then the exemption that AIM stocks provide won’t be worth anything, and their price could fall.
Apart from this threat, it looks like a good time to get into AIM:
Since August 2021, the FTSE AIM Index’s total return has fallen around 45 per cent so selected companies could be on attractive valuations if you can ride out any short-term fluctuations.
Plus of course, with VCTs, you get 30% upfront income tax relief and tax-free dividends (providing you invest in a new fund-raise).
Nicholas Hyett, from leading VCT broker Wealth Club, said:
Underlying operating performance is good but the appetite for Aim shares has dropped off so it’s [arguably] an attractive time [to invest].
Jason Hollands, MD of rival Bestinvest said:
There’s a lot of pessimism and disinterest priced in, which should provide some opportunities for those prepared to invest while this market is so unloved. Predators [may] start snapping up companies at premiums and Aim could be a beneficiary of commitments made by pension schemes in the Mansion House Compact to allocate more to early-stage growth companies.
More on VCTs next time.
Stamp Duty

In FT Adviser, Tom Dunstan looked at a report from the Coventry Building Society which found that stamp duty in London is 365 times higher than in the East Midlands.
Stamp duty on an average priced home in London was £14,279, the highest of any area in the UK. Meanwhile, stamp duty for a similarly average priced property was reported to be just £40 in the East Midlands.
For Coventry, Jonathan Stinton said:
Rumours have started swirling that stamp duty changes are on the horizon, with announcements to be made during the Autumn Statement. These changes can’t come quickly enough. Homebuyers across the country aren’t being treated equally, and that needs to be addressed.
By looking at average houses in each area the study grossly underestimates the real disparity.
Price ranges in London are many times larger than in the rest of the country and as we have seen, the median is not the mean.
- The stamp duty payable on the (Zone 1) property I would like to buy is close to double the price I paid for my current (Zone 2) home.
Stamp duty is one of the worst taxes, discouraging the transactions on which it is levied, and in particular, gumming up the top end of the property market.
- I hope the Chancellor abolishes it in the Autumn Statement later this week.
Quick Links
I have five for you this week, the first two from Alpha Architect:
- Alpha Architect looked at The Magnificent Seven
- And asked Is Inflation Ever Going to Go Down?
- The Economist watched as Netflix takes a swing at live sport
- Discipline Funds asked Can the Fed Finally Declare Victory?
- And Of Dollars And Data wondered How Safe is an 8% Withdrawal Rate?
Until next time.
Mike Rawson
Mike is the owner of 7 Circles, and a private investor living in London. He has been managing his own money for 40 years, with some success.