The Buffett Indicator
Today’s post is about the Buffett Indicator, also known as the Buffett Yardstick.
Contents
The Buffett Indicator
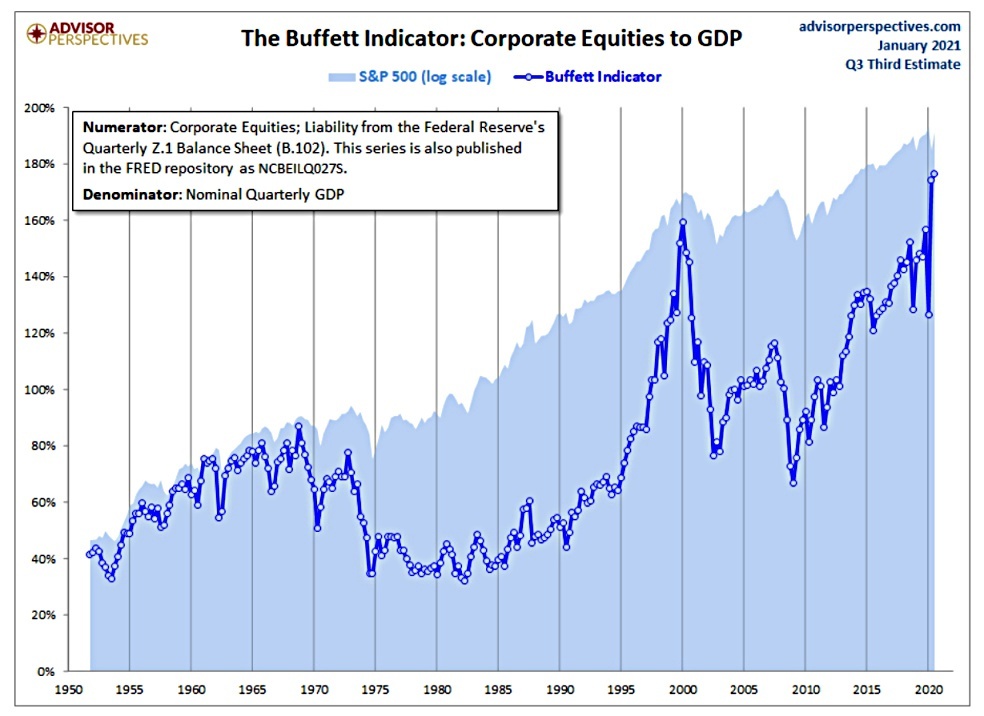
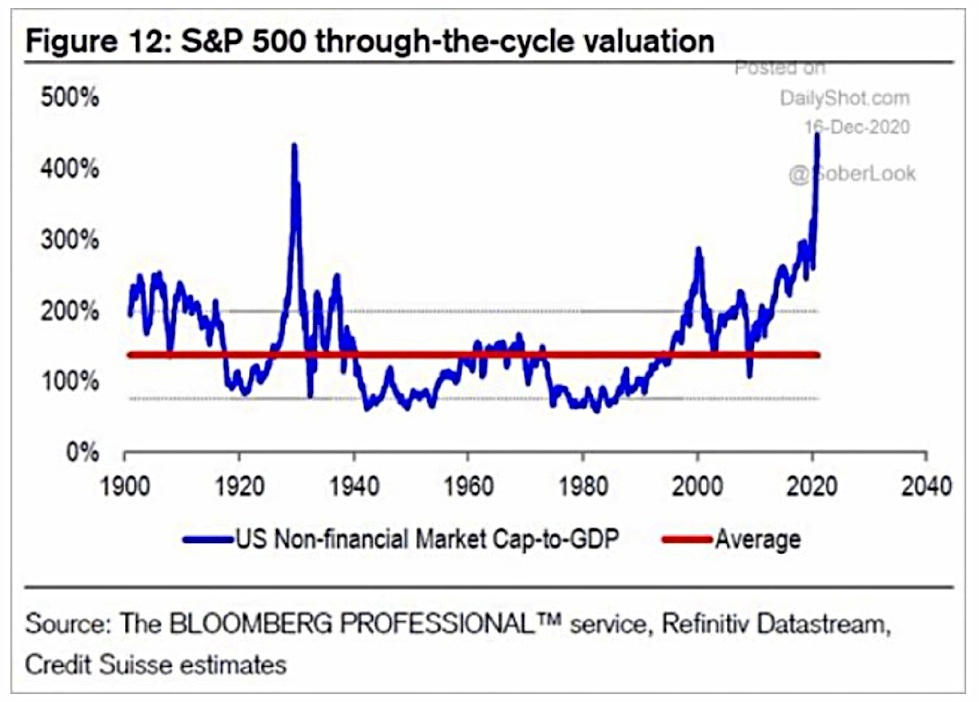
The Buffett Indicator, also known as the Buffett Yardstick, compares the value of the stock market to the size of the economy – market cap vs GDP.
- It’s a value measure – a version of Price/Sales at the country/region/global level.
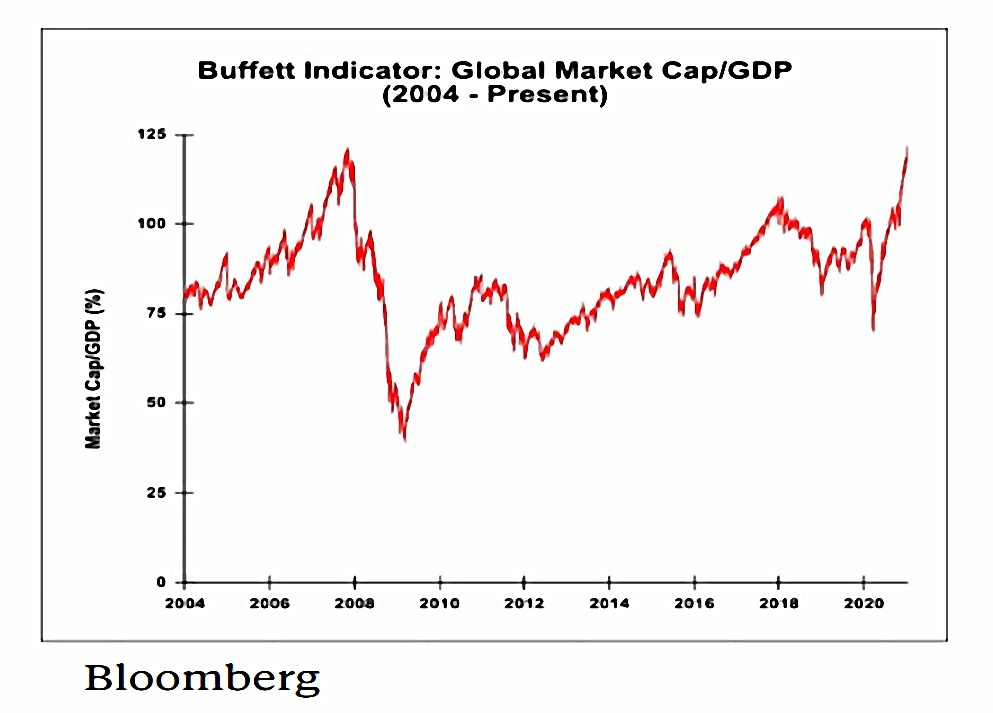
I’ve been meaning to write about this indicator for some time, but this is as good as time as any – a few weeks ago the measure reached its highest value (in global terms) since the 2008 financial crisis.
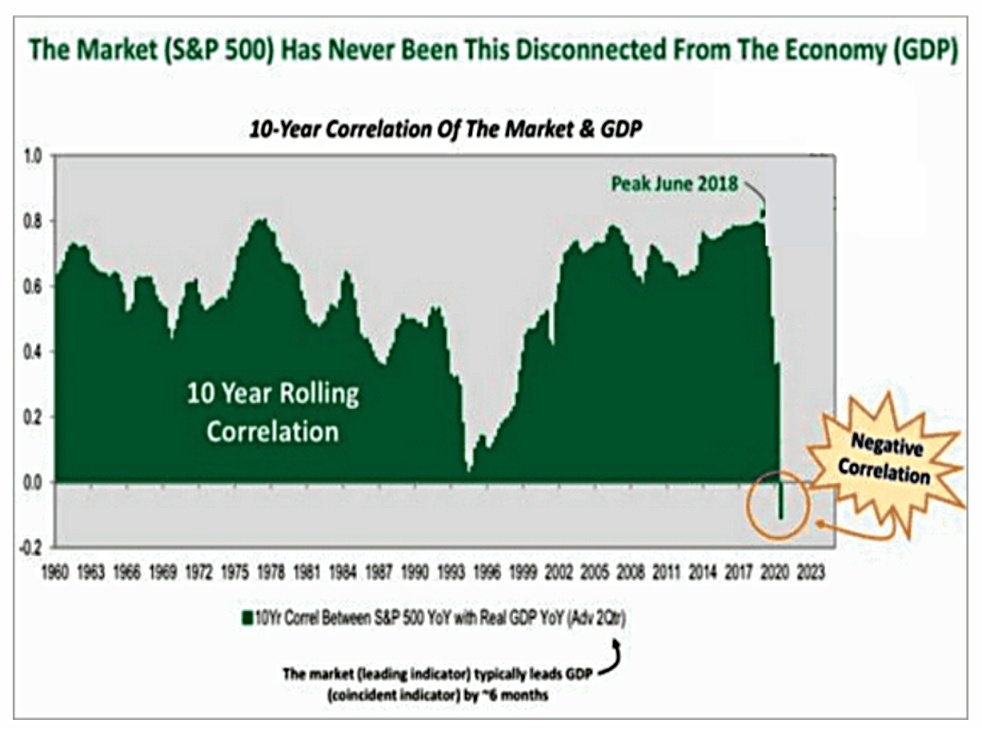
Which is due in part to the disconnect between the market and the economy since the Covid shock.
The underlying data for the Buffet Indicator runs back to 1947 when US quarterly GDP was introduced.
- It got its name when Warren said in a 2001 Fortune Magazine interview:
It is probably the best single measure of where valuations stand at any given moment.
More importantly, it gives you some idea of what to expect from equities in the future.
- To be clear, it is a long-term rather than a short-term indicator, as per the Shiller CAPE.
Both indicators work on the basis that if you pay a high price at the start, your future returns will be limited.

The chart above plots the inverse of the Buffett Indicator (henceforth the BI) against the forward 10-year stock market returns.
- The implication is that in recent years, investors in stocks have been paying so much that their expected returns are zero – or even negative.
Sentiment
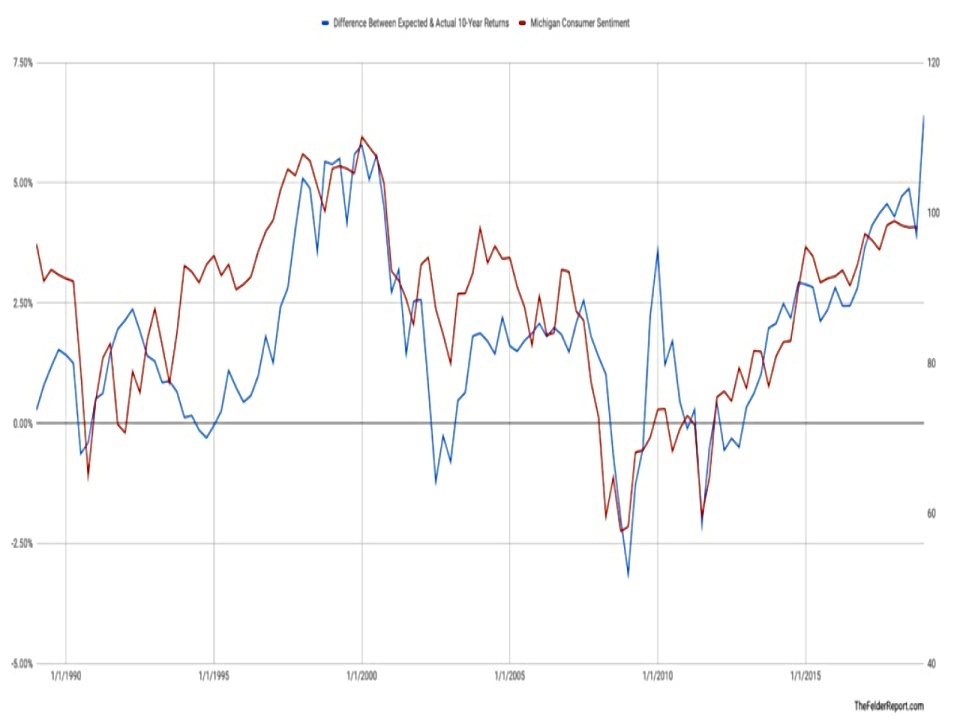
Jesse Felder sees the difference between the actual and forecast returns as investor sentiment.
- The chart plots this difference against the Michigan Consumer Sentiment index.
According to Jesse:
It’s pretty clear to see that excess returns can almost entirely be explained by optimistic sentiment.
Coupled with a higher current excess than during the dot com boom, it seems that the longest (and, excepting the Covid bump in 2020, the least volatile) bull market in history, has produced a serious episode of euphoria.
Risk
Since the mechanism for the delivery of low stock returns usually involves a market crash, this low return signal also equates to a high-risk signal
- One measure of market greed is the level of margin debt.
Even the most circumspect friend of the market would concede that the volume of brokers’ loans—of loans collateraled by the securities purchased on margin—is a good index of the volume of speculation – John Kenneth Galbraith, The Great Crash 1929
Lots of margin debt signals greed, not fear.
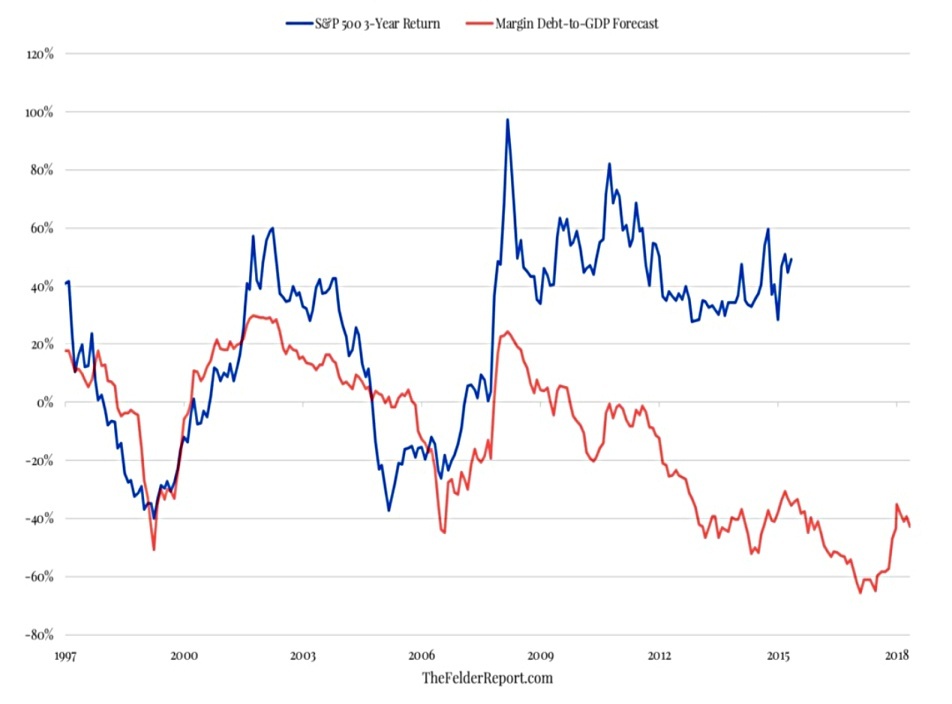
Jesse compared margin debt to GDP to produce an alternative forecast for stock returns shows that there is plenty of greed around:
Investors haven’t been this greedy in many decades – since 1929, in fact. All of this leveraged speculation must at some point be unwound, usually via forced selling during a bear market. The last two times it came even close to the current level the stock market suffered 50% declines.
Which makes the risk to reward pretty poor:
Because the recent peak in leveraged speculation relative to the economy
surpassed the prior two it is possible the next decline in the stock market could be even deeper than those previous two. Investors are risking roughly a 60% decline to try to capture a 0% rate of return over the coming decade, one of the worst risk-to-reward setups in history.
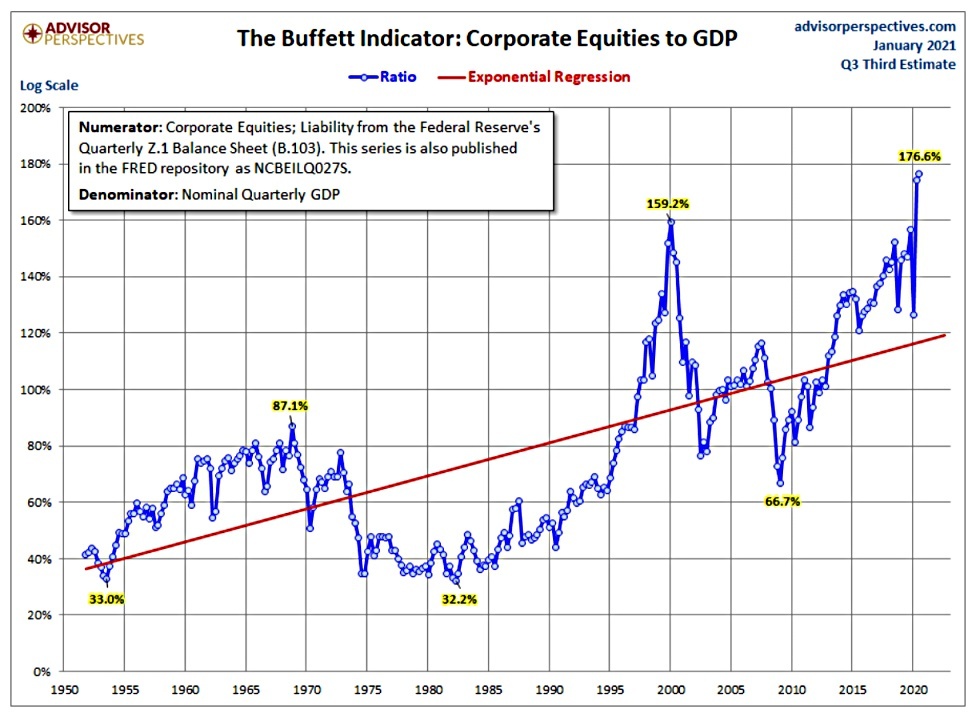
Variants
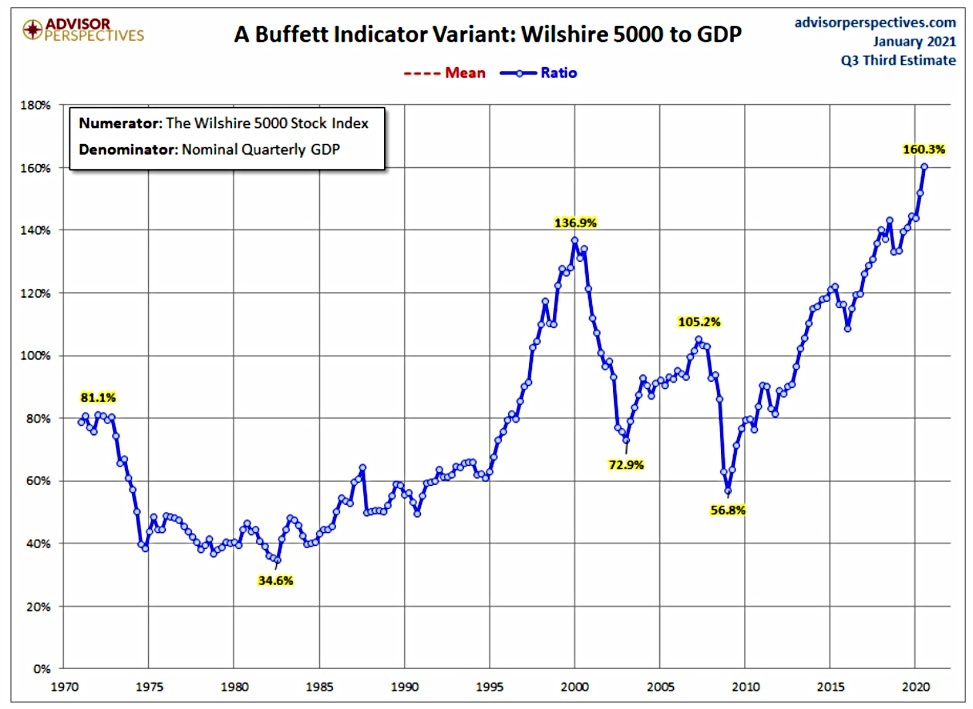
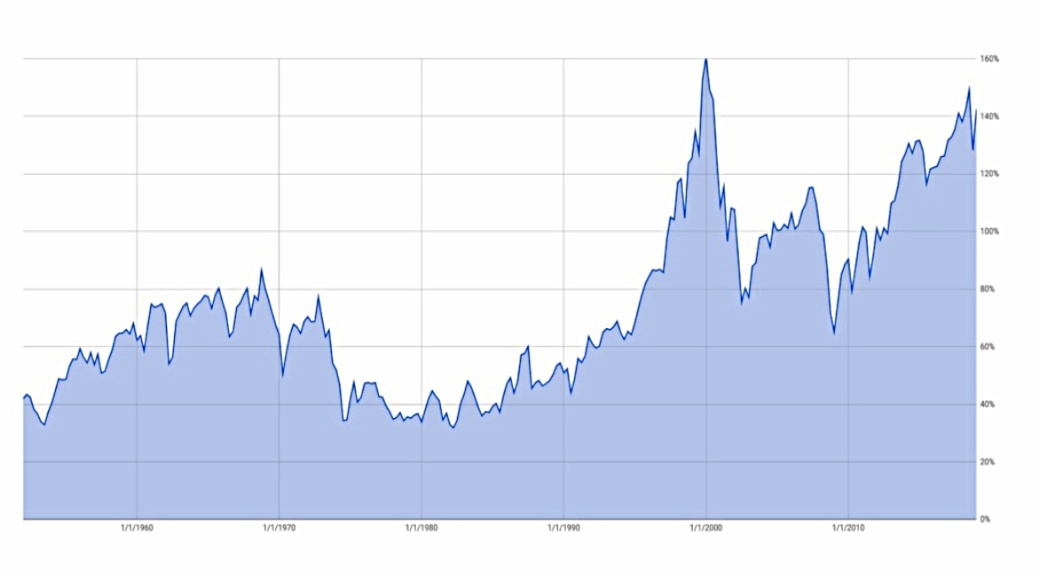
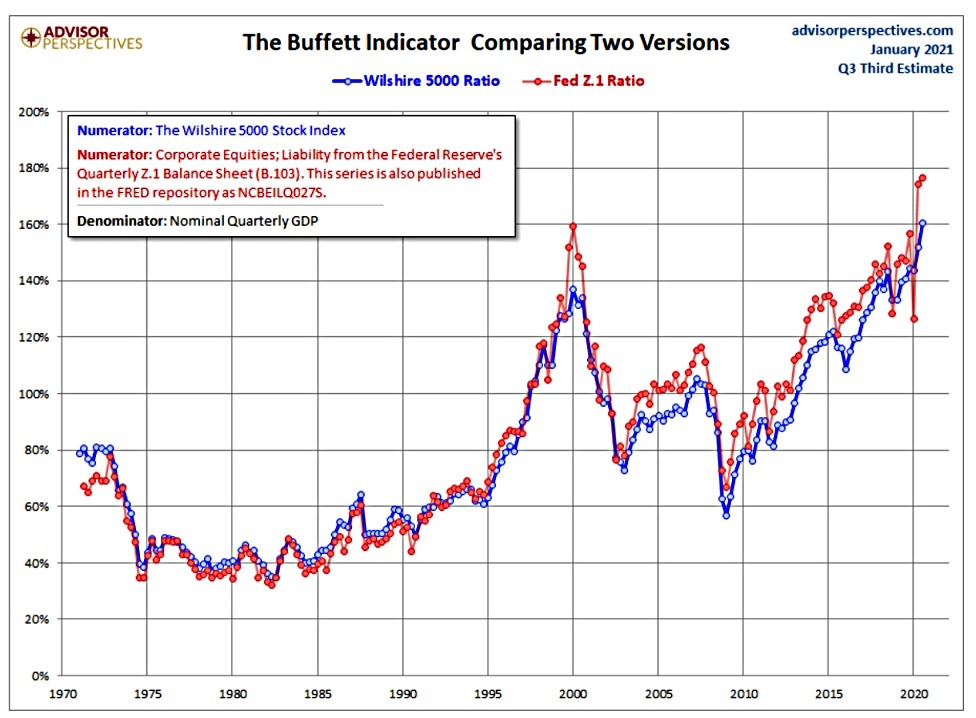
Advisor perspectives provide a variant based on the Wilshire 500 index:
The Wilshire Index is a more intuitive broad metric of the market than the Fed’s rather esoteric “Nonfinancial corporate business; corporate equities; liability, Level”
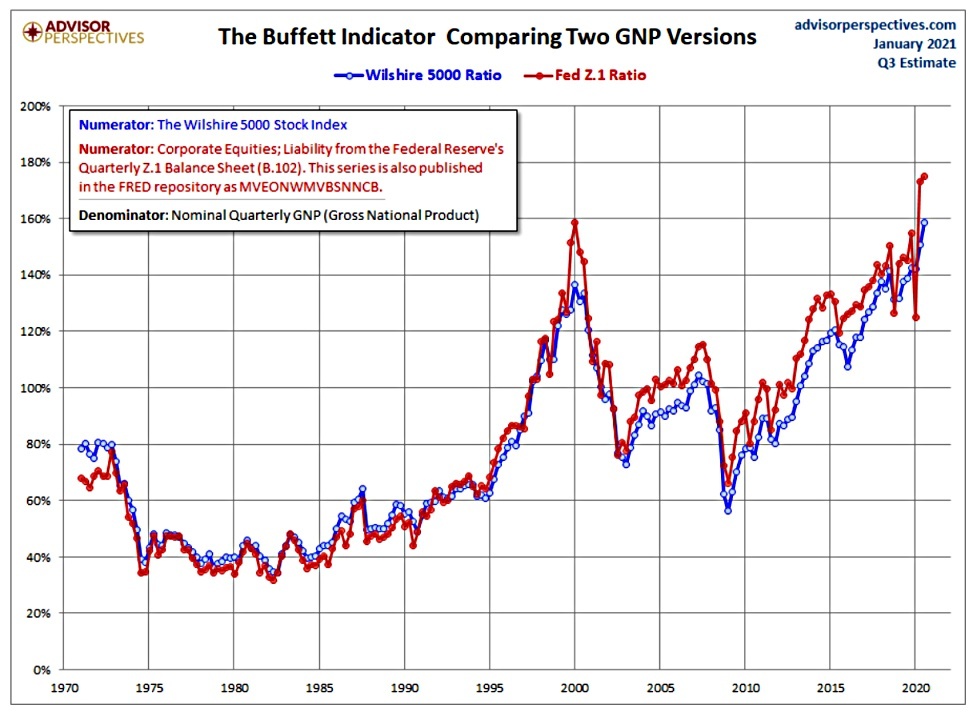
It doesn’t make much difference.
Nor does substituting GNP for GDP.
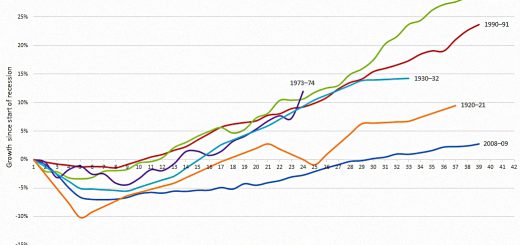
Detrending
It’s noticeable that the BI increases over time.
- So Advisor Perspectives went to the trouble of detrending the data by calculating a linear regression (shown in the first chart at the top of the post) and then subtracting this from the BI value.
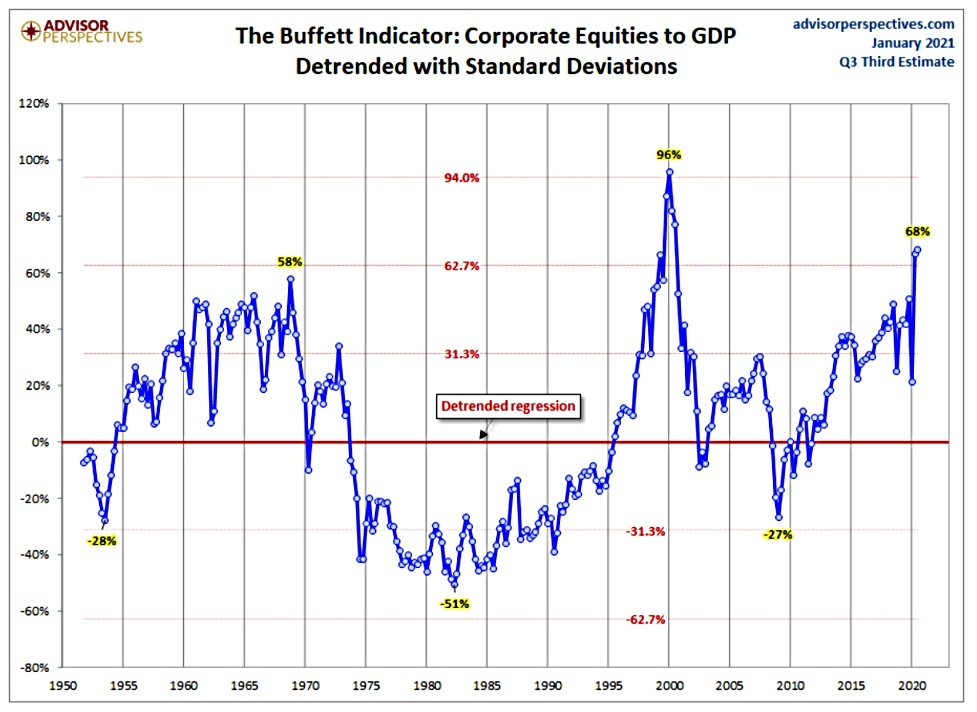
Now the BI looks high but not so high as in 2000.
Critiques
Apart from the way that the BI trends up over time, the basic conceptual issue is that “price/sales” ignores the profitability of the companies which make up the index in question.
- The degree to which companies are incentivised to IPO (as opposed to remaining private) also has an impact (though obviously, recent trends in this area would have worked to reduce the BI).
Humble Student of the Markets (HSOTM) set himself the task of debunking the Buffett Indicator.
He notes that Charlie Munger is sceptical about the BI:
Just because Warren though of something twenty years ago, it does not become a law of nature. There is no natural correlation between the two [GDP and corporate profits].
HSOTM points out that PE is generally preferred to prices/sales.
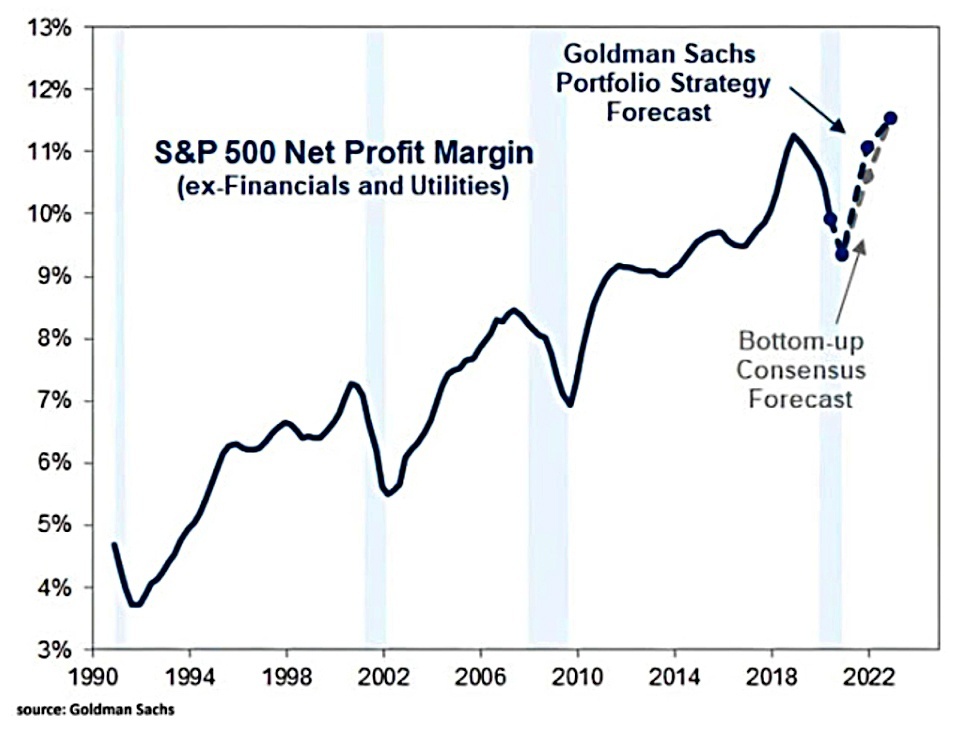
- PE is really price/(sales * net margin)
- Net earnings = (gross earnings – interest) * (1 – corp tax rate)
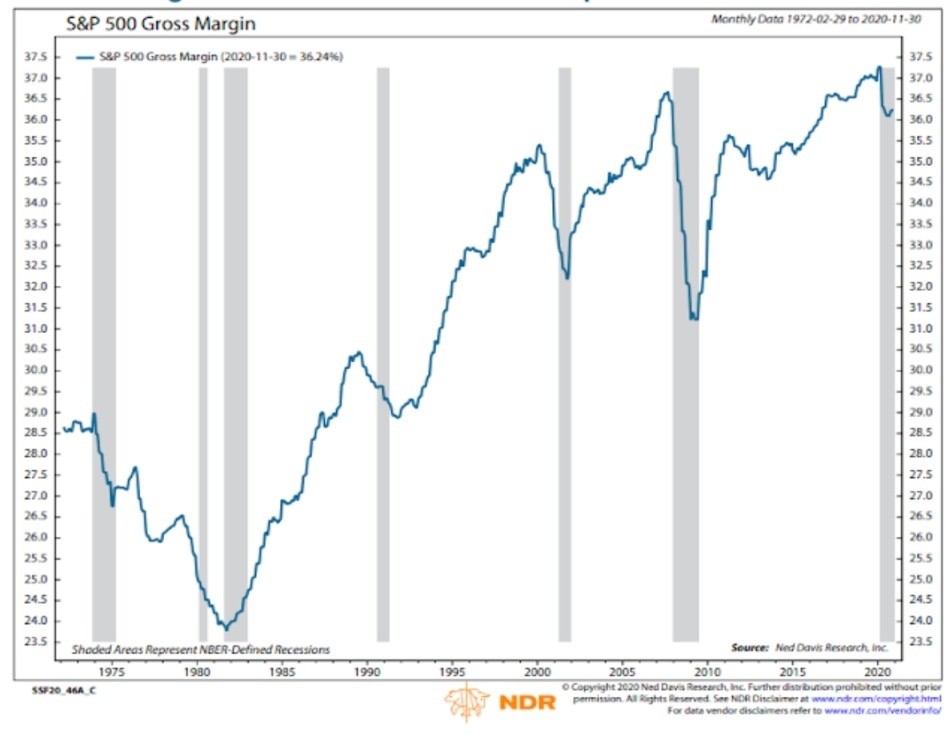
Both interest rates and corporate tax rates have been falling significantly, so gross margins have risen.
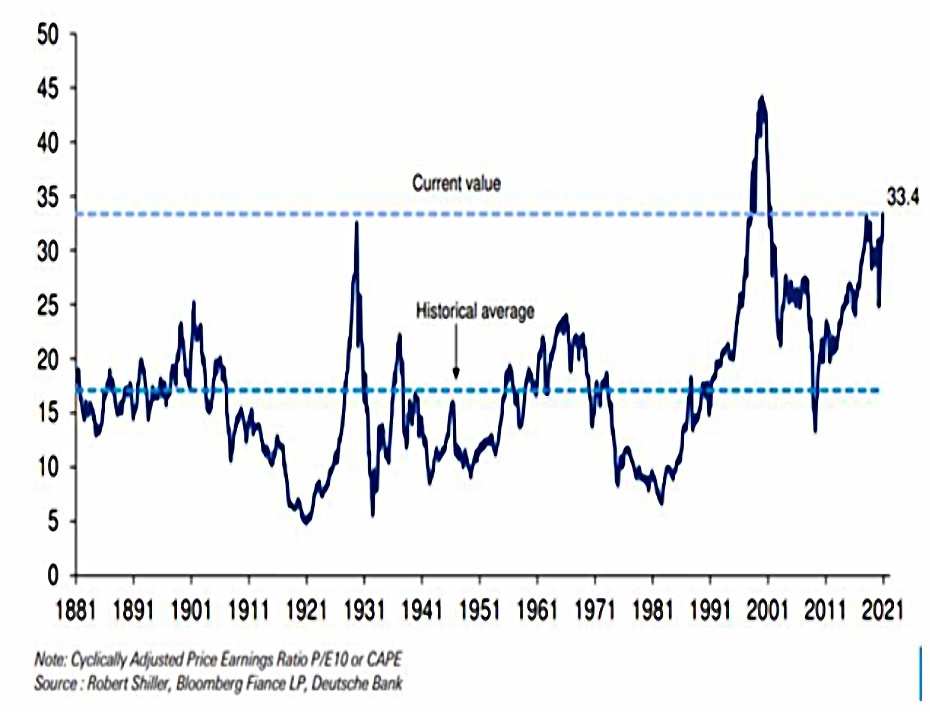
A recovery in profit margins will therefore provide support for elevated PEs, but they remain high, as evidenced by the CAPE – which at 33 is predicting zero real returns over the next decade (in the US):
Interest rates and ECY
But Schiller himself has warned that interest rates and bond yields also need to be considered:
The ECY considers both equity valuation and interest-rate levels. We invert the CAPE ratio to get a yield and then subtract the ten-year real interest rate. This measure is somewhat like the equity market premium – a higher measure indicates that
equities are more attractive.
When Shiller said this, the US ECY was 4%.
- The CAPE yield was 3%
- The 10-year average inflation rate was 2%
- The nominal 10-year yield was 1%
So the ECY calculation was 3% – (1% – 2%) = 4%.
Shiller continues:
The ECY is close to its highs across all regions and is at all-time highs for both the UK and Japan. The ECY for the UK is almost 10%, and around 6% for Europe and Japan. China’s ECY is somewhat elevated, at about 5%. This indicates that, worldwide, equities are highly attractive relative to bonds right now.
So the CAPE – like the BI – shows that stocks are expensive, but the ECY shows that they are cheaper than bonds.
The Fed model

The Fed model also uses an equity risk premium.
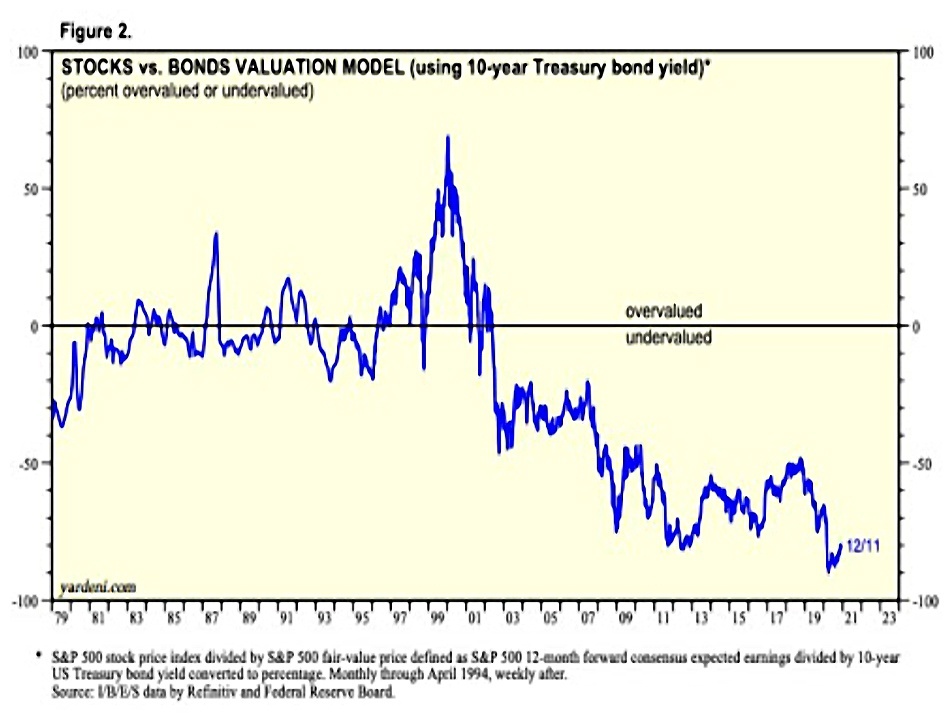
Which again makes stocks look cheap.
HSOTM concludes by comparing the (inverted) BI to the long-term decline in interest rates:
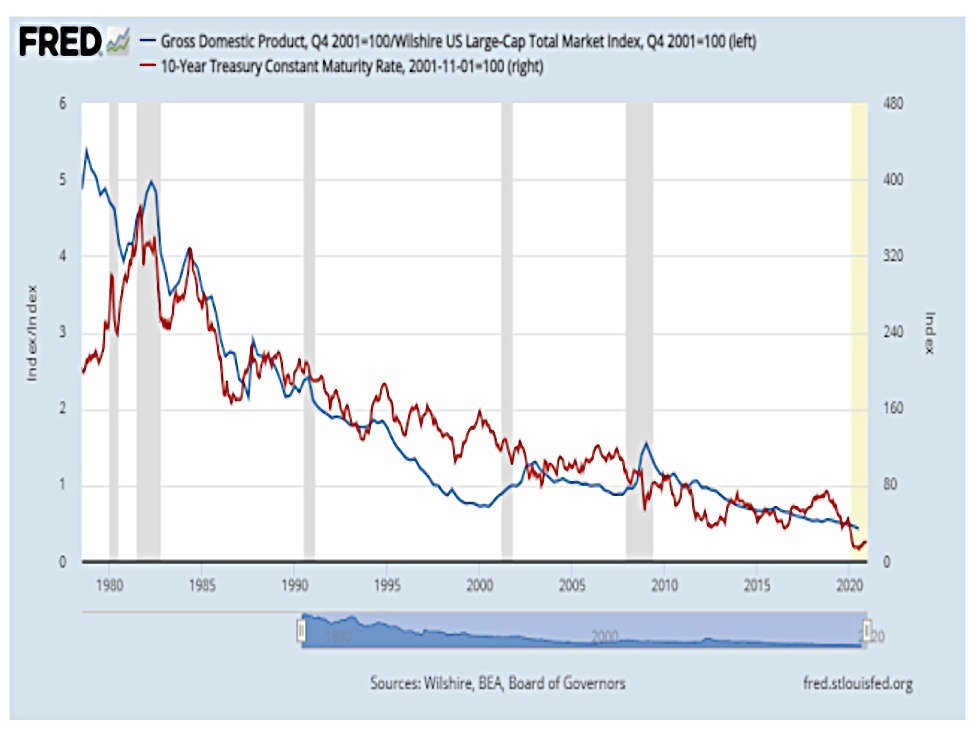
He says:
Concerns about valuation are overblown. Stock prices are not overvalued in light of the low rate environment. While low rates can be a risk factor over the long-term, they are not a problem over the next few years.
Sources
- This is what true contrarian value looks like – The Felder Report
- How The Buffett Yardstick Shows Both ‘Sky-High’ Stock Market Valuations And Investor Sentiment – The Felder Report
- An Updated Look at the Buffett Valuation Indicator – Advisor Perspectives
- Debunking the Buffett Indicator – Humble Student of the Markets
- Why investors are walking into a trap – Seeking Alpha
- The Buffett Indicator Revisited – Navin Vohra, CFA Institute blog
Mike Rawson
Mike is the owner of 7 Circles, and a private investor living in London.
He has been managing his own money for 40 years, with some success.