The Hurst Exponent
Today’s post looks at the Hurst Exponent, which is a measure of how strongly a data series is trending.
Hurst Exponent
Many of the most common active trading strategies are based on momentum (a continuation of the relatively recent past) or mean-reversion (to a long-term average).
- The Hurst Exponent helps us to (automatically) decide which kind of strategy is the most appropriate for a particular market.
I came across the Hurst Exponent (HE) from a couple of articles on Medium. (( References below ))
- The focus of these notes was how to code the HE in Python, but we won’t be getting into that today.
The posts also contained a fair bit of maths, which we will also sidestep.
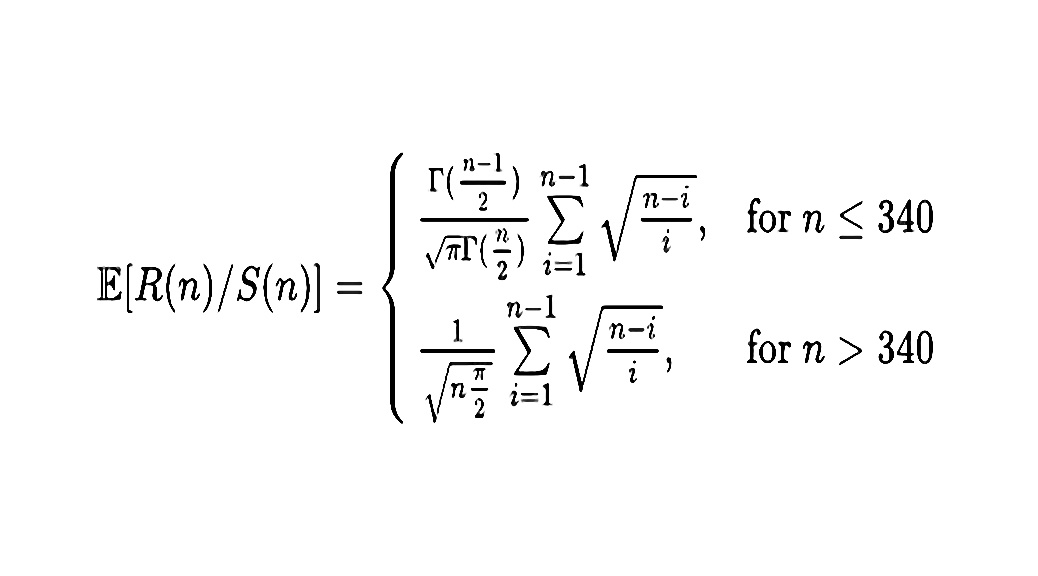
- The featured image above shows the formula for the HE from Wikipedia, and below I show the formula used in one of the articles.
Luckily, we don’t need to understand these formulae.
- All we need to know is whether the HE is saying that a market is trending, mean-reverting, or just random.
The Hurst Exponent was invented by the British hydrologist Edwin Hurst in the middle of the last century.
- It was developed to estimate the volume of water in a river but was later adapted to financial markets by people like Benoit Mandelbrot, the king of fractals.
The HE is bounded in the range of zero to 1:
- When HE > 0.5, the time series tends to move in a single direction
- When HE = 0.5, the series oscillates
- When HE < 0.5, the series is random.
Calculation
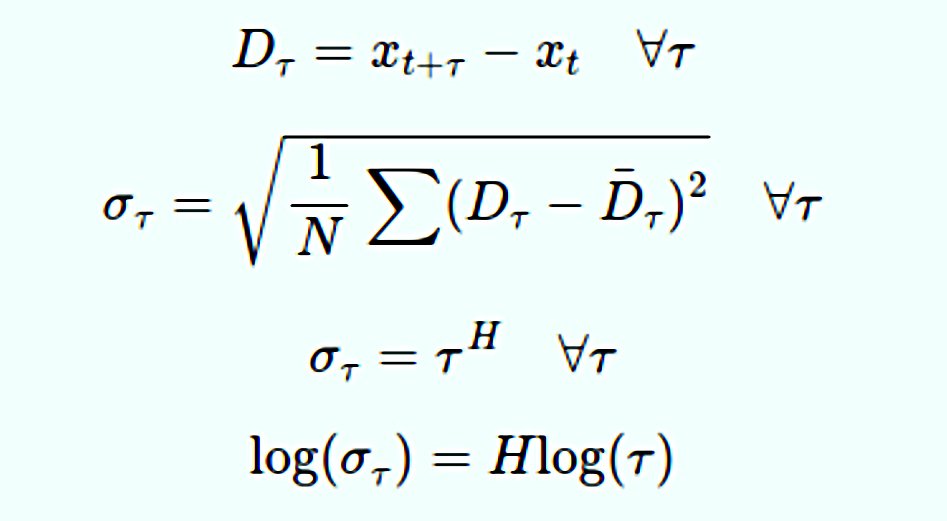
HE is calculated by measuring the rescaled range – a statistical measure of variability – across multiple time periods, and then plotting the data on a log-log plot.
- The slope of the line is the HE (usually written as H).
You can also use a technique called detrended fluctuation analysis (DFA).
Ignoring the math, we look at the change in price over a series of time differences (called lags).
- The log of the standard deviation of the lags is plotted against the log of the lags.
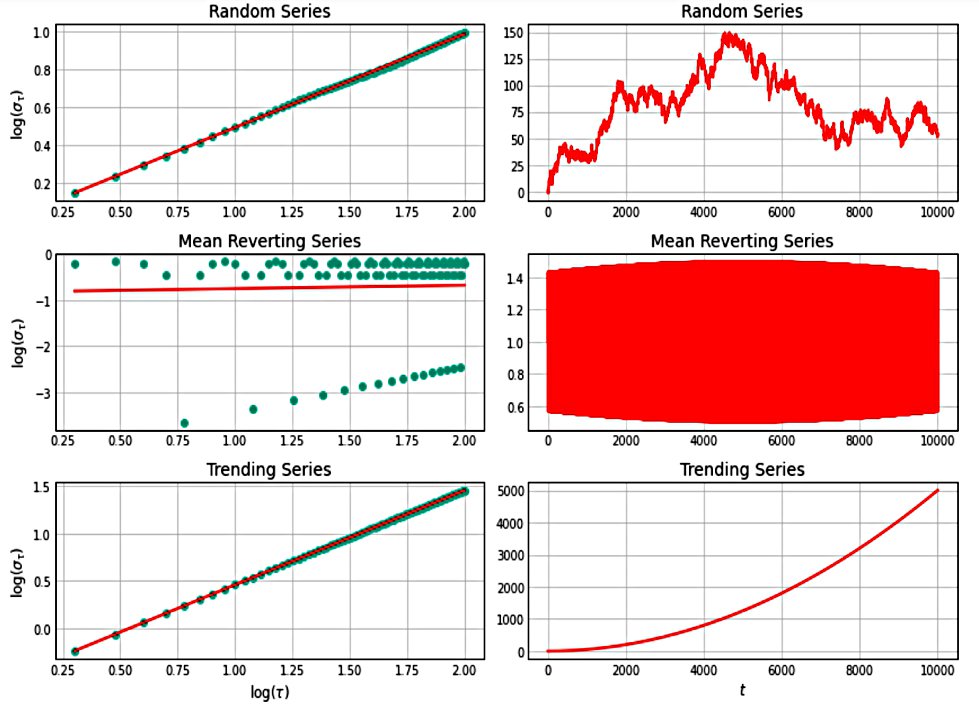
The log-log plots are on the left.
- The random and trending series are clear enough, but the mean-reverting one is messy.
The key point is that the slope is positive and less than 0.5.
FX
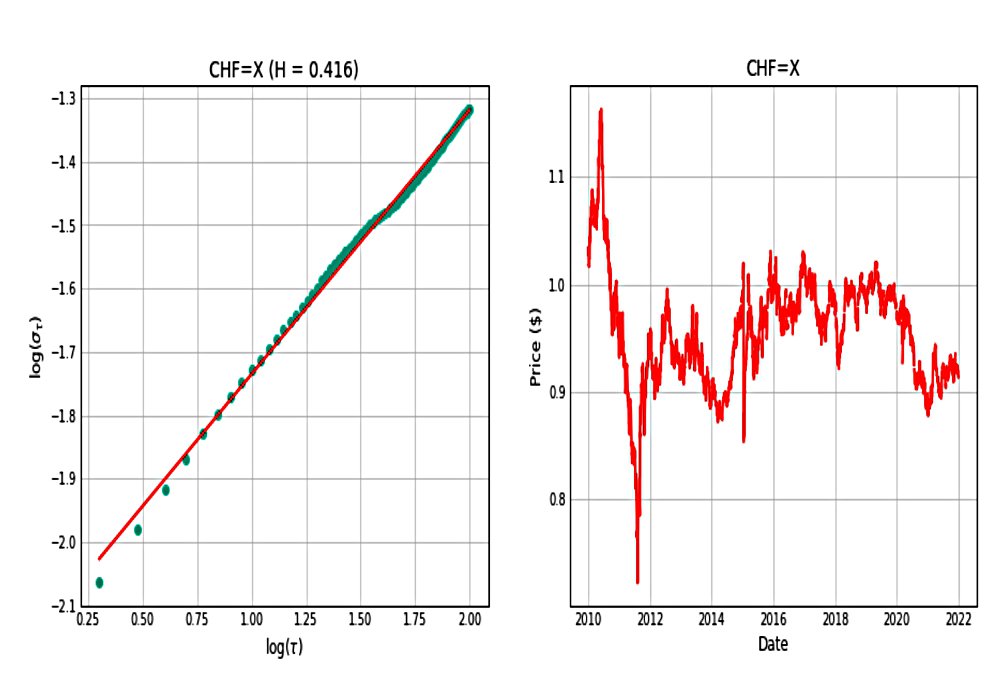
The chart above is the Hurst for USD/CHF.
- Currency pairs in general are mean-reverting and particularly those between two strong currencies.
But the dots are below the trend line at the short end.
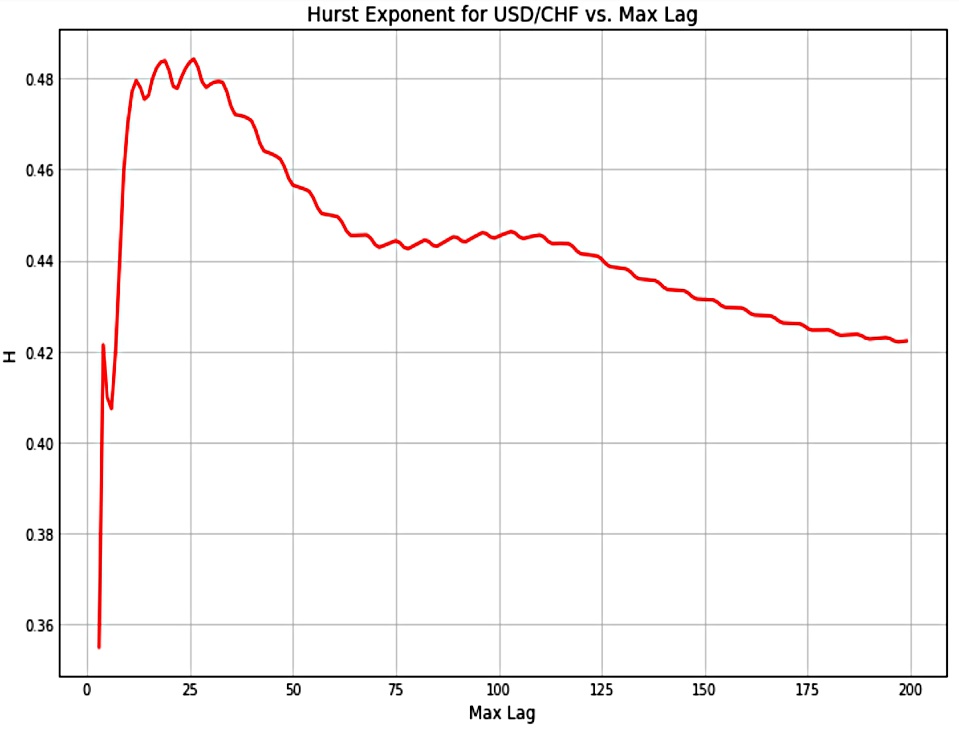
The H never quite gets to trending levels, but it does become more mean-reverting at around 60+ days, so mean-reversion strategies longer than that should work best.
Bitcoin
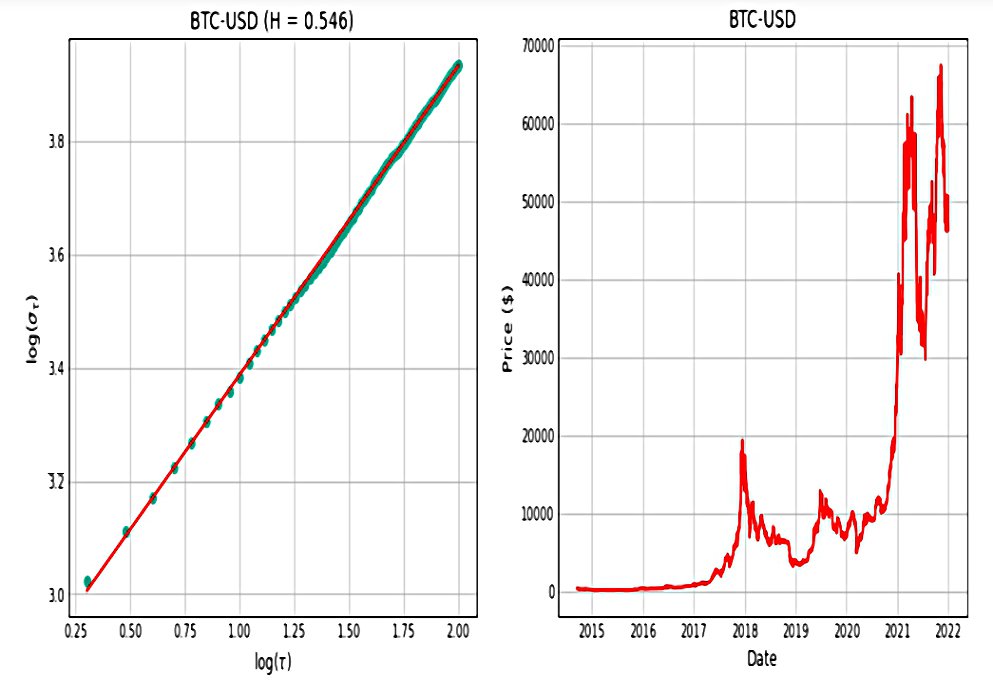
Bitcoin is a momentum play (in both directions).
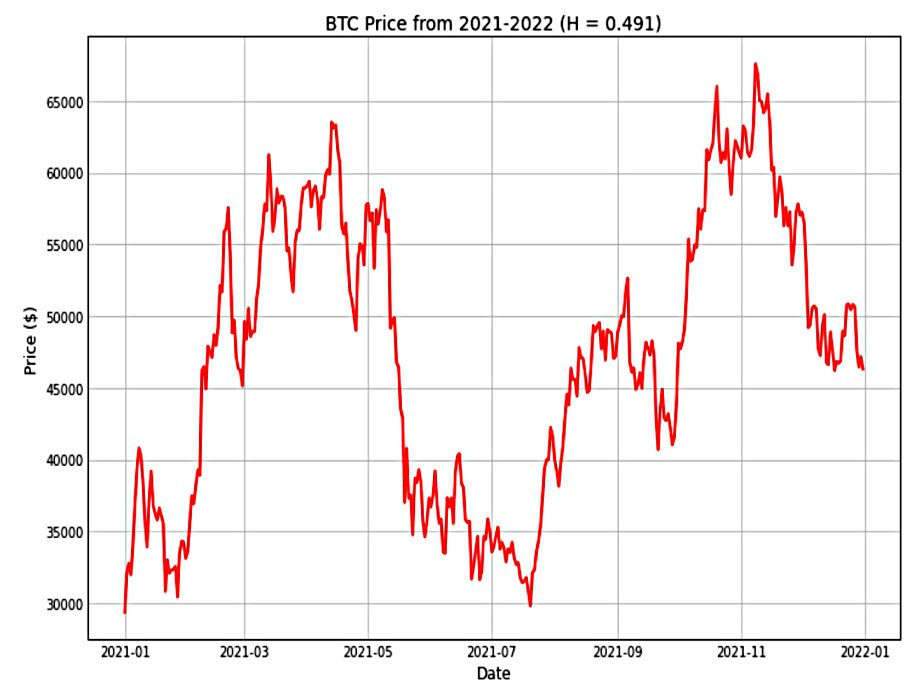
Raposa notes that in 2021 (after a strong bull market in 2020), BTC went into a mean-reverting phase.
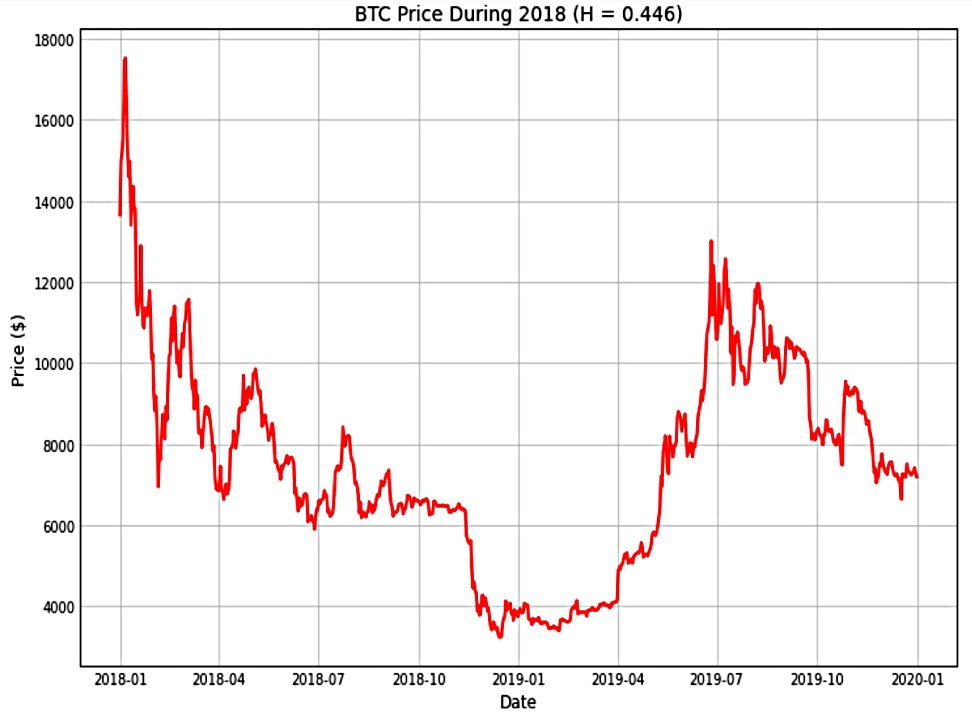
The same thing happened in 2018-2019 after the big bull run in 2017.
Stocks
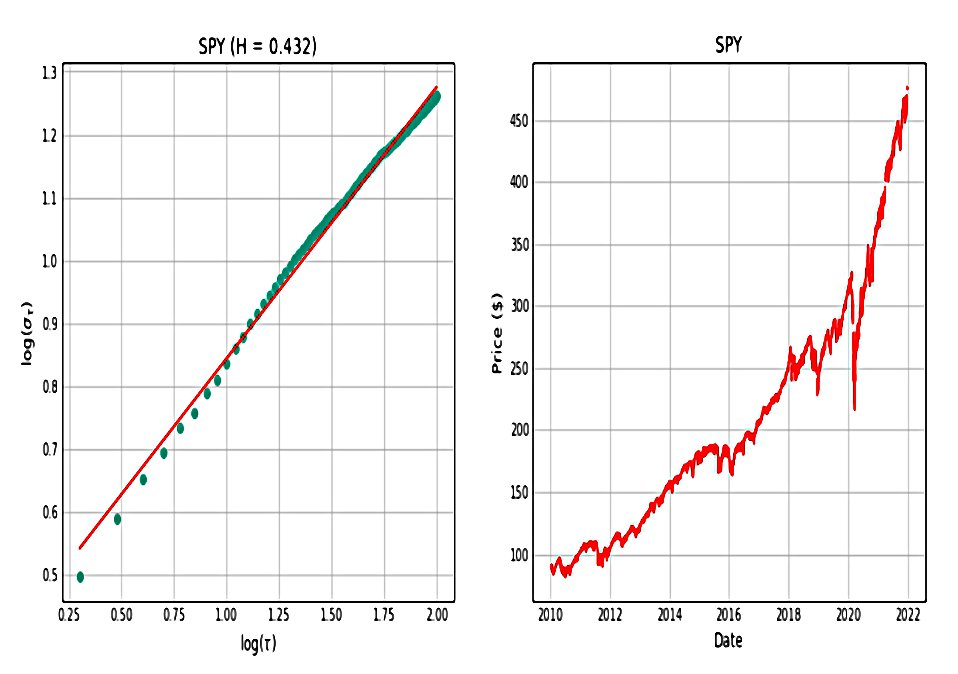
I’ve saved the most important asset class for last.
- The price chart for the S&P 500 looks like a strong upward trend, but the Hurst exponent tells us that this is a mean-reverting market.
What is more interesting is the time structure:
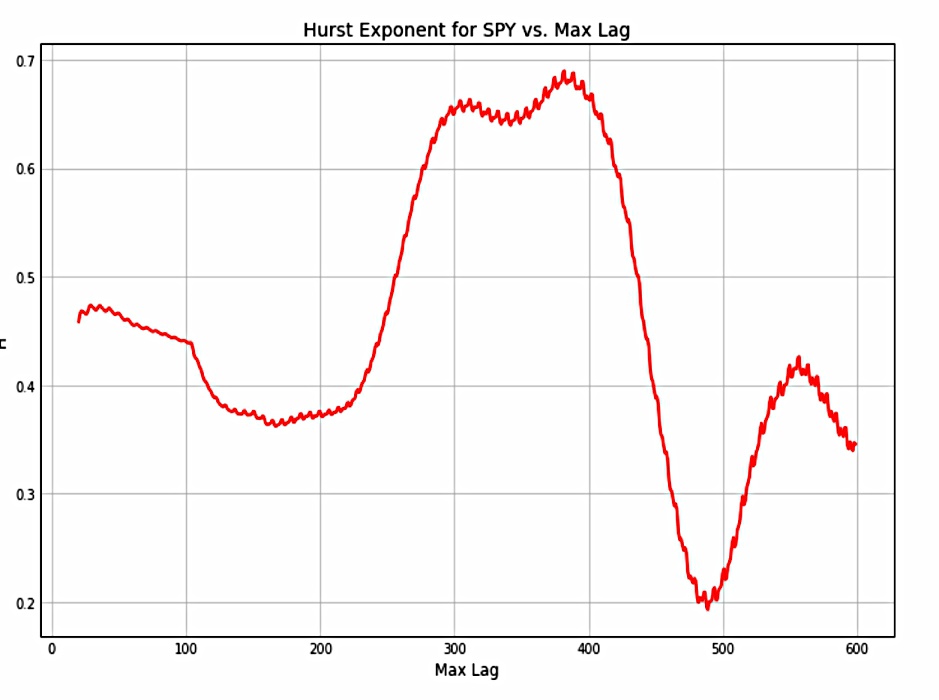
The index is mean-reverting over the short-term, then strongly-trending in the medium term, and then mean-reverting over the longer term (beyond 400 days).
- This matches up well with the folk wisdom for individual stocks, though the time frames are a little longer. (( Stocks are understood to revert over one month, trend over a year and then revert again ))
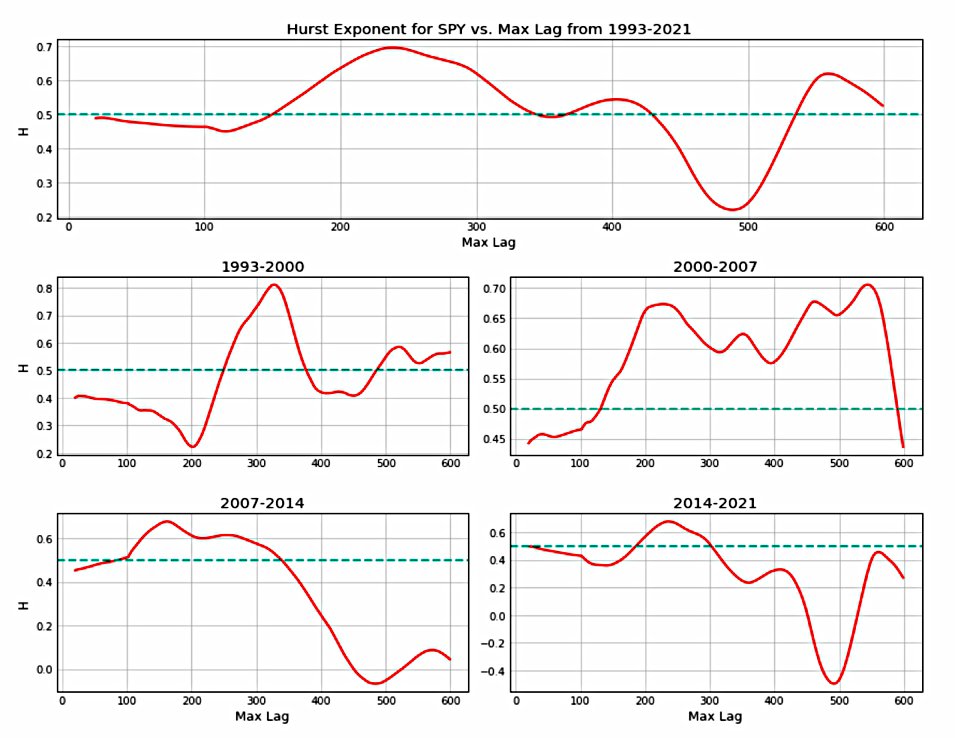
Raposa repeated this analysis over a variety of timescales.
- Unfortunately, the results are inconsistent.
Between the dot come boom and the 2008 crisis, there were strong trends.
- Since then, the trends concentrate around 100 to 300 days.
Raposa notes that this matches Turtle Trade Jerry Parker’s observation that 200+ days works best for trend following.
Conclusions
The Hurst Exponent is an interesting way of classifying markets, but unfortunately, it’s not stable over time in the market of most interest (stocks).
- There’s plenty of support for the idea that 200-day trends exist, but if we want to use the Hurst as a filter to protect against the times when trend isn’t working, we’ll need to dig into the maths and work out how to code and calculate the HE.
That’s a topic for another day.
- Until next time.
Sources
- Find Your Best Market to Trade With the Hurst Exponent – Raposa Technologies, Medium
- Introduction to the Hurst exponent — with code in Python – Eryl Lewinson, Towards Data Science, Medium
Mike Rawson
Mike is the owner of 7 Circles, and a private investor living in London. He has been managing his own money for 40 years, with some success.