Vanguard on Portfolio Construction
Today’s post looks at a paper from Vanguard on their approach to Portfolio Construction.
Contents
Vanguard on Portfolio Construction
The 32-page report is undated, but I came across it in October 2022.
- It has six authors (none of whom I have come across before) and originates from the Vanguard Investment Strategy Group (which is fourteen people strong).
The report considers a number of approaches:
- basic strategic asset allocation
- active investments
- risk factor exposures
- private investments
- ESG preferences
These strategies are rolled into proprietary tools like the Vanguard Capital Markets Model and the Vanguard Asset Allocation Model.
The goal of the paper is to:
Apply the framework to derive portfolio solutions based on several combinations of portfolio goals, preferences, and investments. We show that no one strategy is superior to the others. Rather, there are different portfolio solutions for specific investor goals and preferences.
Principles
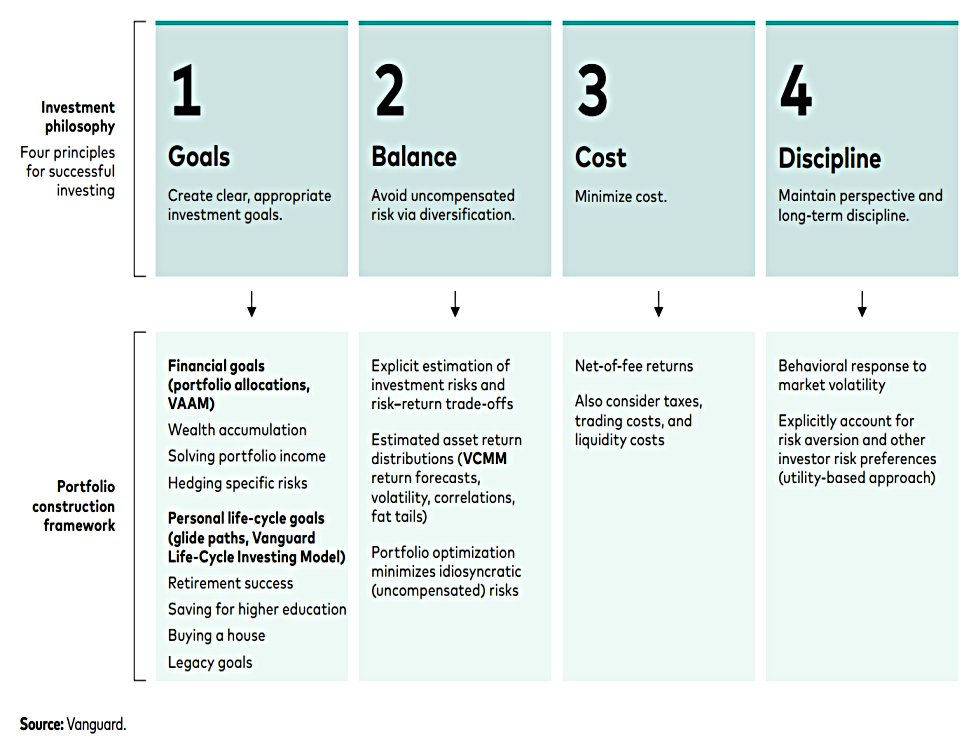
There’s not much to argue with in the core Vanguard principles.
- They start with goals
- They like diversification
- Costs are important (and they lump taxes in here, too)
- Discipline is their keyword for behavioural issues
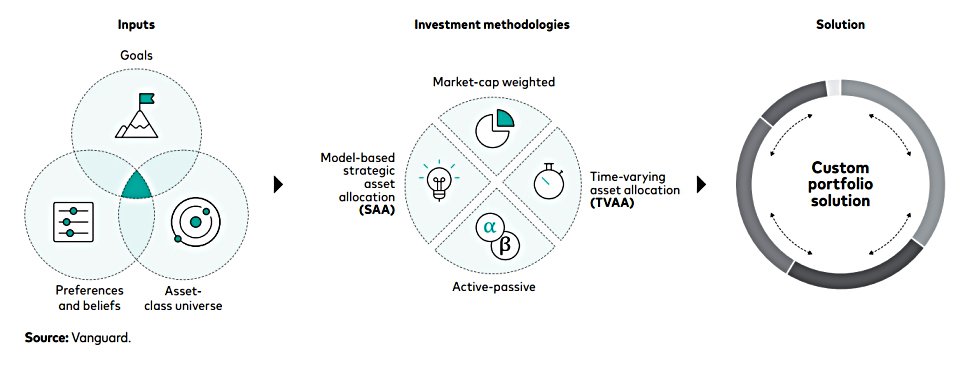
Methodologies
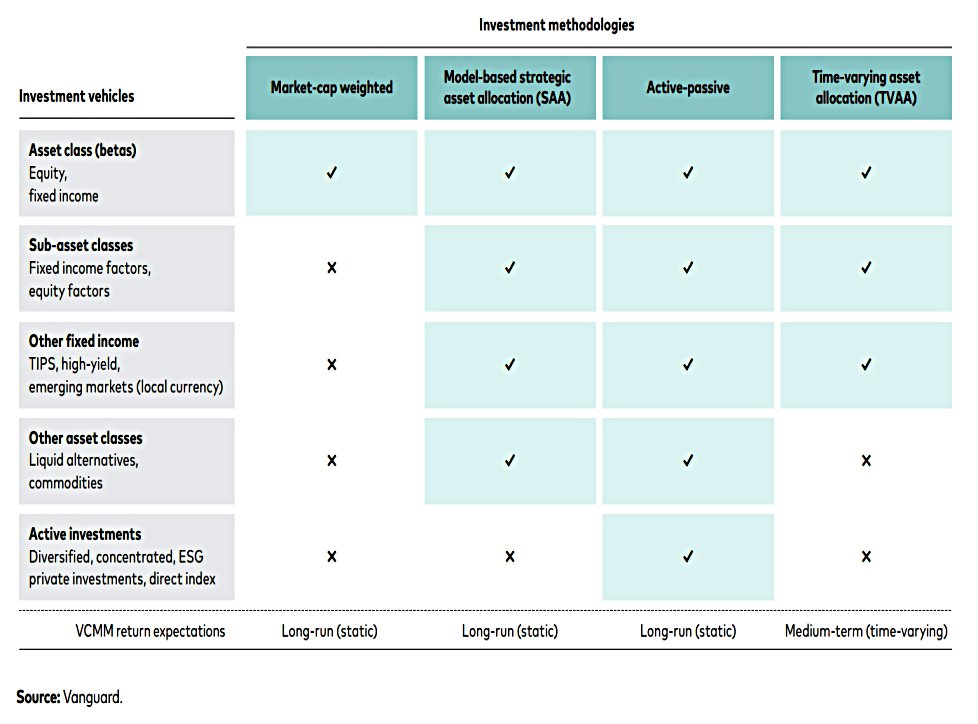
Vanguard has four methodologies:
- Market-cap weighted (passive, using just stocks and bonds)
- Strategic Asset Allocation (more assets with tilts away from market cap, but still passive)
- Active/passive (which adds an active layer)
- Time-varying Asset Allocation (TVAA, which I assume is really Tactical Asset Allocation, TAA)
This sequence tends to be a chronological progression for most investors, perhaps over a period of decades.
- I mostly use approach number 3, with a small but growing allocation to 4.
Strategic Asset Allocation
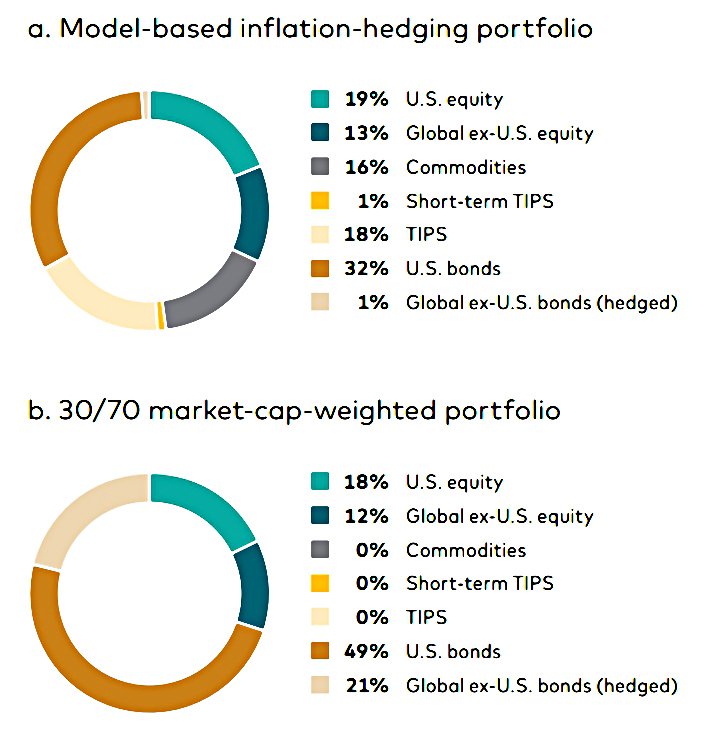
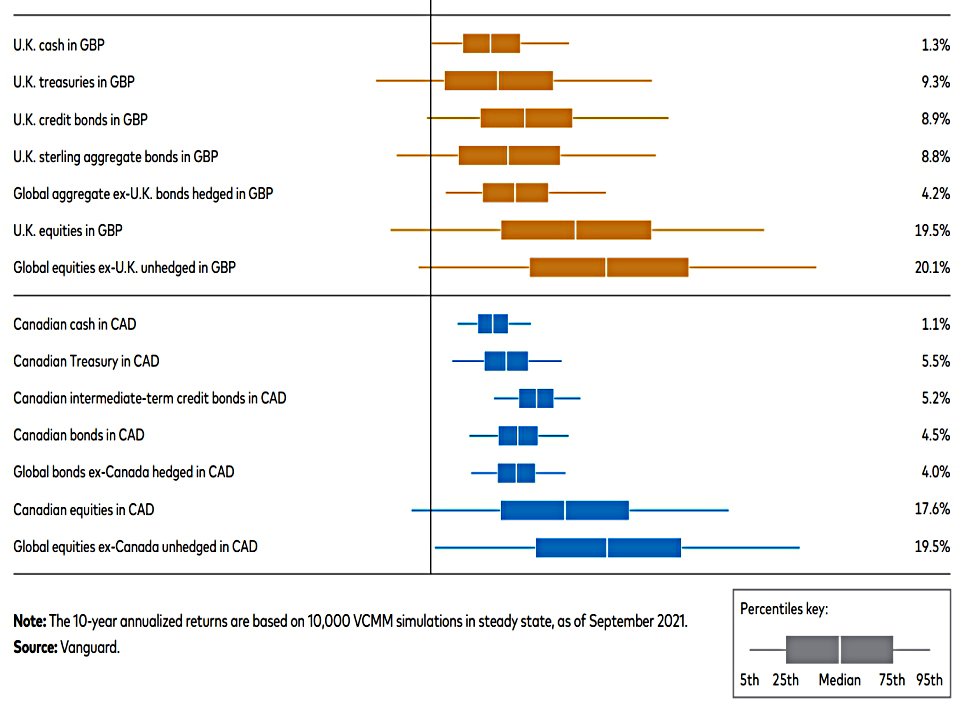
Vanguard SAA uses asset-class tilts to things like commodities, index-linked bonds and high-yield bonds.
- Return expectations are taken from the VCMM model (which I hope we’ll come to later)
- A second model (VAAM) uses these expectations as well as factor risks and premia to produce optimum portfolio weights.
This can be used to hedge specific risks (inflation is the example used in the chart above) or to target portfolio duration.
- The inflation portfolio has commodities and TIPS, which leads to higher drawdowns and more frequent underperformance.
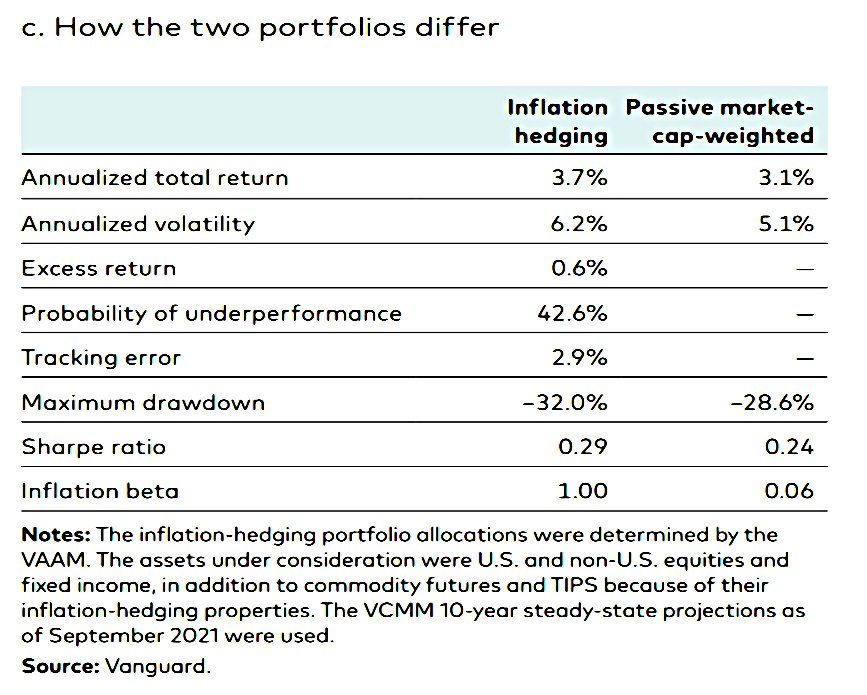
No portfolio is better than the other across all metrics, but the inflation-hedging portfolio is the one that is most likely to meet the goal for which it was designed.
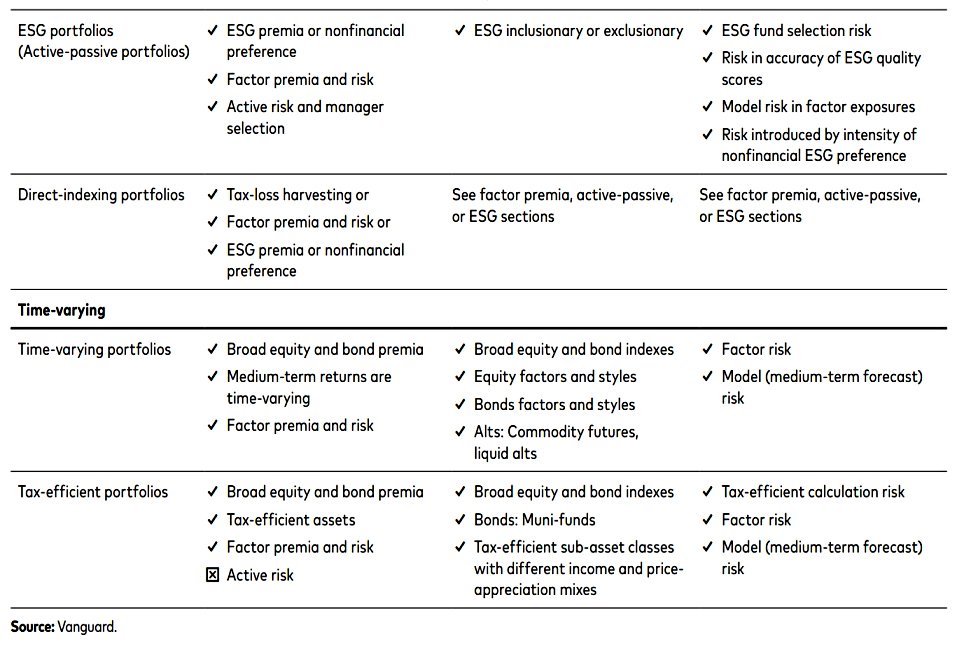
Active-passive
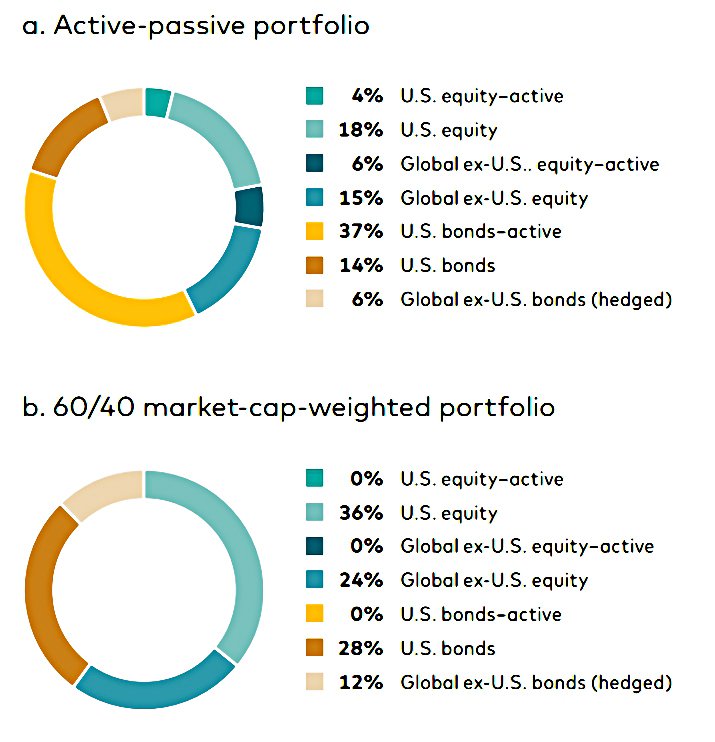
Active investing adds both the potential for outperformance and the risk of underperformance.
Vanguard’s Active-Passive Decision Framework involves explicitly quantifying expectations for alpha, tracking error and odds of underperforming the benchmark.
These forecasts are then tailored to match the investor’s risk tolerance (this is part of VAAM).
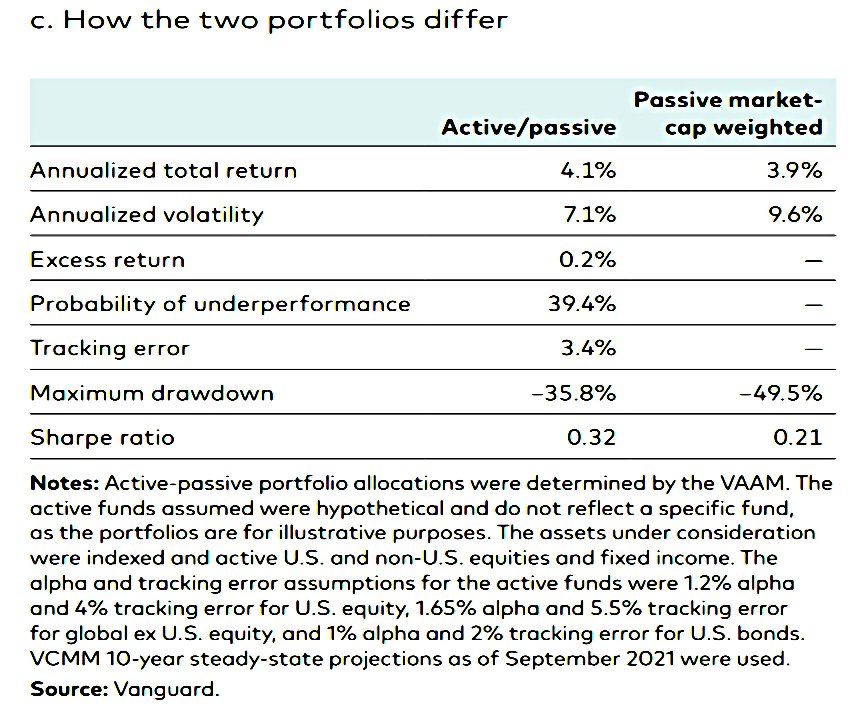
The example above uses US equities and bonds, as well as ex-US stocks to add 0.2% pa of return with a higher Sharpe ratio.
- This comes at the expense of a 3.4% tracking error and a 39.4% chance of underperformance in a given year.
Time-varying asset allocation
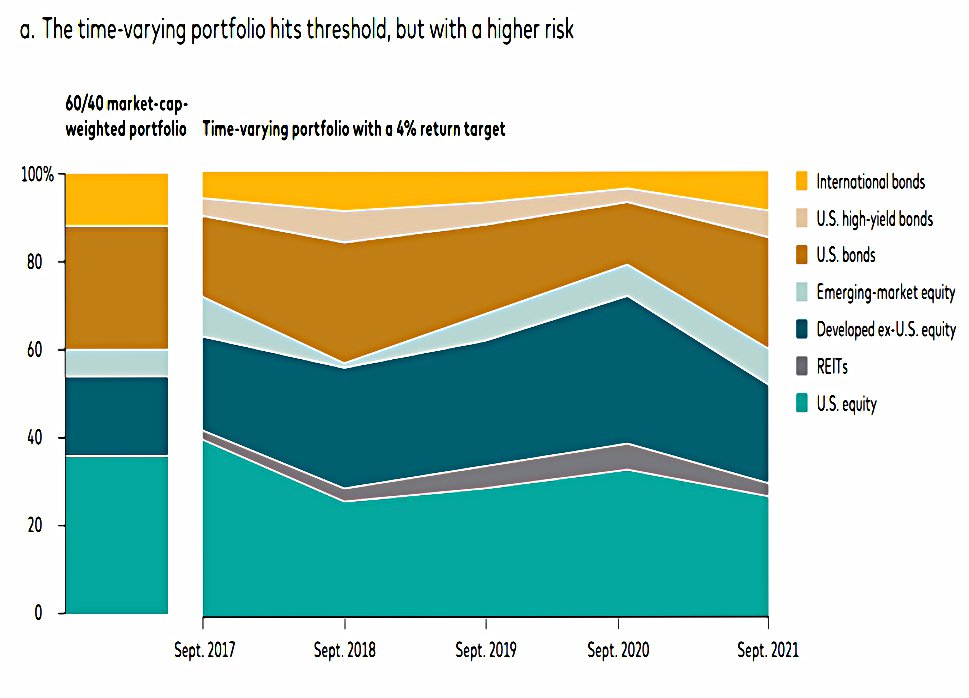
TVAA uses time-varying return expectations from the VCMM. (( Presumably, SAA uses static expectations from a very long lookback period ))
Achieving a desired target payout through changing market conditions may require adjusting the asset allocation over time.
This is a common institutional goal, but I suppose private investors in decumulation (retirement) might also be interested.
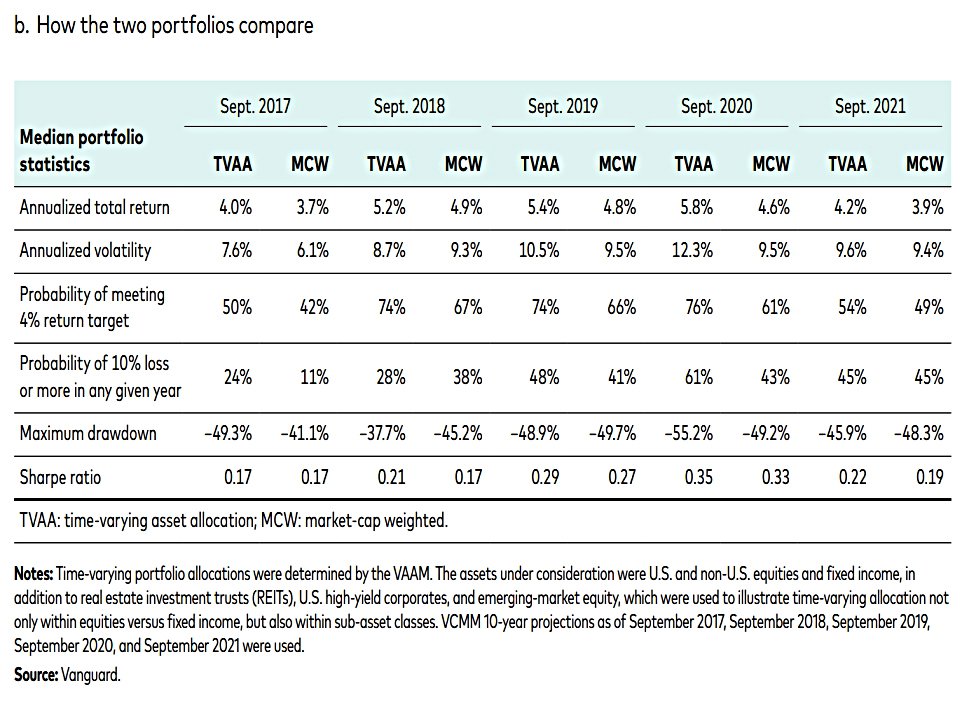
The example above targets a 4% return, even when the benchmark falls below this.
- This cost is higher volatility and bigger max drawdowns.
Portfolio solutions
The four approaches described above are applied to an investor’s goals, preferences (eg. ESG) and acceptable asset class universe.
There are three common goals:
- Maximum wealth (according to risk tolerance)
- Risk-hedging (inflation, duration, volatility)
- Return targets (constant payouts)
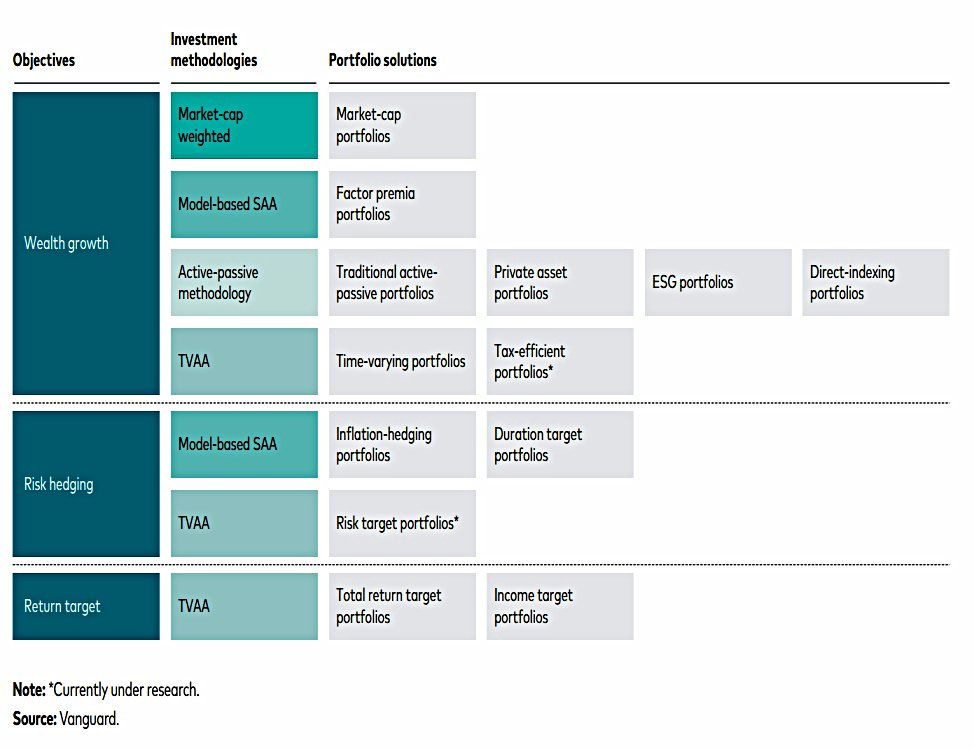
Vanguard combines the four methodologies with the three goals to produce fourteen portfolio solutions.
- A couple of the more interesting ones (tax-efficient and risk target) have asterisks to show that they are still being researched, so we won’t hear about those. (( The tax efficiency will probably only apply to US investors, in any case ))
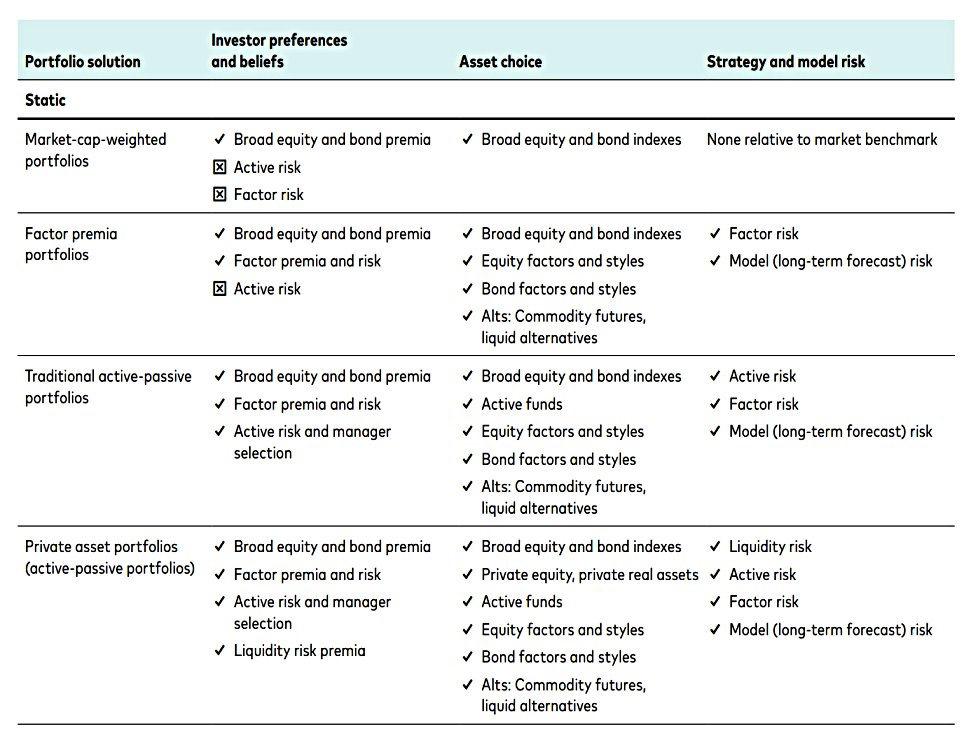
Of the remaining twelve, I am most interested in:
- Factor premia
- Active-passive
- Time-varying
- Inflation hedging and
- Total return targeting
Maximum wealth
Wealth growth is the most common objective, and any of the Fidelity approaches can be used.
Risk hedging
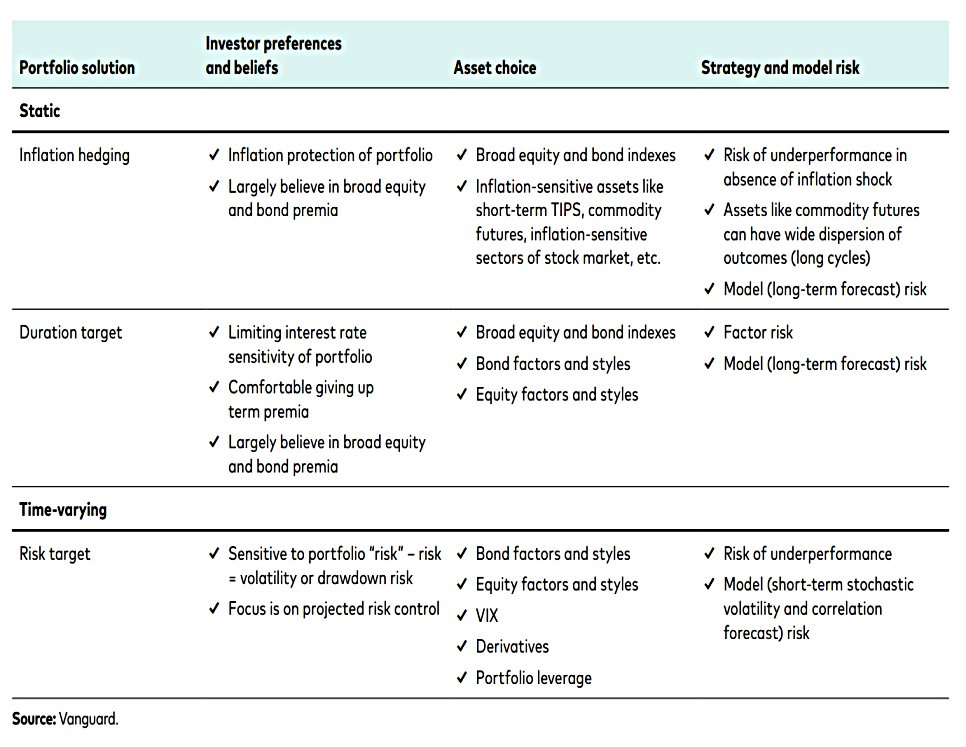
Risk hedging can be focused (on inflation or duration/interest rate risk) or more general (keeping portfolio volatility below a target value).
Return target
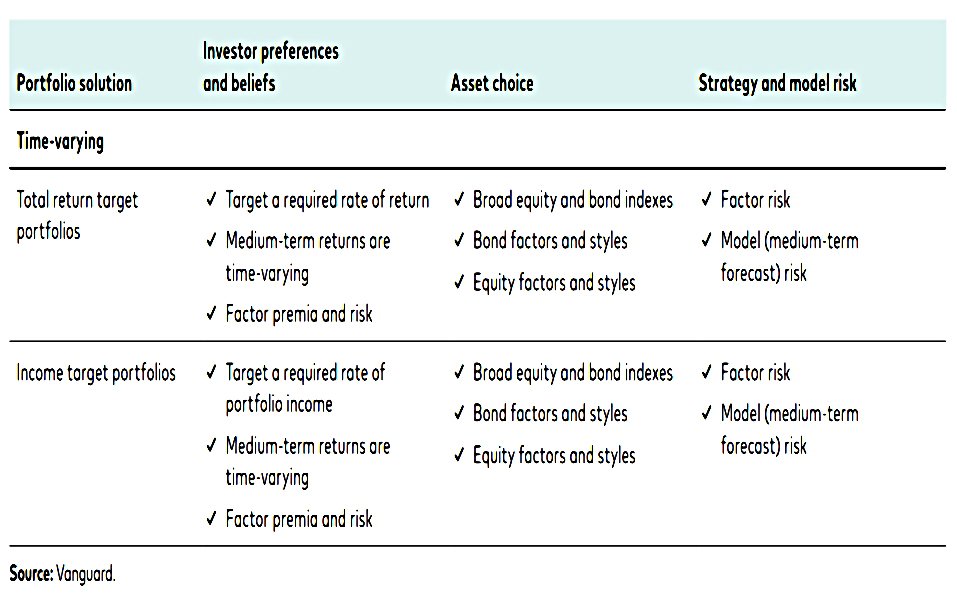
These goals are based on future spending targets and can target portfolio growth or annual income.
VCMM – risk and return
The VCMM [Vanguard Capital Markets Model] is our proprietary statistical engine for estimating asset class expected returns, volatilities, correlations, and other statistical distributional properties of asset returns.
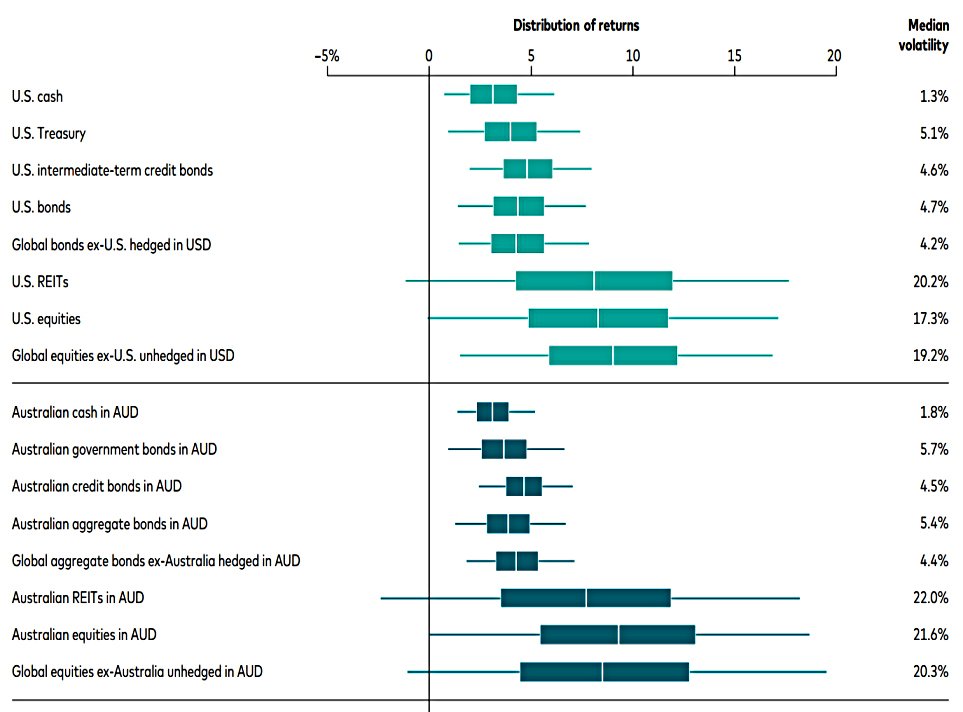
The VCCM outputs return distributions as a key input to the portfolio construction process.
- The focus is on medium (10 years) and long-term (30 years) forecasts because short-term forecasting is very unreliable.
The long-term forecasts don’t vary much over time.
Medium-term returns depend largely on initial conditions (PE ratios and interest rates).
- Other key inputs are assumptions on inflation, productivity growth and central bank neutral interest rates.
The model also includes a non-normal distribution (with fatter tails).
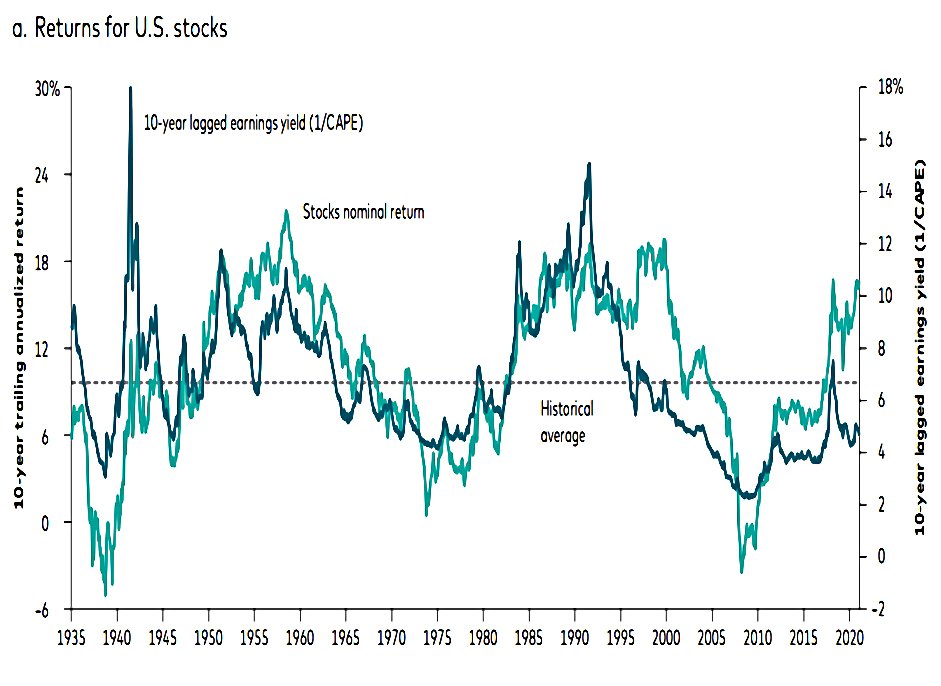
The average annual return for (US) stocks since 1926 is 9.8%, but rolling 10-year periods have delivered anything between -5% and +20%.
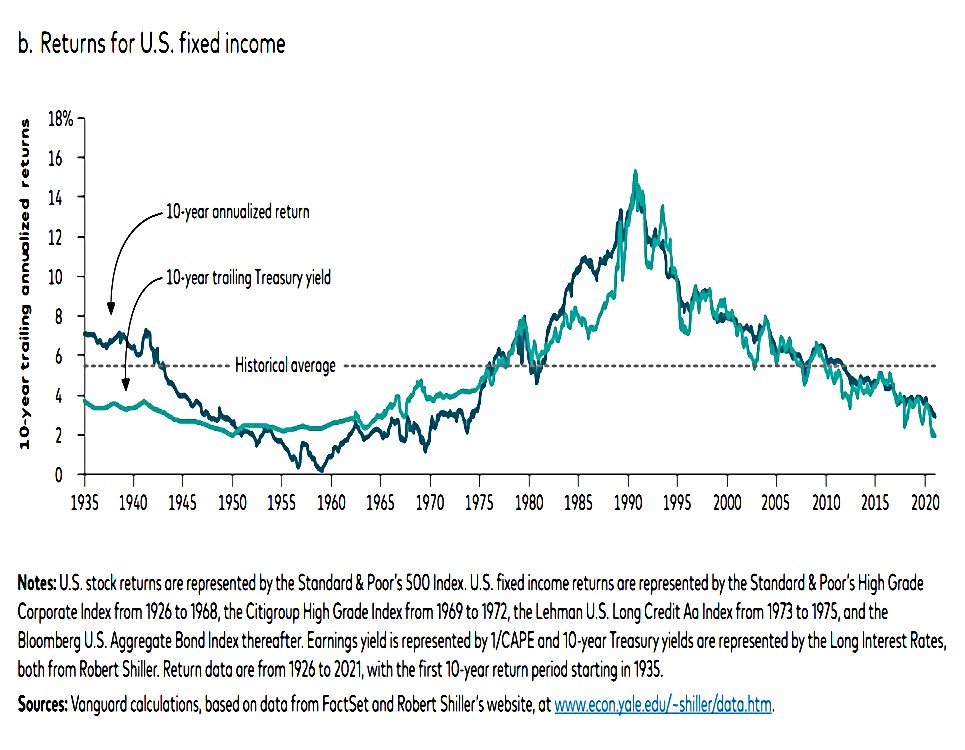
Bond returns average 5.5% but rolling 10-year periods have delivered anything from 0% to 14%.
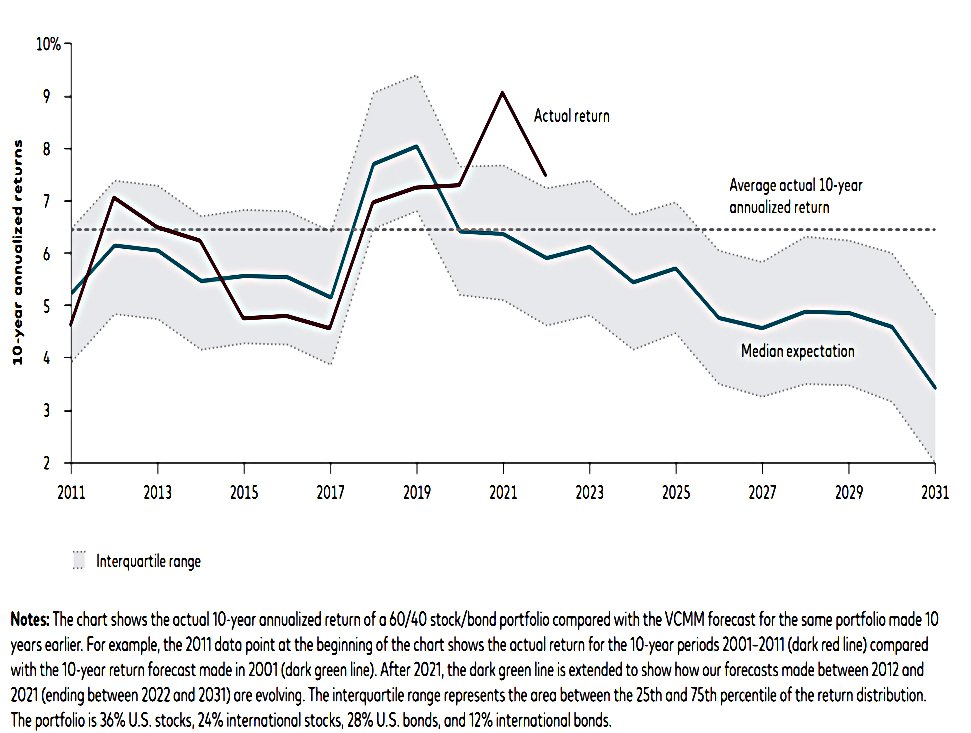
This chart shows the 10-year return forecast for a 60/40 portfolio and overlays the actual returns from recent years.
VAAM – portfolio construction
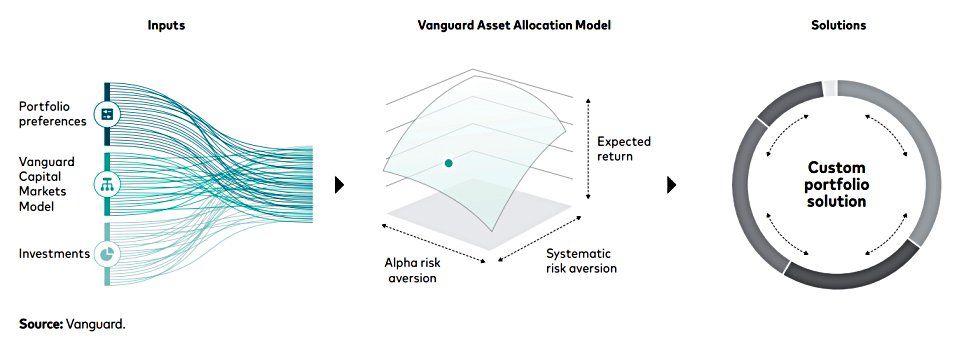
The VAAM (Vanguard Asset Allocation Model) is utility driven, taking into account investor tolerance for risks (including active management, factors and illiquidity).
- It takes as inputs the asset return distributions from the VCMM.
Conclusions
I’m not sure we’ve learned too much today.
- The report reads like a sales document, designed to reassure potential investors that Vanguard has a sophisticated portfolio construction process.
On this level, the report succeeds, but it turns out that Vanguard uses multiple solutions depending on the client, rather than a single approach for all clients.
- In addition, many of the approaches used are relatively unsophisticated, and the more advanced features (VCMM and VAAM) are presented as black boxes (which is not too surprising, given that they are proprietary models).
Until next time.
Mike Rawson
Mike is the owner of 7 Circles, and a private investor living in London. He has been managing his own money for 40 years, with some success.