Trading For A Living #7 – Practicalities and Records

Today’s post is our seventh and final visit to Trading for a Living by Alexander Elder. Today we look at Practicalities and Records.
Contents
Practical Details

The final two chapters of Elder’s book are about practical details and record keeping.
- It turns out that some of the “details” in particular are quite important.
Profit targets
Write down your entry level, profit target, and stop for every planned trade in order to compare your risk and reward. Your potential reward should be at least twice as big as your risk.
This is the 2R rule used by many traders.
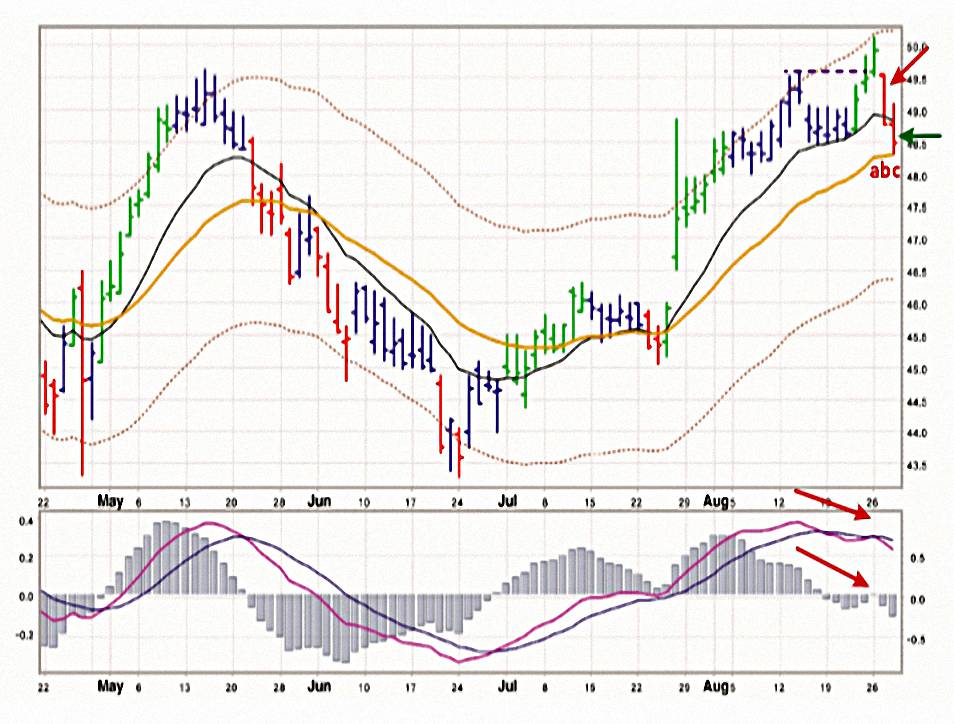
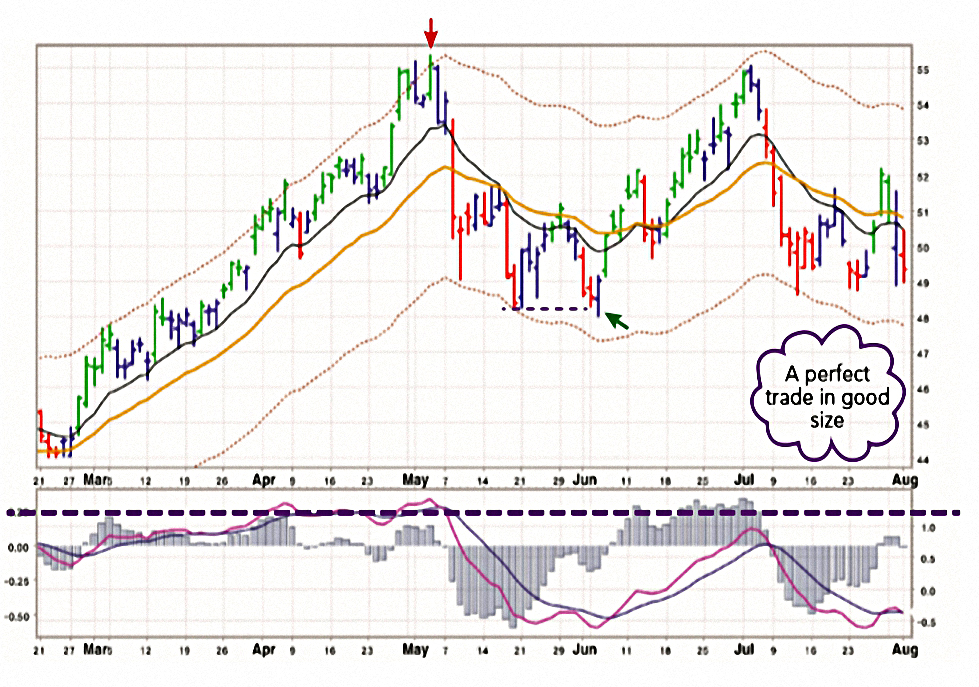
This is a short of VeriSign using the “false breakout with a divergence” strategy. On day “a” [top right] VRSN broke out and closed above resistance, marked by a horizontal dashed line, while MACD-Histogram couldn’t even rise above zero.
The next day, marked “b,” VRSN opened below the orange line, showing that the previous day was a false upside breakout (some would call it an upthrust).
As soon as MACD-Histogram ticked down, creating a bearish divergence, the pattern was completed, and I immediately went short. VRSN kept sinking all day and closed lower.
The next day, marked “c,” it tried to form a base, and since the daily price was already in the value zone, I decided that it was enough and covered my shorts.
When calculating a trade’s profit potential, we run into a paradox. The longer your expected holding period, the bigger the profit potential. A stock can rally much more in a month than in a week. On the other hand, the longer your holding period, the higher the level of uncertainty.
Moving averages and channels help set profit targets for swing trades. They also work for day-trades; only there you need to pay more attention to oscillators and exit at the first sign of a divergence against your trade.
Profit targets in position (long-term) trades are usually set at previous support and resistance levels.
Note that Elder includes “envelopes” (ATR bands from MAs, and Bollingers) in a broad definition of “channels”.
- He would probably also see the “value zone” between the short and long MAs as a form of channel.
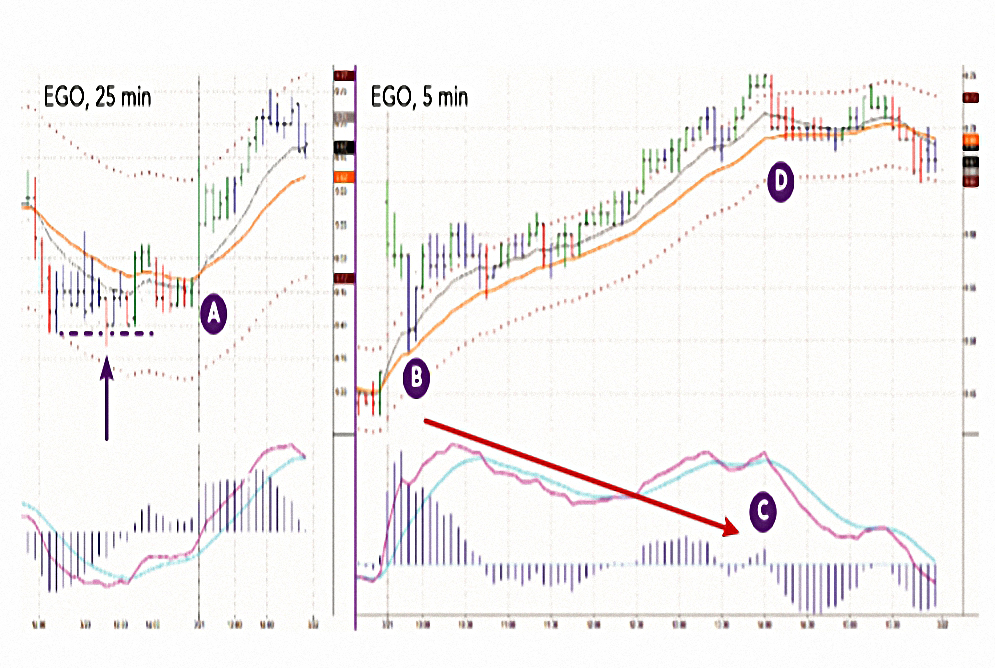
The decision to buy EGO was taken on a 25-minute chart in area A, where the moving average turned up and the Impulse system changed to green.
My trading strategy here was “pullback to value,” which I executed on a 5-minute chart, as prices gapped up at the open but then pulled back into the value zone (area B).
I went long at $9. 51; my initial target was $9. 75, near the upper channel line on the 25-minute chart, with a stop at $9. 37, for a nearly 2:1 reward/risk ratio.
I placed an order to sell at $9. 75 that wasn’t filled. As prices turned down from their bearish divergence on a 5-minute chart, I lowered my sell order to $9. 70.

IGOI is trading slightly above $3, with a rising EMA confirming a new uptrend. Its previous major top was above $60 (notice a kangaroo tail), and two recent intermediate rallies had fizzled out at $15 and $22.
If this is the start of a new bullish trend, it would be reasonable to set the first profit target near $15, the next near $22.
VRSN was a fairly common example of a modest swing trade: entering near one of the channel lines and taking profits in the value zone between the two moving averages.
The EGO day-trade illustrates buying a pullback into the value zone during an uptrend, with a profit target at the upper channel line. I used an oscillator to speed up my exit when the market wouldn’t let me exit at the initial target.
IGO passed a “fallen angels” screen – stocks that have “fallen over 90%, stopped declining and slowly began to rise”.
The best time to look for “fallen angels” is when a bear market starts showing signs of bottoming.
Stops
SafeZone stops are described in detail in “Come into My Trading Room.” They measure market noise and place stops at a multiple of noise level away from the market.
Use the slope of a 22-day EMA to define the trend. If the trend is up, mark all downside penetrations of the EMA during the look-back period (10 to 20 days), add their depths, and divide the sum by the number of penetrations.
This gives you the Average Downside Penetration. You need to multiply an average downside penetration by a factor of two or greater.
When the trend is down, we use three times the Average Upside Penetration.Shorting near the highs requires wider stops than buying near quiet, sold-out bottoms.
Obvious Levels
A recent low that sticks out like a sore thumb draws traders to place stops slightly below that level. Most people place their stops there, creating a target-rich environment.
The market has an uncanny habit of quickly sinking back to those obvious lows and triggering stops before reversing.
Elder says you must go closer (and increase the risk of being whipsawed out) or further away (at more cost and hence smaller size).
- He recommends tighter for short term trades and looser for long-term.
For the same reason, avoid placing stops at round numbers.
Nic’s stops
An alternative is what Elder calls “Nic’s stop” – the second lowest (more shallow) low.
If the market is sliding to its second lowest low, it is almost certain to continue falling and hit the key low, where the bulk of stops cluster.
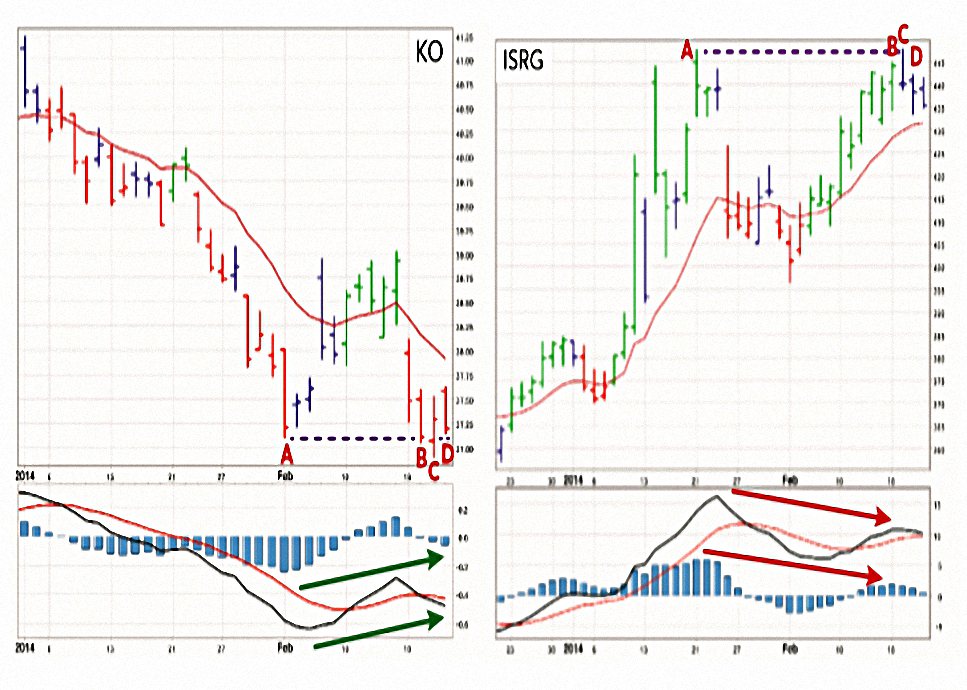
Here KO has a false downside breakout with a bullish divergence. The Impulse system has turned from red to blue, permitting buying.
The crowd will have set its stops below 36.89 (C), but Nic’s stop will go to $37. 04 – a cent below the second lowest recent low (B).
Intuitive Surgical has a false upside breakout with a bearish divergence. The Impulse system has turned from green to blue, permitting shorting.
The crowd will have its stops above $447.75 (C), but Nic’s stop will go to $445.05 – a few cents above the second highest recent high (B).
ATR stops
When you enter during a price bar, place your stop at least one ATR away from the extreme of that bar. A two ATR stop is even safer. You can use it as a trailing stop, moving it at every bar.
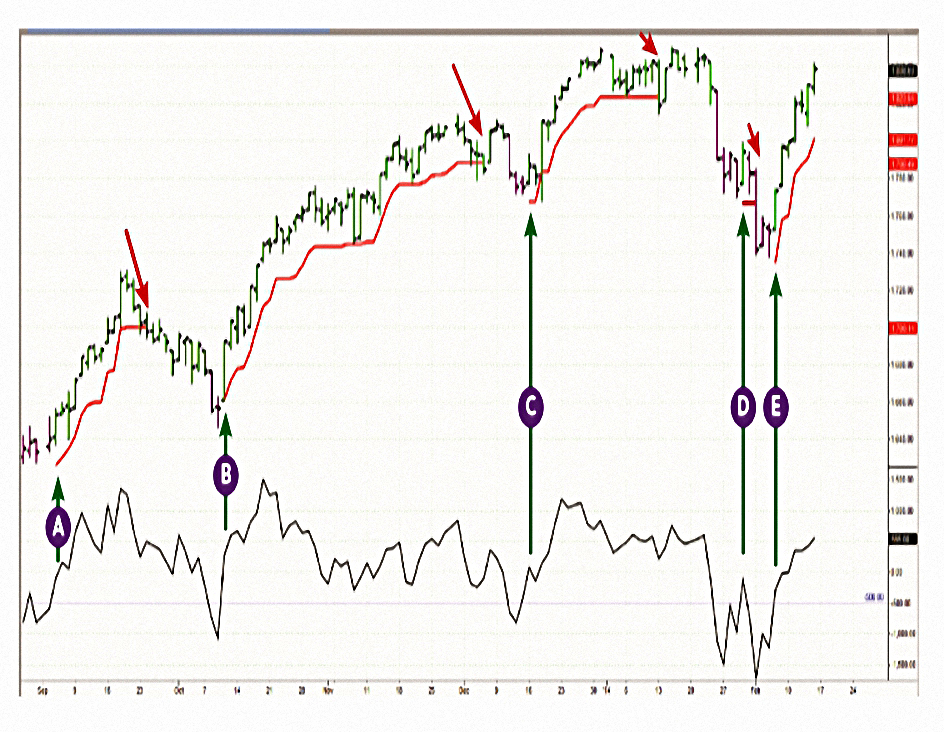
A Spike Bounce signal occurs when the 20-day New High – New Low Index drops below minus 500, indicating a bearish imbalance, and then rallies above that level, showing that bulls are coming back (green arrows).
The red line trails two ATRs below the highs of the bars of the S&P 500. Notice the very productive signals A, B, and C. E is still in effect and D resulted in a loss–there are no universally profitable signals.
Protecting profits
Never let an open trade that shows a decent paper profit turn into a loss! Before you put on a trade, start planning at what level you’ll begin protecting your profits.
Once your open profit rises to that level move your protective stop to a breakeven level.
Grades
Whenever you complete a trade, the market gives you three grades. It grades the quality of your entry and exit, and most importantly, your overall trade grade.
Your buy grade is based on the location of your entry, relative to the high and low of the daily bar during which you bought.
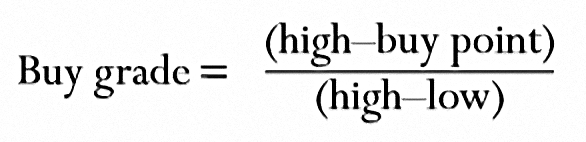
I calculate my buy grade for every trade and consider anything above 50% a very good result, meaning I bought in the lower half of the daily bar.
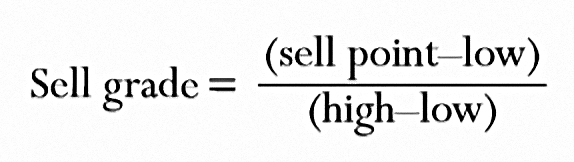
I consider anything above 50% a very good result, meaning I sold in the upper half of the daily bar.
Rate the quality of every trade by comparing what you’ve got to what was realistically available. I find my trade grade by comparing points gained or lost in a trade to the height of the daily chart’s channel measured on the day of the entry.

You may use any number of channels – parallel to the EMA, Auto Envelope, Keltner, or ATR – as long as you’re being consistent.
The distance between the upper and the lower channel lines on the day you enter a trade represents a realistic maximum of what’s available to a swing trader in that market.
I consider any trade that gains 30% or more of its channel height an A-trade.

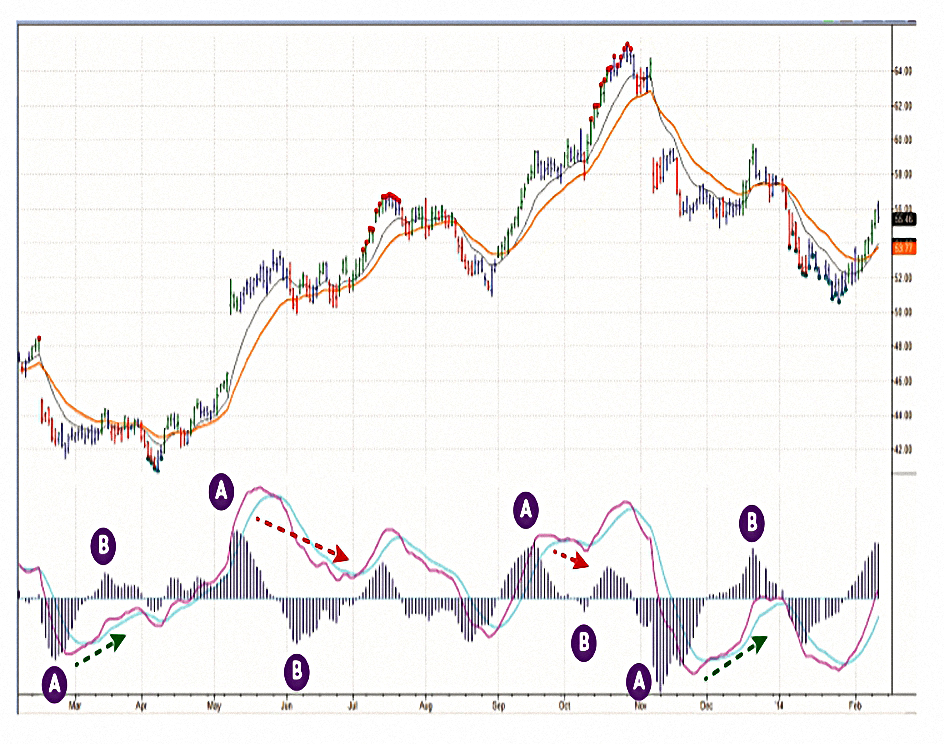
Day A–Feb. 10, 2014, Monday: high $52. 49, low $51. 75, upper channel line $53. 87, lower $47. 61 (we’ll need channel values to calculate the trade grade on exit). Bought at $51. 77. Buy grade = (52. 49 – 51. 77) / (52. 49 – 51. 75) = 97%.
Day D–Thursday: high $54. 49, low $53. 39. Sold at $53. 78. Sell grade = (53. 78 – 53. 39) / (54. 49 – 53. 39) = 35%. Trade grade = (sell – buy) divided by channel height = (53. 78 51. 77) / (53. 87 – 47. 61) = 32%.
A-trades
You need to have a clear idea of what would be a perfect setup for you, “an A-trade.”
Perfect doesn’t guarantee profits–there are no guarantees in the market–but it means a setup with a strong positive expectation. It also means something you’ve traded before with which you are comfortable.
Once you know what it is, you can start looking for stocks that exhibit that pattern.
One of the few advantages of a private trader over an institutional one is that we can trade or not trade when we like. We have the luxury of being free to wait for excellent setups.
I currently trade three systems. My main one is a “false breakout with a divergence. ” I also occasionally trade pullbacks to value – buying pullbacks during uptrends and shorting rallies in downtrends.
On rare occasions, I trade against the extremes, buying severely beaten down stocks or shorting stocks whose wild rallies are stalling.
Scanning
Scanning means reviewing a group of trading vehicles and zooming in on trading candidates. Your scanning can be visual or computerized: you may flip through multiple charts, taking a quick glance at each, or else have your computer run through that list and flag stocks whose patterns appeal to you.
Defining a pattern you trust must be your first step.
If you’re a trend-follower, but don’t like chasing stocks, you may design a scan to find stocks whose moving average is rising but the latest price is only a small percentage above that average.
I like looking for trading candidates on weekends,and depending on how much time I have, take one of the two approaches.
The lazy way is to review Spikers’ picks for the week ahead [Spikers are the elite members of Elder’s SpikeTrade.com site].
The hard-working way consists of dropping all 500 components of the S&P 500 into my software and running a scan for potential MACD divergences.
I’ve seen many divergence scans, but never a reliable one. John Bruns built me a semi-automatic scanner that looks for patterns that precede divergences.
Elder compares the number of bullish and bearish divergences, and focuses on the larger group.
I prune my weekly list of trading candidates down to five or six picks that show the most attractive patterns and the best reward to risk ratios.
This semi-automatic scan finds stocks that have completed parts A and B of a potential divergence. As part C (the second top or bottom) begins to emerge, this scan starts putting red dots above or green dots below the bar to alert one to the possibility of a divergence.
If you’re going to scan a large number of stocks, it pays to add some negative rules.
For example, you may want to omit stocks whose average daily volume is below half a million or even a million shares. Their charts tend to be more ragged and their slippage worse than in more actively traded stocks.
Good Record-Keeping
Good record-keeping is the best tool for developing and maintaining discipline. It ties together psychology, market analysis, and risk management.
We all make mistakes, but if you keep reviewing your records and reflecting on past mistakes, you’ll be unlikely to repeat them. Good record-keeping will turn you into your own teacher.
Edler says there are three key components:
- homework
- trade plans
- trade records (of execution)
Homework
It pays to have a morning routine for the market; I use a spreadsheet.
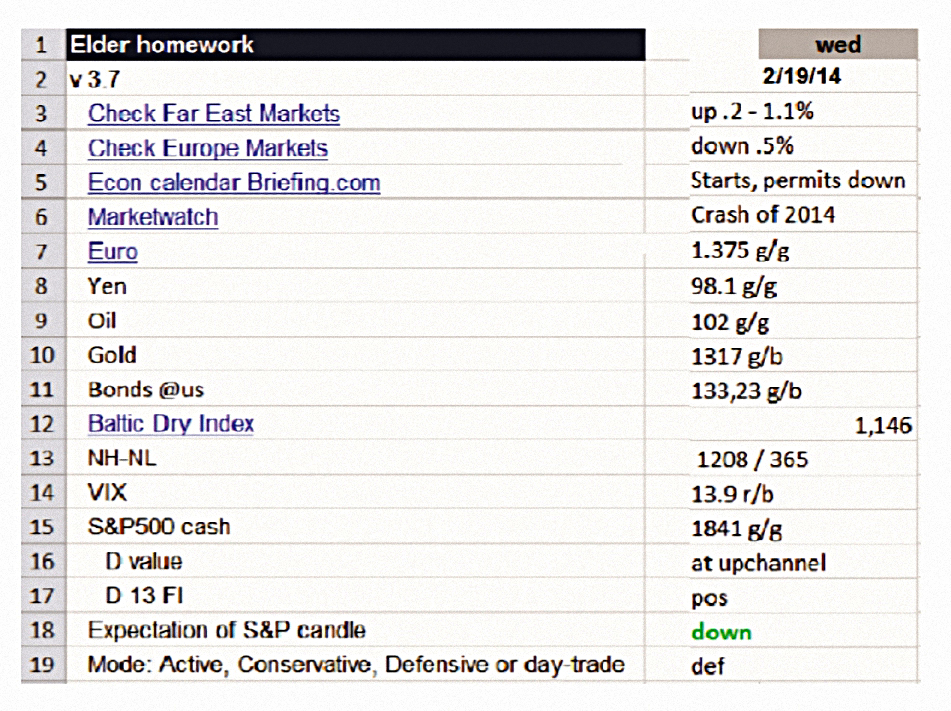
I begin by looking at the overseas markets, then major news, key currencies and commodities, and the key stock market indicators.
First Elder checks overnight percentage changes for foreign markets. Next he looks at the economic calendar, then Marketwatch (for populist news).
- Then he checks currency, oil, gold and bonds prices and the Baltic Dry index of shipping rates.
Next its back to the US market for the NH-NL indicator and the Vix, plus S&P500 levels, indicators, position within channel and expectations for the day.
- The final line is a summary of Elder’s proposed trading style for the day.
After filling out this spreadsheet, I turn to my open trades. I review their stops and profit targets, then I review my short list of candidates, – planned entries, targets, and stops.
Elder also carries out a quick psychological self-inventory to see if he is ready to trade.

Trade plans
A plan for any trade must specify what strategy you’ll use. It must prompt you to check the dates of earnings and dividends or contract rollovers, in order to save you from being blindsided by predictable news.
It must spell out your planned entry, target, and stop as well as your trade size. Writing down a trade plan makes it real.
I like having my trade plans on paper. I use preprinted forms that I named Tradebills. I have two tradebills for each system – one for buying and another for shorting.
Scoring Plans – Apgar
Apgar was referenced in Kahneman’s book Thinking Fast and Slow.
- She developed a scale / checklist for deciding which newborn babies require immediate medical care.
Each newborn is rated on its pulse, breathing, muscle tone, response to a pinch, and skin color. A good response to any question earns two points, poor zero, or one for an in-between.
Scores of seven and above are considered normal, 4 to 6 fairly low, and less than 4 critically low.
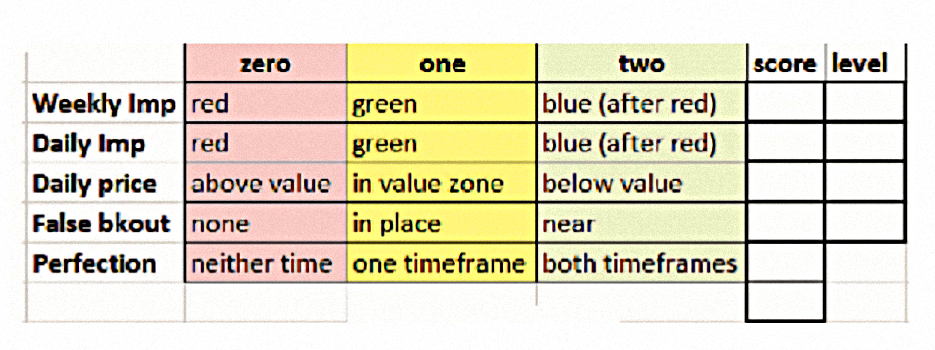
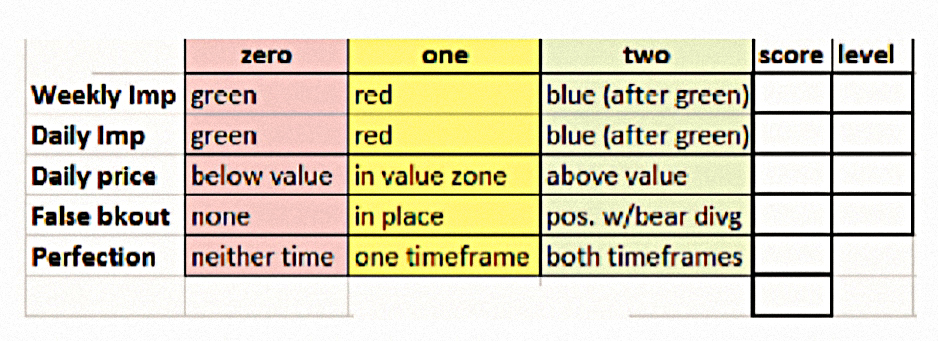
Elder has an Apgar for trade plans.
A word of caution: this scoring method is designed for one system – my “false breakout with a divergence” strategy. All other systems will require a different test.
Edler needs a score of 7 or more – and no zeros on any line – to continue.
Tradebills
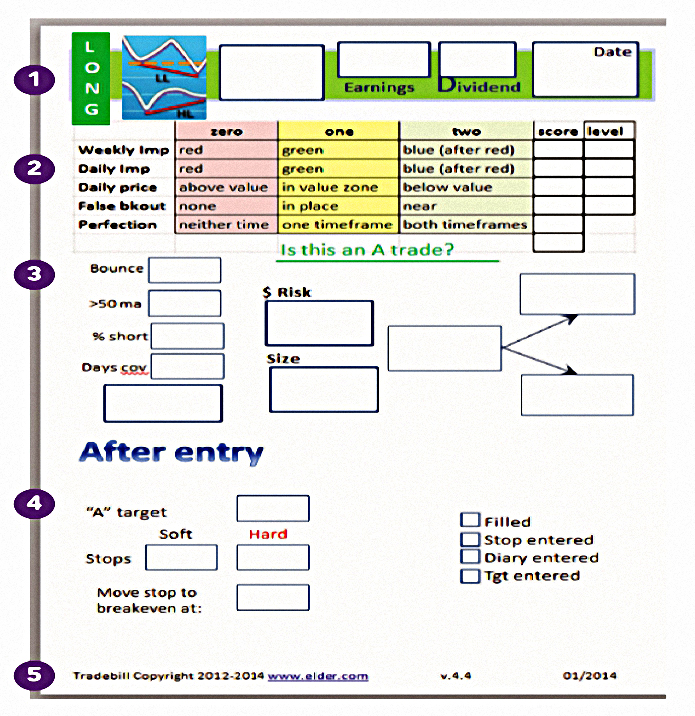
The green stripe marks it as a long trade. A thumbnail picture of a bullish divergence with a false breakout is a reminder of the strategy.
The first box is for the ticker symbol. The next box is for the next earnings date. The next box is the dividend date. The last box is for the date of my plan.
Next comes the Apgar.
Part 3: Market, entry, target, stop, and risk control. Is the Spike Bounce signal in effect? Is the indicator that traces stocks above their MAs bullish or bearish? What is the short interest in this stock and how many days to cover?
Three boxes linked by arrows demand three essential numbers for every trade: the entry, the target, and the stop.
Part 4: After the entry. The A target is 30% of the daily channel height added to the entry price. The soft stop is what you may keep in mind, while the hard or catastrophic stop is the actual order.
Put in the price level at which you’ll move your stop to breakeven. Check the boxes on the right as you perform these essential steps.
Trade Journal
For years, I struggled with developing a record-keeping system that would be easy to update and analyze. In the beginning, I kept the diary of my trades in a paper journal, gluing in chart printouts and marking them up.
Later I kept my diary in Word, and then in Outlook. Finally, in 2012, Kerry Lovvorn and I created a web-based Trade Journal. Our Trade Journal is available to all,and its use is free (up to a limit).

Section A – asks why I decided to trade this stock. Section B – Documenting entry and exit dates and prices; accounting for slippage and seeing buy, sell, and trade grades. Section C – Reasons for exit with an attached combination chart showing both entry and exit.
Section D – I may exit because my trade hit its target, or its stop, or is reaching the value zone or the envelope. I may exit if a trade is going nowhere or starting to turn. There are also two negative exits: couldn’t stand the pain or recognizing a junk trade after I entered.
Section E – Post-trade analysis. I like to return to every trade two months after the exit and review it with the benefit of hindsight.
Quite a lot of this has been written down already in the previous documents.
Follow up
I make my strategic decisions on the weekly charts, tactical on the dailies. Once a month I spend a few hours reviewing trades that I closed two months ago.
Such reviews teach you what’s right with your trading, and what needs to be changed.
Reviewing Your Equity Curve is [also] essential because only a rising curve certifies you as a successful trader.
My strategy for shorting Discovery Communications was “fading an extreme;” my exit tactic “started turning. ” Entry and exit are marked by arrows. “
A review two months later confirmed that both decisions were correct. Lesson: the next time I see this pattern, jump aboard.
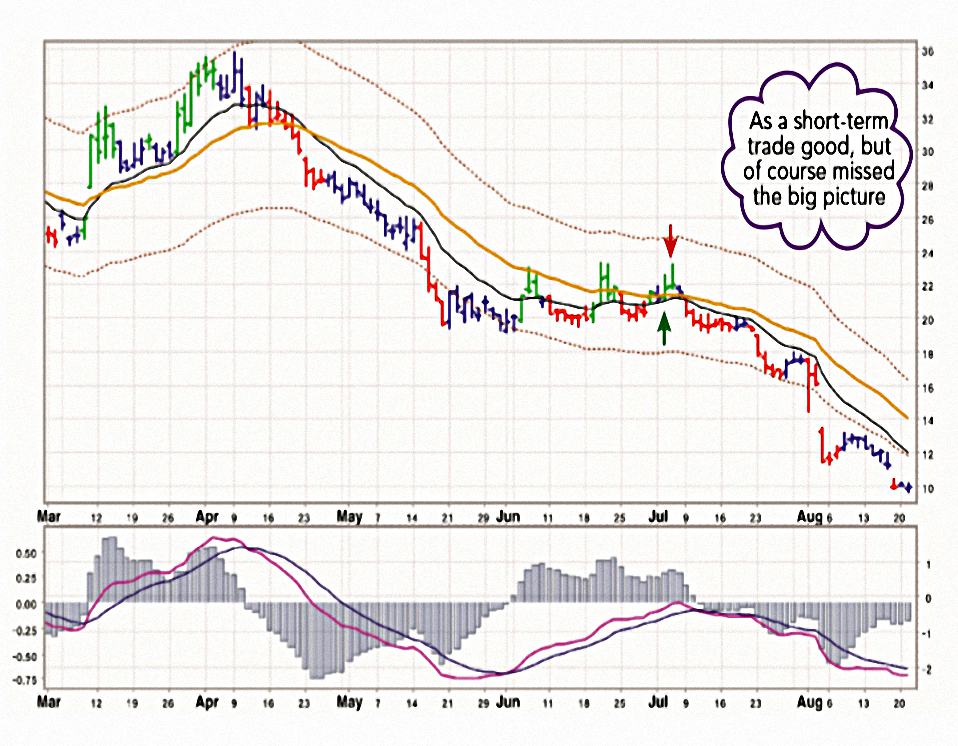
My strategy for buying Molycorp “pullback to value”- I thought that a new uptrend had begun. The following day, I was no longer so sure and sold for a small profit.
A review two months later showed that I missed the resumption of the bear trend; my decision to cut and run with a small profit was correct, but I overlooked a major trade.
Lesson: continue to monitor closed-out trades for a week or so and be prepared to re-enter or to reverse.
Conclusions
Today’s chapters have been meatier than expected, though I wouldn’t go so far as to say they were gripping.
- Targets, Stops, Scanning and Record-Keeping are all important topics.
We’ve finally made it to the end of the book.
- I now have the unenviable task of turning seven lengthy posts into a set of lessons and an action plan.
I’ll be back in a few weeks with the fruit of this process.
Until next time.
Mike Rawson
Mike is the owner of 7 Circles, and a private investor living in London. He has been managing his own money for 40 years, with some success.