Weekly Roundup, 19th January 2016

We begin today’s Weekly Roundup in the FT, with the Chart That Tells A Story.
Contents
Oil and the FTSE-100
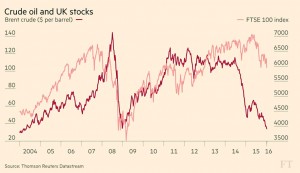
Adam Palin looked at the link between global oil prices and the FTSE-100 index, going back 12 years.
- Brent crude has now fallen below $30 a barrel, down from $115 in mid-2014.
- Meanwhile the FTSE-100 is down at 5,800 – more than 18% down from the peak of 7,100 in April 2015
There are two forces at work to explain the link:
- there are lots of energy-related companies in the index, most notably BP and Shell
- most FTSE-100 companies make a lot of their profits abroad, and any slowdown in the global economy will affect both the oil price and the FTSE-100
So China and the emerging markets slowdown is one half of the problem, with Saudi- and shale-driven over-supply of oil the other half.
It might seem that the worst of the fall in absolute terms is over, but from $30 down to $10 would be another two-thirds fall in price:
- demand has shown some growth, but this may not continue into 2016
- but there is masses of oil already stockpiled, which storage facilities almost at capacity
- and there are no signs of cuts to supply as yet, though the shelving of future development projects will have an impact in the medium term
Other losers from the low oil price include alternative energy firms, while the big winners have been airlines and car makers. Increased disposable income from lower petrol prices should be good for consumer stocks as well.
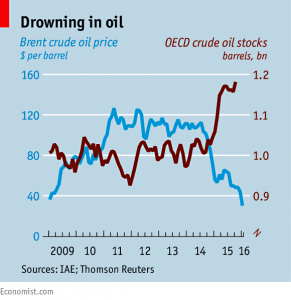
The Economist also looked at the oil price, and where it might go from here.
They reported that some feel that speculation is over-riding supply and demand, and that US derivatives contracts imply a lack of consensus about future prices, with a range for April 2016 delivery from $25 to $56.
Iran is the big question mark on the supply side, with UN sanctions being lifted in the coming weeks. There is also the potential for bankruptcies amongst US shale-oil producers.
Given the high amount of oil already in storage, many industry observers think it will be a year or eighteen months before the bear market is over.
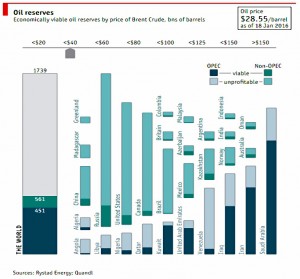
The Economist also had a nice interactive chart (snapshot below) showing how the oil price affects viable and non-viable reserves across OPEC and the non-OPEC producers.
The third oil-related article of the week was back in the FT, where Naomi Rovnick worried that there could be problems ahead for UK dividend payouts.
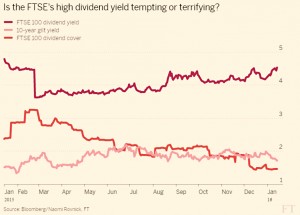
- The yield on the index is up to 4.6%, just off a 12-month high, and the gap between the index yield and bond yields is unusually high.
The problem is that dividend cover – the amount by which the dividend payout is exceeded by the company’s annual earnings – is low.
- The ratio for the entire index is down to 1.5, well below level usually regarded as safe (2 times).
The reason for the fall in the ration – down from 2.2 in June 2015 is that forecast earnings for oil stocks and miners have been cut. Shell and BHP Billiton now have a forecast dividend cover of 1.
FTSE dividend payouts have been historically dominated by three sectors: banks, oils and miners.
- Banks are expected to pay out 22% of the FTSE-100 dividends for 2016
- Oils should provide 19%
- Miners are down to 7% (Anglo-American has already shelved its dividend, and some think that BHP Billiton will do the same)
So the total for the three sectors is still expected to be 48% of the total. As doubts grow about their ability to payout, their share price drops, increasing the headline dividend yield.
Rather than buy the index for yield, a stock-picking approach – selecting for dividend cover as well as yield – might be better.
Or you could just wait for some of the miners to drop out of the index as their market cap becomes too small.
Tax relief on pensions
Josephine Cumbo wrote about the possible changes in the upcoming Budget to pensions tax relief. Sources in the Treasury seem to have been leaking the plans in advance.
The main news is that the Pension ISA approach (TEE taxation) has been abandoned for now, in favour of the simpler change from banded tax-relief (20%, 40% etc.) to a flat rate top-up from the government (which may be 25% or 30% or even 33%, depending on who you listen to).
Setting the new rate at 25% would save £6 bn pa, whereas a 30% rate comes close to the current system, and a 33% rate would cost the government money (so don’t bet on that one).
A few issues around the edges remain uncertain:
- what will happen to salary sacrifice?
- will there be any changes to employer contributions in general, outside of explicit salary sacrifice schemes?
- will the changes be introduced in April 2016, or deferred to April 2017 (seen as more likely)?
It may be that the new flat rate will be branded as a government top up rather than tax-relief, to be reclaimed by pension scheme operators on contributions from taxed income.
- Under such a model it’s possible that employer contributions and gross contributions from pay would no longer be available.
Overall this is good politics, good news for basic-rate taxpayers, and not the worst news for higher-rate taxpayers.
- Pensions (and in particular SIPPs) remain more attractive than ISAs for long-term investors, particularly as you move closer to age 55, when they can be accessed.
UK housing
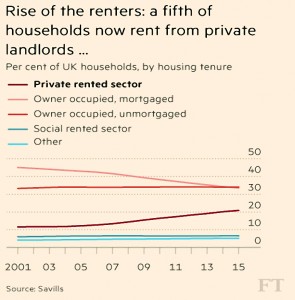
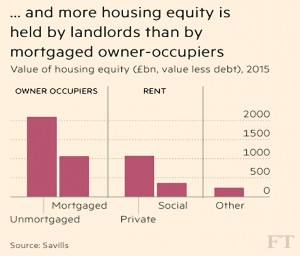
Judith Evans reported that the UK housing market has shifted back to renting, as the housing wealth of landlords overtook that of mortgaged homeowners.
It’s not as dramatic as it sounds, since homeowners without mortgages have about twice the equity of either group.
There’s been a straight swap over the past 15 years from people owning with mortgages to people renting privately instead.
Which means that more is now paid in rent than on mortgage interest – although this might change if / when interest rates rise.
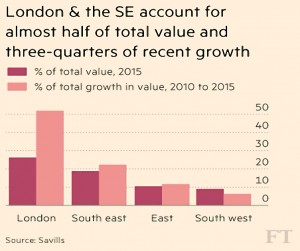
Not surprisingly, most of the recent growth in house equity has been around London and the South East.
- The private rental sector was up by 55% over five years nationally, but up by 90% in London.
- The value of homes owned mortgage free is up only 22% over five years.
An article in the Economist wondered what could be done to fix the UK’s housing market.
The most obvious approach is to build more homes.
- The government target is 200K to 250K homes per year, compared with the current rate of 140K a year.
- The 250K target dates back to a 2004 report which suggested this would cap house price inflation at 1% real (after inflation).
But that depends on putting the houses where they are needed.
- Prices in the south-east – where the land is already intensively developed – have risen twice as fast as the national average since 2009.
- And squeezing in extra infrastructure (schools, parks) is more difficult here.
The newspaper would like to see more done to free up existing capacity, in the form of spare bedrooms.
Recent increases to stamp duty – and the increasing average age of homeowners as more young people rent – mean that the owners of these spare bedrooms have become much less likely to downsize.
- Turnover in the second-hand market is now half what it was in the late 1980s.
Abolishing stamp duty would be expected to increase transactions by 8% to 20% pa.
- Government-backed bridging loans could also help to unlock the market.
It’s a nice idea, but since this is the government that came up with the idea of £150K of stamp duty on a terraced house, I’m not optimistic they will see the problem.
How bad can it get?
John Authers took a look at how bad things might get during 2016.
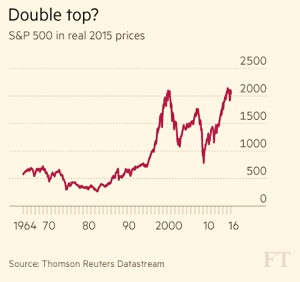
For John, the US might never have left the secular bear market that began in 2000 when the dot-com bubble burst:
- strictly this is to do with whether the market passed its previous peak in real terms
- though the S&P 500 is currently below the 2000 real peak, it did move above briefly in the last year or two
But for most people the questions are:
- will there be a bear market (20% fall from the recent peak)?
- how bad will it get?
We’re almost in a FTSE-100 bear already over here in the UK (18% down), but there’s farther to go in the US (12% down).
And perhaps it’s the wrong question. John says that bears are only serious when they coincide with a recession (two or more quarters of negative growth).
- With the Fed just starting to raise rates to damp down growth, is a recession likely?
- If not, then a 20% fall should be a buying opportunity.
There have been three bear markets during the past 30 years that were not during a recession:
- the 1987 Black Monday crash – a 33% fall with a recovery over two years
- it was a similar story here in the UK, but the other fact I like to quote is that even after Black Monday, the FTSE-100 was higher at the end of 1987 than it had been at the start
- 1998, the Russia and LTCM crisis – a 23% fall recovered in six weeks
- 2001, the US debt ceiling and eurozone crisis – a 22% fall recovered within five months
In all three cases the Fed was forced to ease monetary policy when it wanted to tighten.
- So to be confident about a recovery we need to confident that the Fed will reverse course.
With earning forecasts for 2016 lower than 2015, positive earnings surprises might also spark a rally.
- But good earnings so far have been punished for coming hand in hand with poor outlooks for 2016.
Assuming that a recession doesn’t arrive, the most likely scenario for John is investors pushing stocks down enough (around 20% in total) to persuade the Fed to change course.
Let’s hope that a 20% fall is enough.
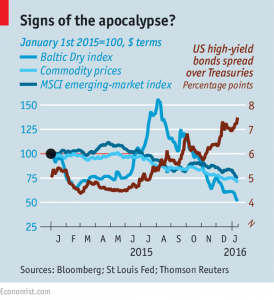
Over in the Economist, Buttonwood updated his article from last week on whether 2016 would be 2008 all over again.
- Larry Summers and Albert Edwards have since added their own warnings to those of George Osborne and George Soros.
A new chart shows several signs of the coming apocalypse:
- rising credit spreads (risky borrowers over the government)
- falling commodity prices
- falling emerging market stocks
- historic lows in the Baltic Dry index (which tracks the cost of shipping goods)
Buttonwood’s conclusions haven’t changed too much. There are risks, but it’s no foregone conclusion that 2016 will be an awful year.
Swiss don’t want tax money early
Enough doom and gloom. Let’s end with a couple of lighter stories.
Izabella Kaminska reported that the Swiss have been turning away tax payments.
Normally, residents of Zug – one of the country’s lowest tax cantons – have been offered discounts for paying their tax bills early.
But now that the Swiss have negative interest rates, it has become too expensive for the cantons to hold large amounts of cash paid in early.
How Switzerland ended up with negative rates is a sad story.
- in the wake of the 2008 financial crisis, lots of countries joined in a collective competitive devaluation – attempting to stimulate growth by making their exports cheaper
- as a “safe haven”, Switzerland’s assets were in demand, and the Franc rose in value
- in 2011, the Swiss National Bank started to mint Francs to buy euros, hoping to keep the exchange rate low
- the SNB ended up with lots of high-risk Eurobonds, since it had to park the euros somewhere
- its own buying was pushing the yields down even further
So the exchange rate floor was abandoned (with a mighty jump that proved fatal to the accounts of many small-time FX traders) and negative rates were adopted to make the Franc unattractive.
Isabella describes this as an example of the paradox of thrift.
- Since you can’t have savings without corresponding debt, you have a problem when everyone wants to save, and no-on wants to (or has the capacity to) save
- you either encourage people who can repay to build up debts
- or you encourage savers to spend instead, boosting demand and wages and other people’s credit-worthiness
The government has to pump money from savers to non-savers.
- This is another version of the financial repression (too-low interest rates) we’ve had for seven years now.
Why women pay more
Tim Harford looked at why women pay more – for certain things at least.
- According to a recent report from New York, razor blades, shampoo, clothes and toys are all cheaper for boys and men.
- Other studies have found similar effects for cosmetics, haircuts and dry-cleaning.
Tim offers three possible explanations:
- cherry-picking – the survey didn’t include things like sports cars and hi-fi, car insurance or night-club admission, all of which men might be expected to pay more for
- higher cost inputs – it may be harder to make women’s clothes or to cut their hair, or to dry clean a delicate blouse
- price discrimination – note that this is not the same as sex discrimination
- rather it’s the idea behind Tesco having a Value range, a Standard range and a Finest range – they each appeal to people who care a certain amount about what they pay for that particular item
- perhaps women are simply less sensitive to prices – men will cross the road to save 10p on a pack or razor blades, but women won’t – they might be too busy, or just care more for quality than price
Tim is sceptical about the cost input argument – why not just charge by the hour for haircuts or dry-cleaning? He points out that restaurants don’t charge men more for eating more.
There are two problems with this argument:
- I don’t pay more to eat in a restaurant than my partner, but neither do I have food left over at the end. Indeed, I usually end up eating some of her food.
- In the case of haircuts for example, it’s not just the hairdresser that’s the input cost, it’s the size, location, decoration and reputation of the salon.
- Women’s hairdressers are nicer, and cost more to make nice.
- The charging by the hour approach has the same disadvantage as the taxi meter – it’s hard to persuade the passenger that you are reaching your destination via the quickest and least expensive route.
But in the end, Tim plumps for price discrimination. That certainly tallies with my own experience.
All companies try to give people the opportunity to spend more on a “better” product. The only way to avoid some of these being pink and sparkly is for women to stop buying them.
I know it isn’t me that’s keeping them on the shelves.
Until next time.


