Weekly Roundup, 2nd August 2016

We begin today’s Weekly Roundup in the FT, with the Chart That Tells A Story. This week it was about midlife renters.
Contents
Midlife renters

James Pickford took a look at trends in the private rental market, and in particular at the increasing number of renters aged over 30.
- 35% of the 25-34 age group now rent, up from 29% twenty years ago
- 37% of the 35-4 age group rent (up from 27%)
Meanwhile the very old and very young are renting less:
- only 3% of the over-75s now rent (down from 9%)
- only 13% of those between 16 and 24 rent (down from 20%)
More of the youngsters are now still living with their parents – there are 3.3M young adults (20 to 34) still living at home, up from 2.7M twenty years ago.
- The key drivers are the massive increase in house prices over the past two decades, and more recently the tightening of lending criteria since the 2008 financial crisis.

Private renting has also increased because council houses have been sold off and have not been replaced.
- Buy-to-let was deregulated back in the 1980s and buy-to-let mortgages are now much easier to get hold of than they once were.
But private renting remains more popular with the young:
- 70% of private renters are below age 45, compared to 36% of those in social housing and 25% of owner occupiers
- only 9% of private renters are above age 65, compared to 29% of those in social housing and 34% of owner occupiers
Inheritance tax

We saw last week how London dominated income tax payments.
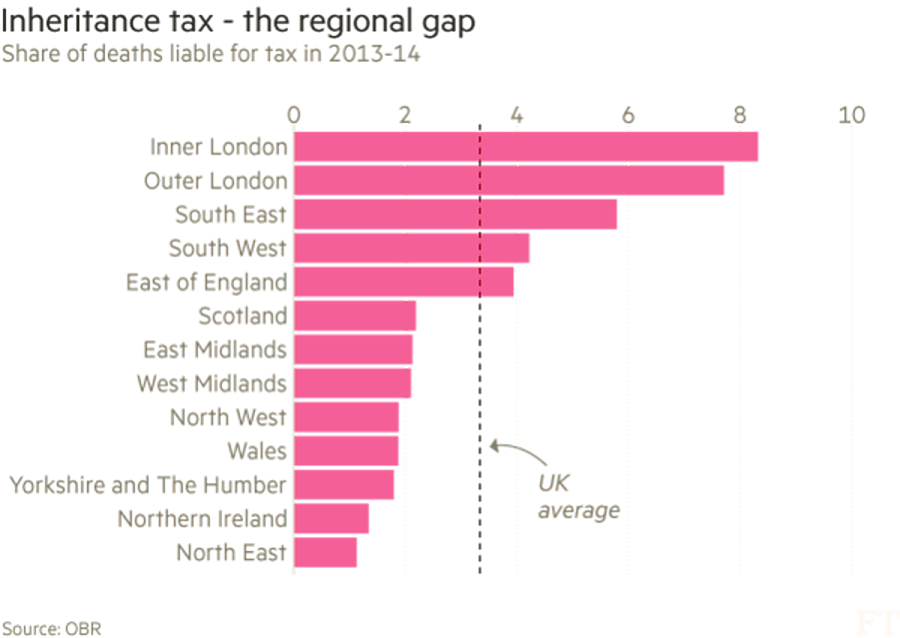
This week, Gemma Tetlow and Naomi Rovnick looked at inheritance tax, which is also dominated by London and the South East.
- 49% of inheritance tax receipts in the year to April 2014 came from those two regions.

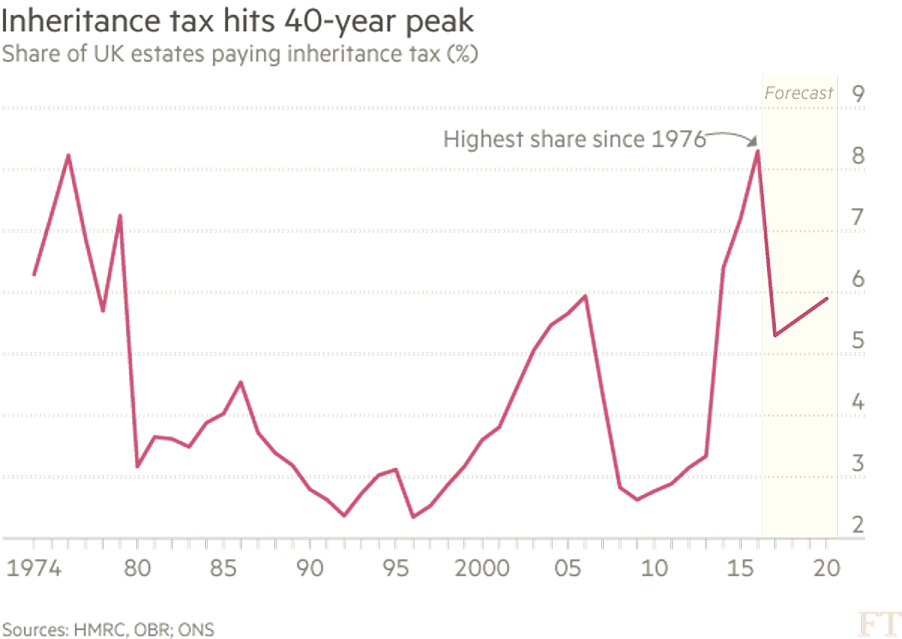
The housing price boom means that more than 8% of estates now pay the tax, the highest figure since 1976.
- These estates have 36% of their wealth in housing, and 30% in securities.
- The tax will raise £4.8 bn this year, a tiny fraction of total government receipts of £717 bn.
Despite being paid by so few, it’s a very unpopular tax, and most recent governments have tried to reduce its impact.
- Many – including myself – see it as double taxation, since the money in the estate has already be taxed once when it was earned.
- It also seems perverse to tax people more for saving for the heirs than for spending money on themselves.
- The counter-argument is that inherited wealth exacerbates inequality.
Interest rate cuts

Neil Collins was worried that the Bank of England might cut interest rates this week, and order more QE (buying of gilts – the BoE already owns a third of them).
The Bank buying more bonds would drive down yields, increasing pension deficits across the board, which in turn would force companies to buy more bonds, using money that would be better invested in productive assets.
Neil would like the government to take advantage of low yields (1.5% for 344 years) and borrow money to invest in small-scale infrastructure projects (roads, council houses, schools and clinics).
- He’d also like to see the vanity projects like HS2 and Hinkley Point cancelled.
I mostly agree. Hinckly is looking very expensive, and I think that a high-speed line from Liverpool to Hull would be more use than one between London and Birmingham.
Alternative energy

Tim Harford’s column was about alternative energy.
Getting rid of fossil fuels is important because it’s the only way to keep greenhouse gas emissions low and avoid destructive climate change.
- But fossil fuels are excellent concentrated sources of energy, and hard to beat.
For the change to happen for commercial reasons, either fossil fuels would have to become expensive, or alternatives would have to become cheap.
- Neither looks likely.
More fossil fuels keep being discovered.
- We’ve used up all the oil that was know about in 1980, but we still have more left than we started with.
- Gas reserves aren’t falling either, and there’s still lots of coal left.
Because the supply of fossil fuels appears in practice not to be limited, suppliers have no incentive to gradually increase the price.
Photovoltaic (PV) solar power is becoming much cheaper, but it’s still more expensive that fossil energy, and it only works when the sun shines (there’s a similar problem with wind energy).
Fossil fuels are also very concentrated, which is why they dominate transport.
- Competing electric fuel cells are currently eight times more expensive, and it’s becoming clear that nuclear power plants are too expensive to build (and to decommission).
Tim’s solution to the puzzle is to introduce a carbon tax.
I can see that this is a classic example of an externality that requires government intervention in a market, but there are a couple of problems:
- global coordination would be needed, and not every country is equally motivated to give up on fossil fuels
- it would need to be a hell of a tax to close a price gap of eight times.
Emerging market funds

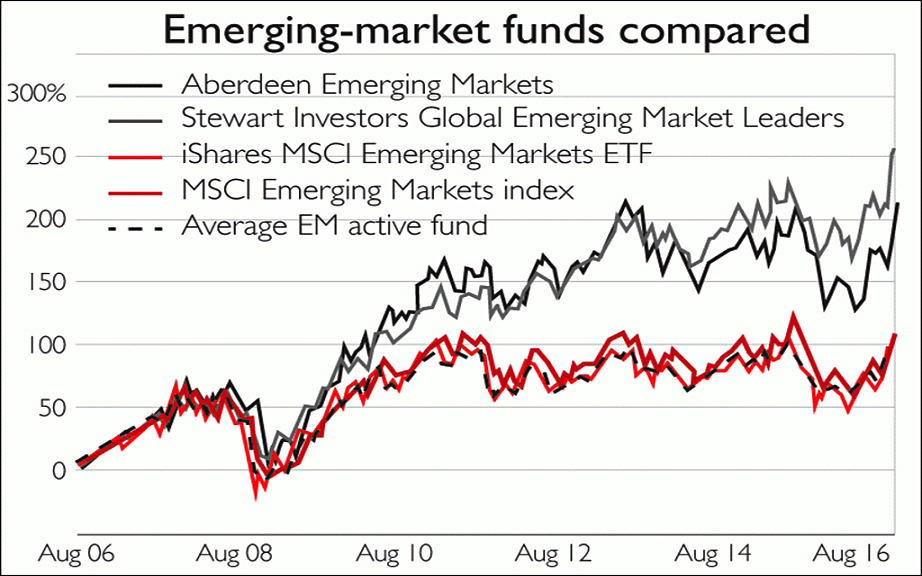
Over in MoneyWeek, Sarah Moore compared the use of passive and active funds in emerging markets.
- Since these markets are less liquid and efficient than developed world markets, many investors (including myself) like to access them by using active funds (investment trusts, say) as well as passive vehicles.
Sarah made use of an article in the Daily Telegraph which showed that most EM funds (21 out of 31) didn’t out-perform a low-costs tracker over 10 years.
A couple of funds did really well but on average performance was very similar to the tracker (and to the EM index itself).
- So the funds weren’t taking advantage of their ability to invest in the 9,000 companies – many of them small and fast-growing – that lie outside the index (made up of 836 companies).
While this is an interesting result, it can be interpreted in more than one way.
- The cynic in me wonders whether it might just be evidence of widespread closet tracking in the sector.
It’s good to know that using a cheap ETF won’t necessarily lead to underperformance, but I would still be tempted to supplement it with a few of the best-performing active funds.
US public sector pensions
In the Economist, Buttonwood looked at the effect that regulation has on the investment strategies of US public sector pension plans.
- The key driver of a pension fund’s liabilities is the discount rate used to shrink future payments back to the present.
It’s the low yield on government and corporate bonds that has caused so many pension funds here in the UK to fall into deficit since 2008.
- In the US, private sector pension funds use corporate bond yields as the discount rate, meaning that they too are now in deficit.
US public sector funds are allowed to use the expected returns on their assets.
- In theory this is fine, but the side-effect is that investing in riskier assets means that the discount rate goes up, the liabilities come down and the amount that needs to be contributed to the pension pot also shrinks.
- This is attractive because the only sources of funds they have are employee contributions and the public purse (either more taxes, or fewer services).
But it conflicts with the generally accepted idea that as a pension fund matures (more of its members reach retirement) it should transition to investing in less risky assets (using a liability-matching approach).
- The private sector funds in the US do this, but the public sector ones do not.
- Buttonwood quotes a paper which found that the proportion of political and work trustees on a pension predicted the extent to which it adopted this short-term approach (of more risky assets).
- To make matters worse, the public sector funds are also underperforming both their benchmarks and the return targets that they set themselves.
This is another interesting finding for me.
- Using only bond yields to discount liabilities makes UK corporate pension scheme deficits appear larger than they are, and I would like to see the return on a multi-asset portfolio used instead.
But the lesson from America is that this rate can’t just be chosen by the fund itself.
- It needs to be a standard across the industry, with a range of rates chosen to reflect differing stages of pension fund maturity, and hence different asset allocations within the portfolio.
Then the fund would be free to choose its own asset allocation, without that affecting the size of its liabilities.
We’ve commented before on the trend for technology companies to come to market much later – and at much more extended valuations – than they used to.
- From four years during the dot-com boom, the average age of a company at IPO is now eleven years.
This makes if difficult for investors other than private equity and venture capital to get involved in “unicorns” and the like.
- It also means that staff at these companies can’t profit from the shares they’ve been given as incentives.
In response to this problem, the Economist reported that secondary markets have been established where insiders can sell shares to outsiders.
- SharesPost and SecondMarket were the first, catering to Facebook primarily.
- Now new entrants like EquityZen and Equidate are closing deals much faster, and with fees of around 5% to each side of the trade.
If you fancy buying some unicorn shares, and you can demonstrate that you are an accredited (ie. rich) investor – roughly meaning that you have $1M in investments outside your home – then head on over to their websites and take a look.
Low returns
Via a tweet from Meb Faber, I came across Robin Wrigglesworth’s blog this week.
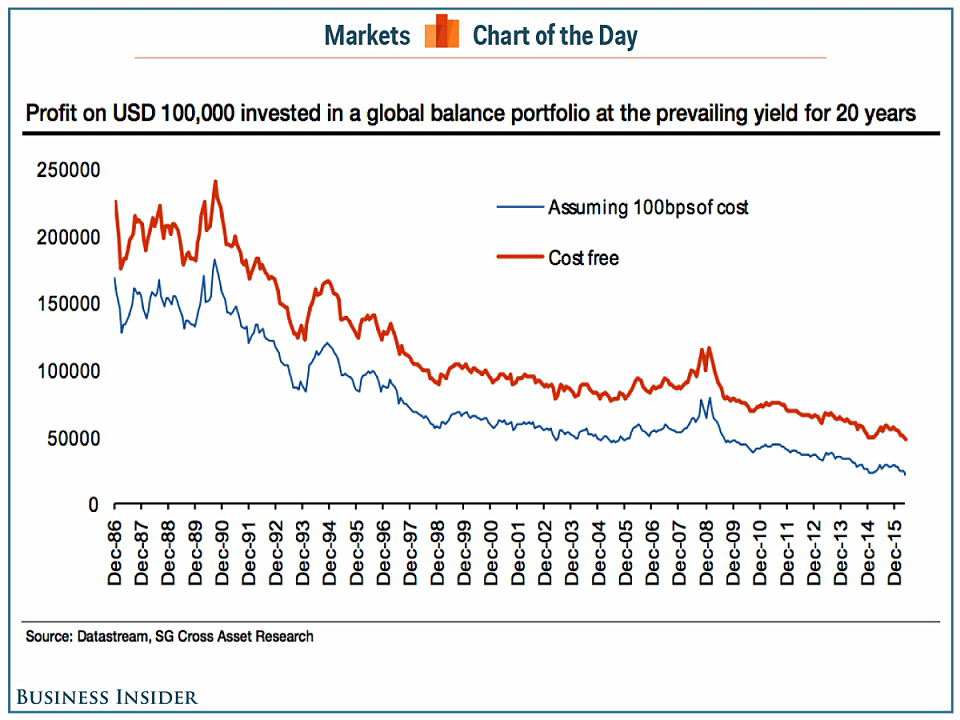
- He referenced a paper from Andrew Lapthorne at SocGen called “The Death of Investment”.
Andrew noted that the 20-year return on a balanced portfolio of $100K (50% equities, 40% government bonds, 5% corporate bonds, 5% cash) has fallen from $150K in the 1980s to $60K ten years ago to only $22K now.
Despite this, State Street surveyed 400 institutional investors managing $1.2 trn between them, and discovered that they expected long-term returns of 10.9% pa.
Quite a disconnect.
Creative destruction
Back in the Economist, the Free Exchange column looked at the unequal distribution of gains from growth.
- When old industries are disrupted, the gains should make everyone better off, even the displaced workers from the old industries.
- New jobs should appear – in new industries – for these workers to fill.
A new paper looked at jobs in Europe and found that in the decade to 2010, 10M jobs were destroyed through automation and 9M new jobs were created.
- The spending of the extra wages and profits in the local economy should have a “multiplier” effect, leading to net job gains (potentially another 12M jobs).
But this depends on profits being retained in Europe.
- If they flow abroad, multiplier jobs created would be only around 2M.
Another paper looked at the decline in US business dynamism.
- More jobs are now concentrated in older, larger firms than in new dynamic “transformational” firms.
It seems that young adults are now less likely to switch jobs and move to new cities than they were, which probably impacts their long-term career prospects.
- Occupational licensing (red tape and bureaucracy) appears to hamper mobility, as do restrictions on land use in popular and productive areas.
But the paper suggests another factor – that firms don’t need to compete for the best workers, since they have less reason to compete at all.
- Reduced competition and dominance by larger firms is good for profits, but means that there are fewer good job offers in remote cities.
Free trade
The Economist also looked at the uneven impact of free trade.
- Britain is more open to trade than most countries – its trade deficit is now 7% of GDP – but it is also bad at coping with its impacts.
The debate in the UK around globalisation usually focuses on immigration – this may change as the Brexit negotiations progress – but the effects of trade are just as serious.
Britain as a whole gains from trade, with GDP probably 8% to 10% larger as a result of 40 years inside the EU.
- But the gains are not spread equally and there is evidence that trade with countries like Vietnam and China can depress wages for the low-skilled.
- There are also accompanying social problems, including higher rates of mental illness.

The pain is also concentrated geographically.
- Places like Blackburn, Nottingham and Port Talbot have been particularly vulnerable to imports.
- Areas where manufacturing makes up more than 20% of the economy have generally been badly affected.
- These areas were also prone to vote for Brexit.
Germany and America are responding to the same problems with re-skilling programmes for those affected, but these are lacking in the UK.
- We spend one-fifth of the amount (as a share of GDP) that Germany does.
- The main UK scheme doesn’t appears to be monitored, or to report figures on its success (or otherwise).
Globalisation’s elephant chart
And finally, here’s an old chart I spotted on Medium, from a report by Harvard Business School, which I think was quoting a World Bank paper.
- The author of the graph is Branko Milanovic
- It shows the gains from globalisation over the twenty years from 1988 to 2008 (before the financial crisis) by income percentile.
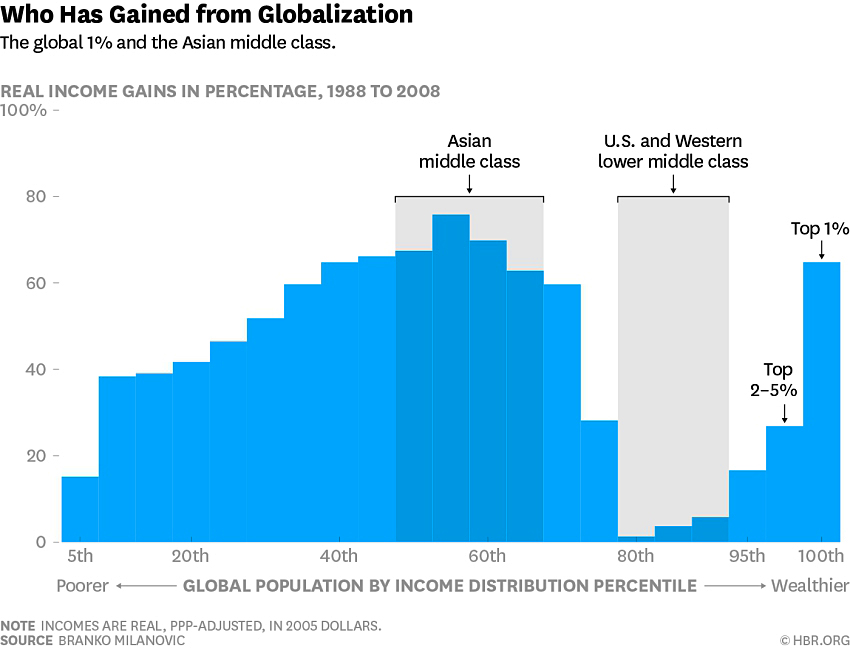
I like this chart so much that I’ve got two versions for you.
It’s become known as the elephant chart because of its shape, and I think it explains both Brexit and the rise of Trump in America.
- The poorest half of the globe (apart from the very poorest 5%), and particularly the 40th to 60th percentile (basically the Asian middle class) saw gains of 60% to 70% in this period.
- The top 1% globally also did this well.
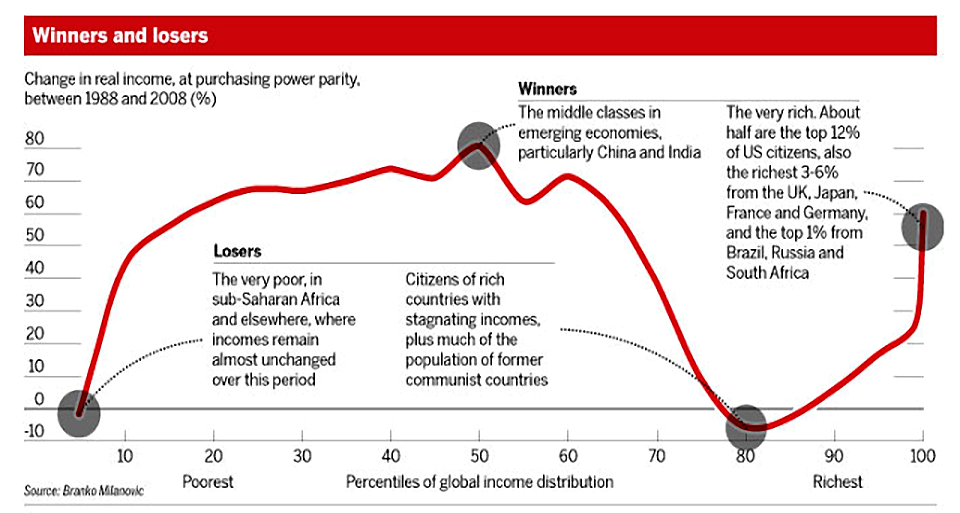
But the 80th to 95th percentile – the Western lower and middle classes – saw almost no gains for twenty years.
- I’d love to see an updated version of the chart, but I suspect that things haven’t changed very much.
Until next time.
Mike Rawson
Mike is the owner of 7 Circles, and a private investor living in London. He has been managing his own money for 40 years, with some success.