The Generation of Wealth – Resolution Foundation

Today’s post is about a report from earlier this year by the Resolution Foundation. It’s called The Generation Of Wealth, and it’s (mostly) about wealth differences between generations.
Contents
Overview
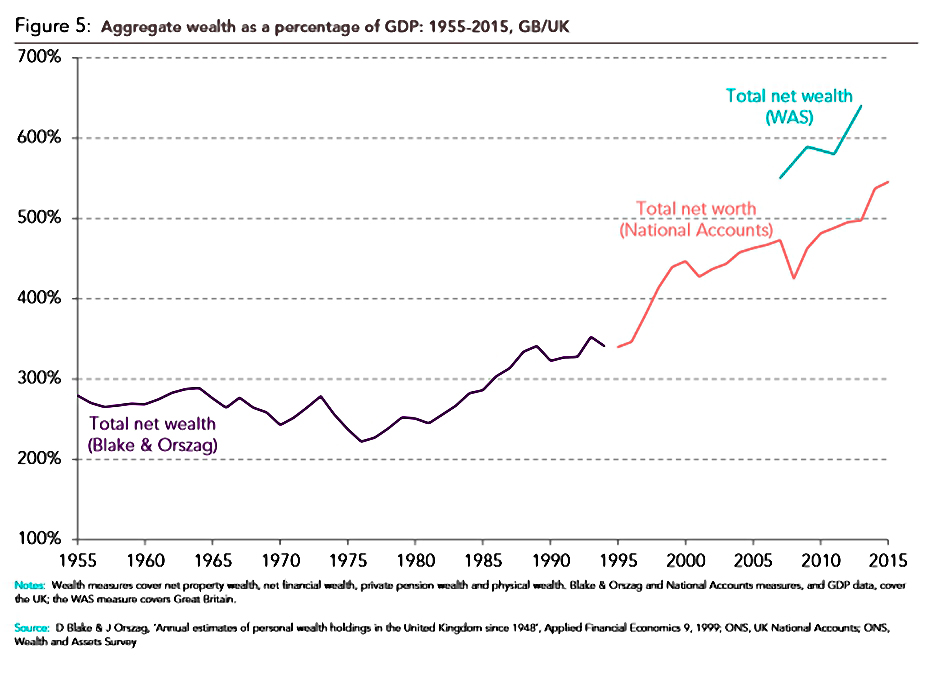
The Resolution Foundation (RF) reports that family wealth is now up to £11 trn (from £9.9 trn before the 2008 crisis).
- This is six times GDP.
A lot of this comes from house price rises since 1995
- and another lot comes from pension wealth
Wealth is (obviously) not equally shared.
- The top 1% held 60% of wealth in the 1920s, but by the 1970s this had fallen to only 20%.
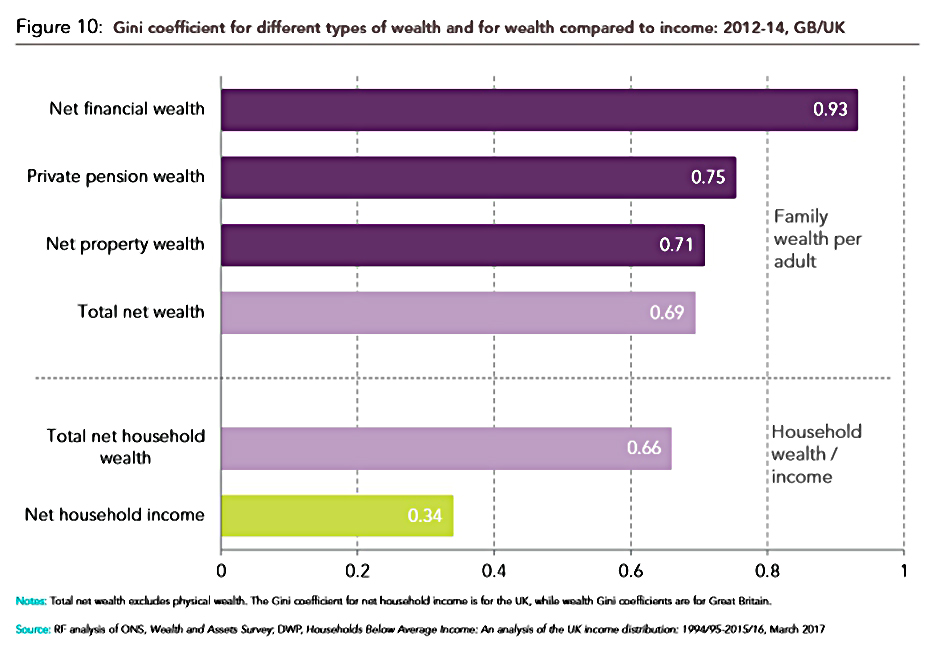
- Wealth inequality is double the level of income inequality (which gets more media coverage).
I don’t think this bias is surprising, since income is (mostly) derived from actions within a particular year (mostly work), whereas wealth represents a lifetime of good and bad decisions.
- So wealth inequality is both more understandable and at the same time less easy to explain concisely.
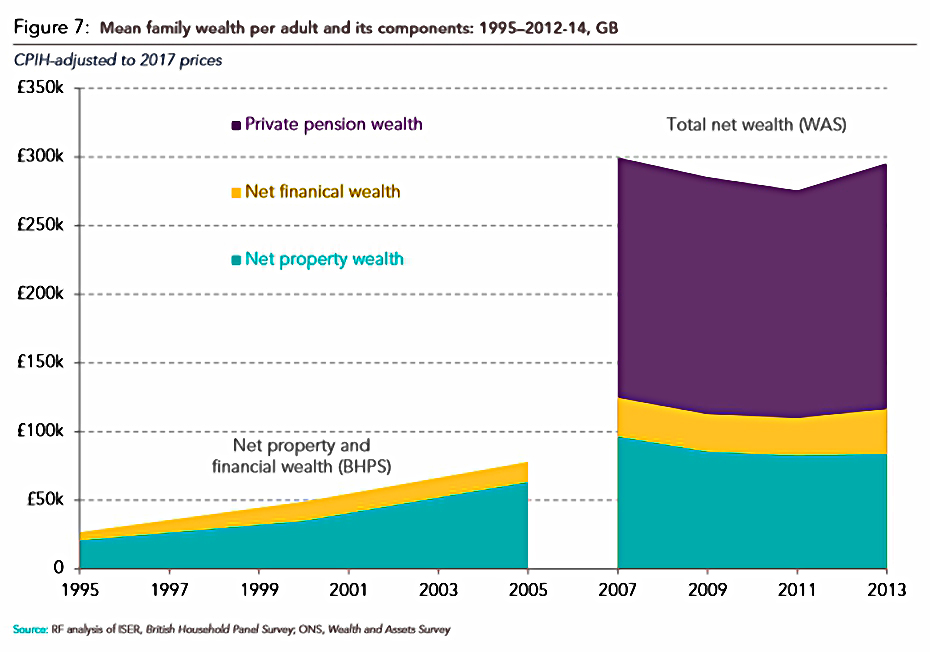
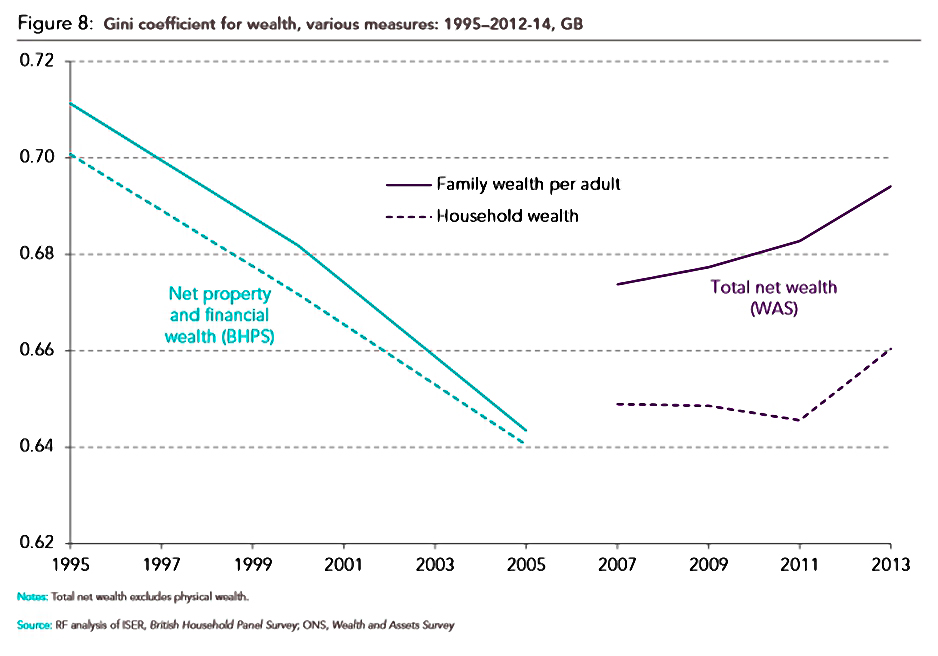
Aggregate wealth has grown since 2006, but average wealth per adult has fallen from £99k to £84K (presumably because of a rising population).
- Wealth inequality has risen during this period (Gini from 0.67 to 0.69).
Sources of wealth
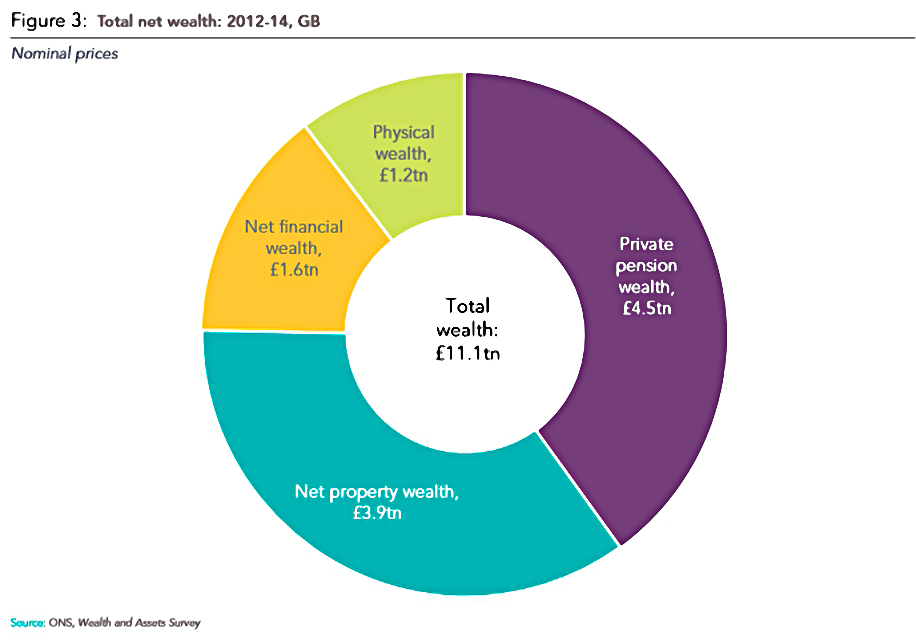
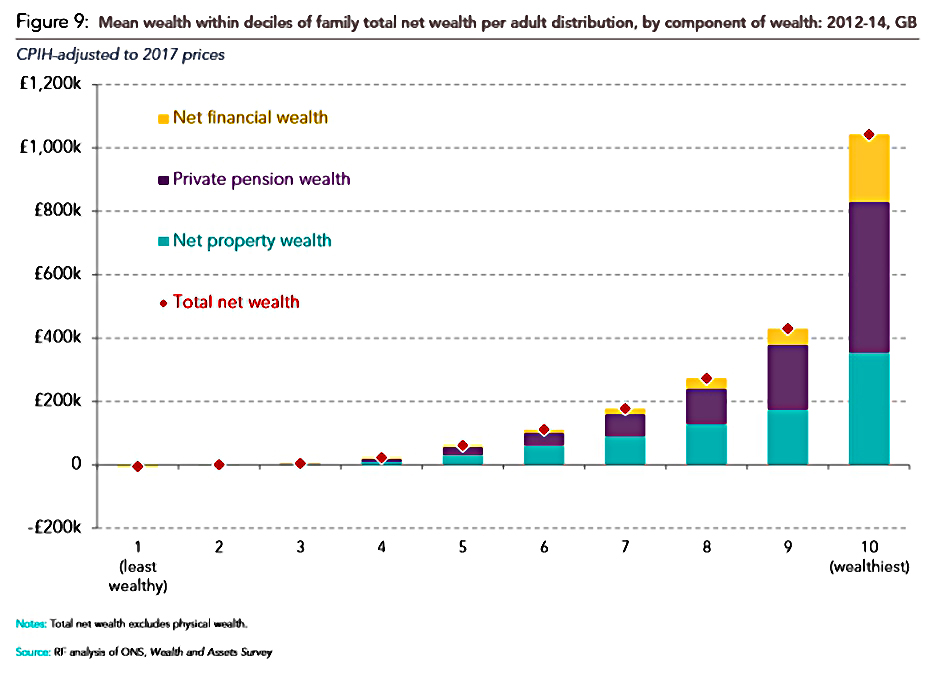
Property (one-third of total wealth) is the biggest explanation of the changes the RF observes.
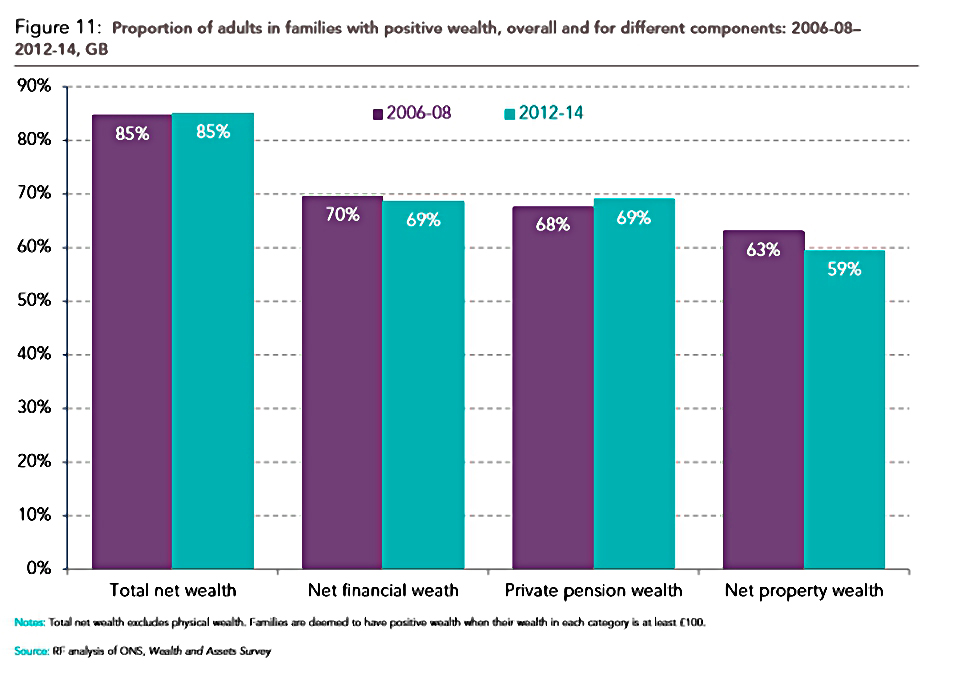
- Home ownership, which rose for most of the 20th century, is now falling, particularly within the poorer half of the population (down 12% here).
- Home ownership amongst the wealthiest 10% of adults continues to rise.
Pension wealth makes up 40% of total wealth, and is unevenly distributed.
- But auto-enrolment into workplace pensions is beginning to reduce inequality.
The RF’s third contributor to wealth is “financial wealth” – this is everything that isn’t a pension, house or physical asset.
- The total here is smaller than for pensions or property, but it’s the least evenly-distributed.
Physical assets make up the rest.
Geography
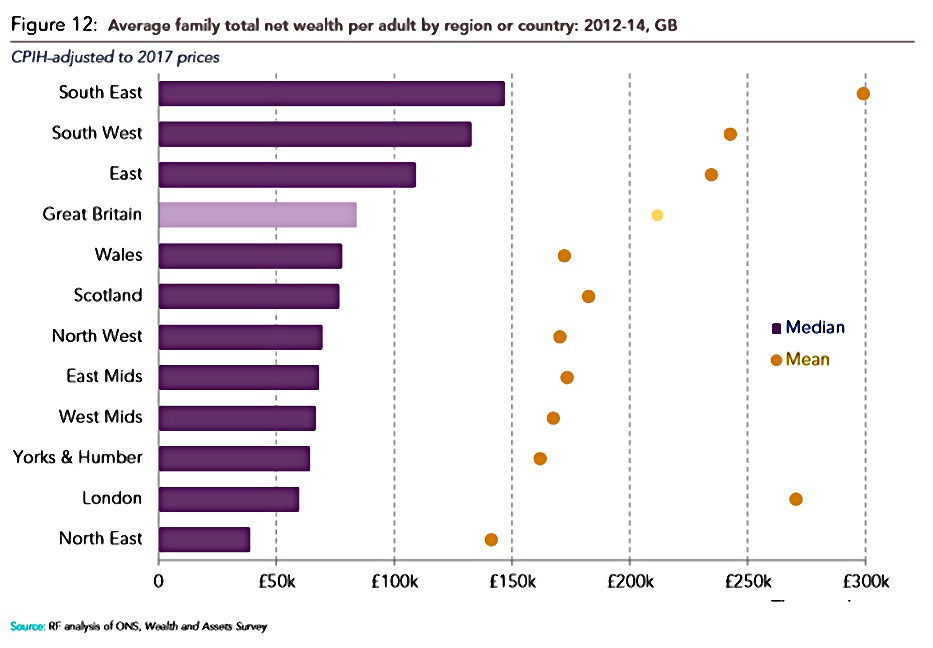
The RF also comments on the geographical distribution of wealth.
- Surprisingly, London is the second-poorest region, because of low home ownership and the youth of its population.
Generations
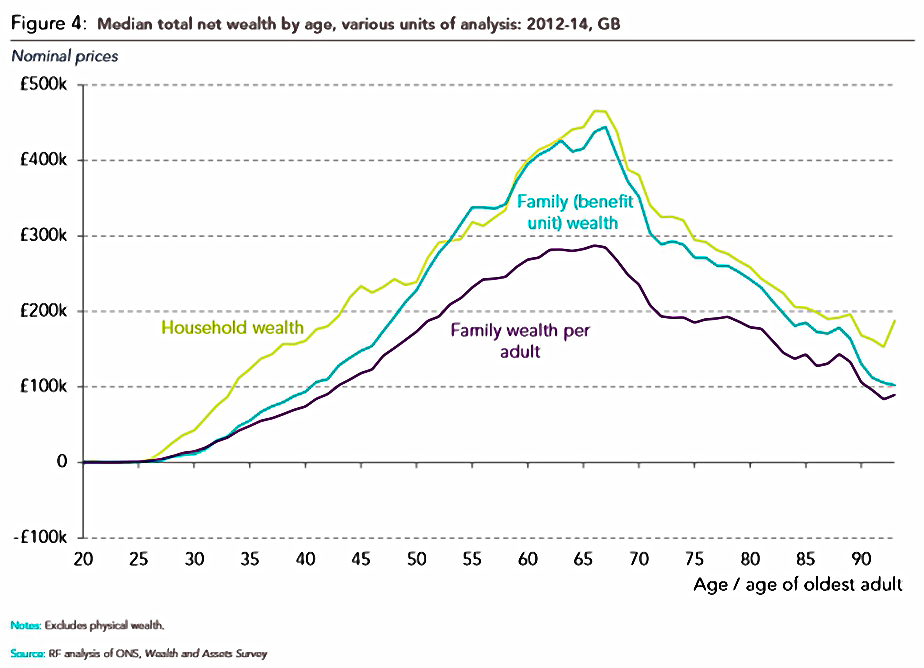
The RF is particularly interested in the wealth accumulation problems of younger people, because houses are so expensive, but there are really three generations involved:
- old – house & DB pension = rich
- middle – house & DC pension = average
- young – no house, just DC pension (or more likely an ISA) = poor
The boomers own more than 50% of the nation’s wealth whereas millennials own only 2%.
- This is not surprising (old people are always richer), so the RF uses cohort analysis to investigate further.
- Cohort analysis involves comparing people from different generations at similar ages.
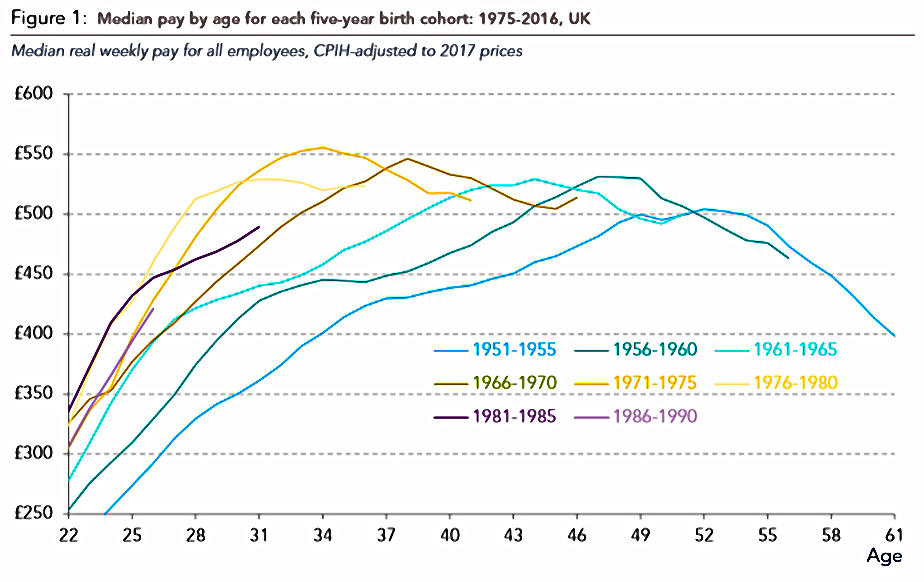
Generally, people do better than those who came before them, but the picture is more complicated for millennials:
- they have a higher income than previous generations
- but they are not accumulating wealth as quickly
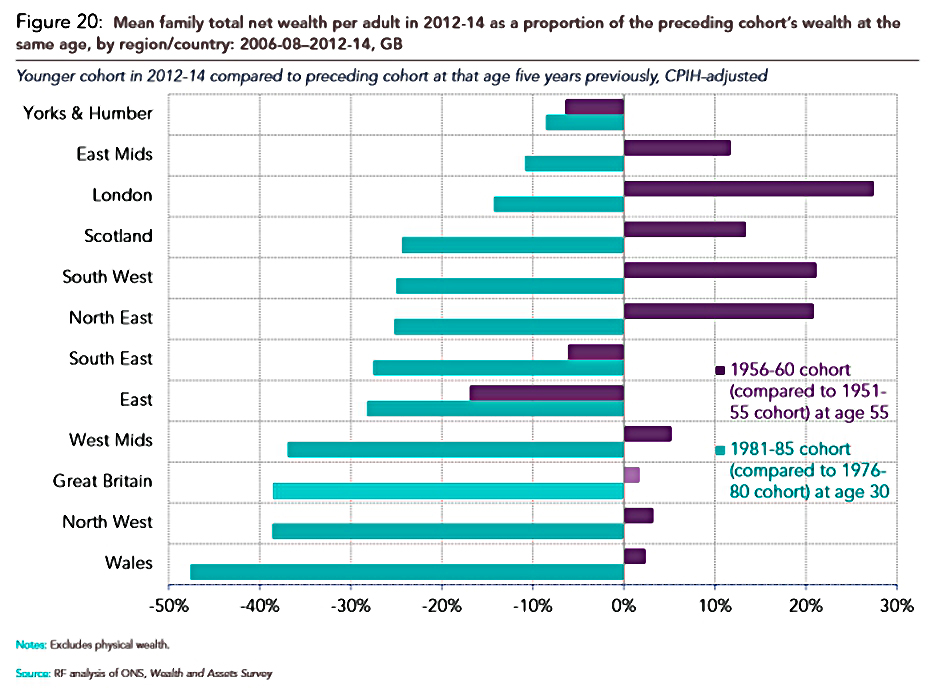
People born between 1981 and 1985 have half the wealth at age 30 as people only five years older.
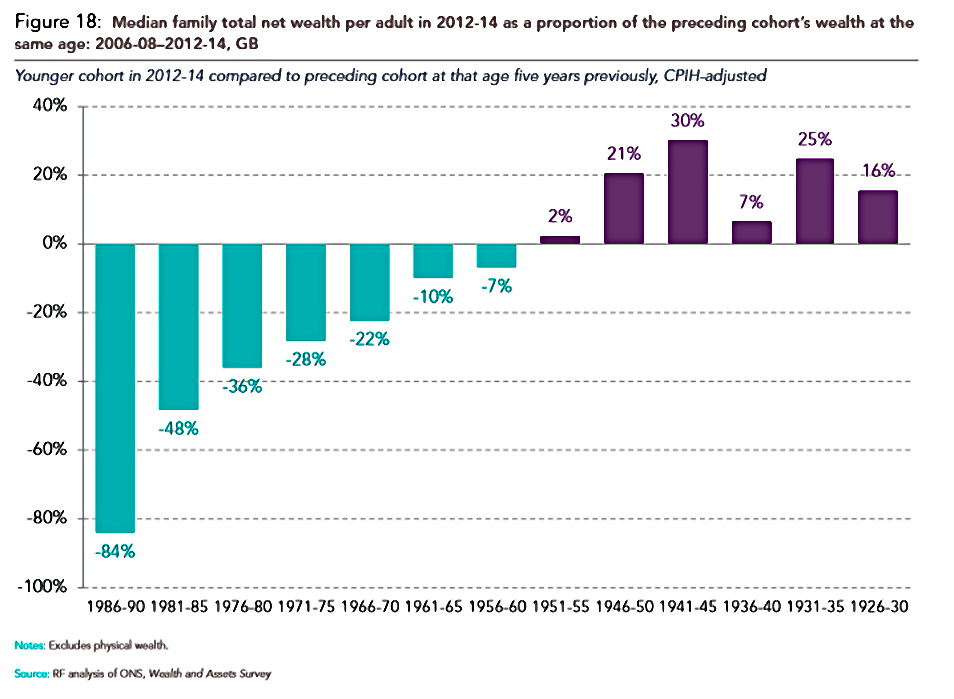
This trend stretches up as far as the youngest boomers, those born between 1956 and 1960 (I am part of this group).
- Even they have less money (by 7% at age 55) than those older than them.
- The oldest boomers (1946-50) had 20% more at 55 than those five years older.
The RF identifies lower saving rather than more debt as the cause of these trends.
- Younger cohorts have lower debt.

The key gains on DB pensions accrued to those born between 1946 and 1960 (I missed out myself) with the overall tipping point into doing less well located in 1966.
- The RF point that people younger than this not only have smaller pensions, but actually have greater needs (from increased life expectancy) as well.
- So the gap is bigger than it looks.

National home ownership peaked in 2004, but generationally, those born in the 1940s have done the best (in terms of percentage ownership).
- Every subsequent cohort has lower ownership at the same age (as the age of first-time buyers creeps upwards in the face of higher prices and larger deposits).

Inequality within generations
Wealth inequality within generations has been increasing for cohorts born since 1960s, largely because of shifts in property wealth.
- Poorer millennials and members of generation X have no property wealth.
Pension wealth (particularly DB pension wealth) is another factor.
- Poorer families stopped increasing their pension wealth from the late 1950s cohort, whilst richer families pensions gains continued until the late 1980s cohort.
Decumulation
The RF notes that the 1930s cohort spent 40% of their wealth when in their 70s (2006 to 2014).
This is less than the RF expect, and they have two interpretations:
- It is difficult to run down property wealth.
- Assets are “earmarked for purposes other than just a retirement income”.
I assume this means bequeathing money to descendants, and the RF’s wording implies that they disapprove.
Active vs passive
The RF likes to qualify wealth gains into active and passive.
- Active behaviour includes saving a deposit, or putting money into a savings account.
- For the RF, gains on these savings are passive or “windfall” gains.
This is nonsense, and evidence that the RF does not understand the process of investment.
When you buy a “cheap” asset which later becomes more expensive (eg. houses) it was originally cheap because most investors (the market) didn’t see the future gains coming.
- They thought the asset was fairly priced.
This is the nature of investment.
- We buy things that we think will increase in value, or at least will preserve our purchasing power through changes in economic conditions.
The snowball effect of compounding means that savings, while crucial at the start, become ever less important than the annual gains on your assets.
- To think otherwise is naive.
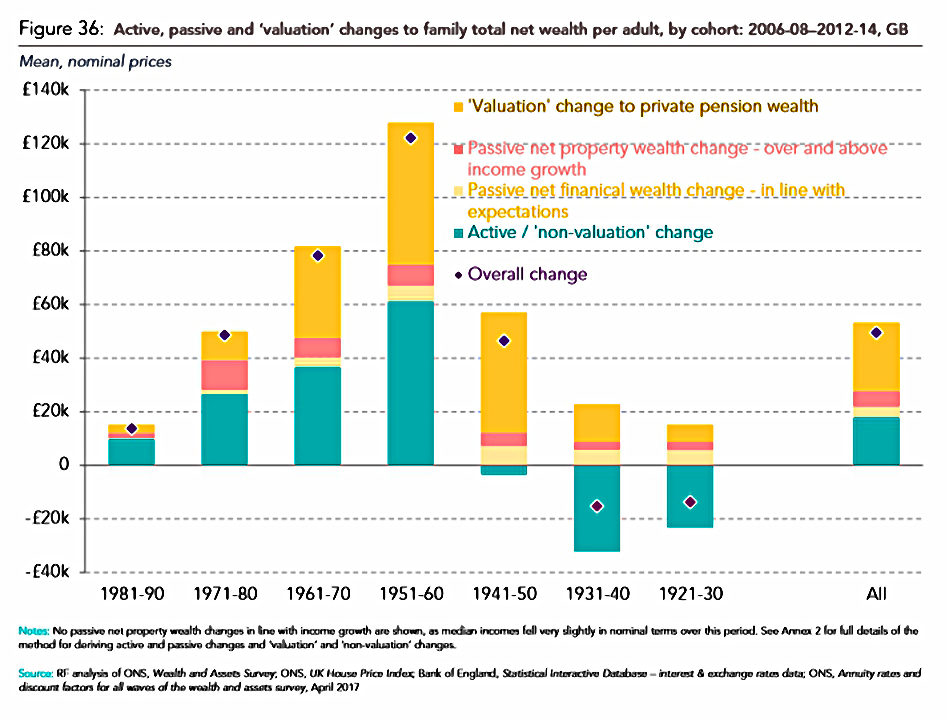
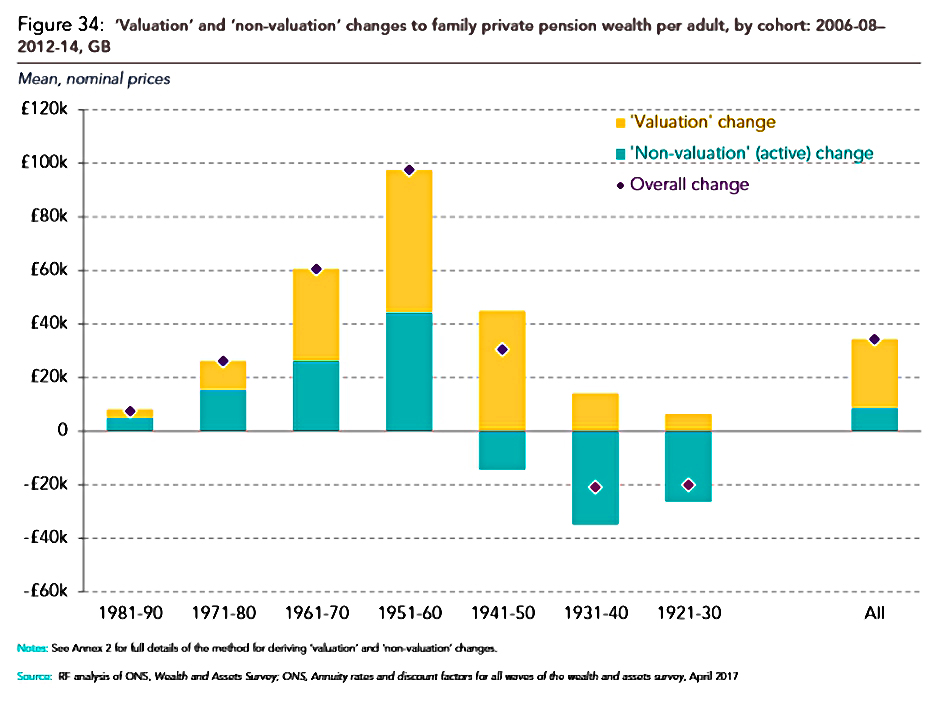
The RF attributes most of the increase in property wealth and pensions wealth to these “passive” gains:
- For property, an unexpected increase in prices (82% passive).
- And for (DB) pensions, an unexpected decrease in interest rates.
In fact, interest rates are at the bottom of both moves.
- Though the transformation of London into one of the leading global cities has also underpinned a property boom centered around the city.
We currently have historically low interest rates, and low interest rates lead to high asset prices.
- High asset prices benefit the rich, because they have more assets.
- And these asset owners also tend to be older.
I spend my working (retired) life trying to work out which assets are most likely to rise in value.
- When they do go up, the gains are down to my research.
They are not “windfall” gains.
- Despite what the RF says, I have earned them.
The same is true of property.
- I spent four years looking for the right house to buy at the right time, in an area that I was confident would progress.
- Few of my friends did the same, and they mostly have less valuable houses as a result.
This is not an accident.
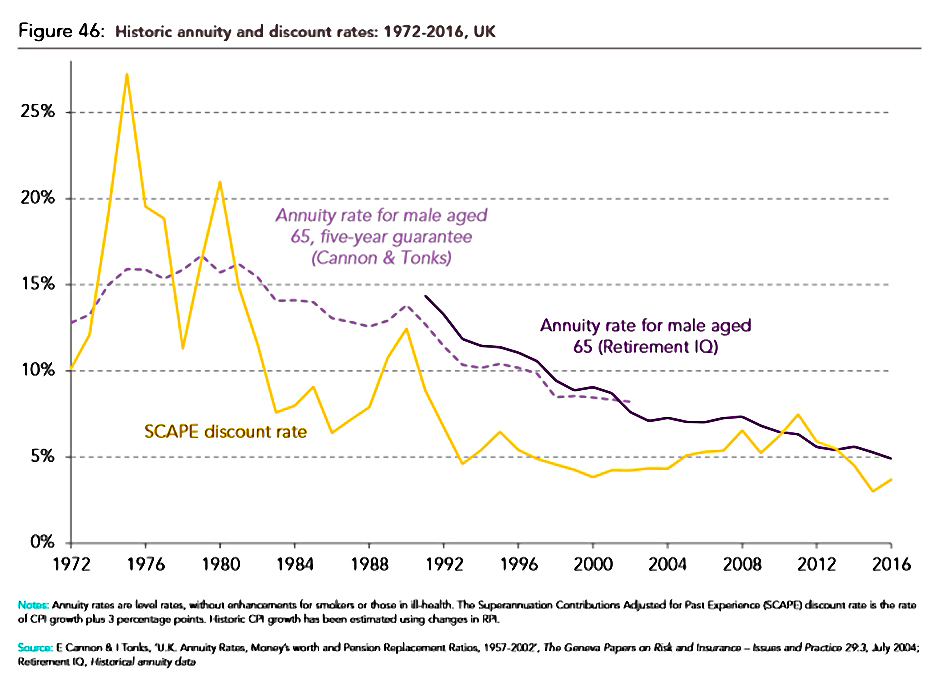
It’s true that nobody predicted these interest rates, and the dramatic effect on DB pension valuations is enormous.
- But the pension payments to the beneficiaries (I am not one of them, to any material extent) are unchanged.
- What has changed is the cost of providing these payments from a pot of (low-risk) assets.
- This is like a change in FX rates – the pound may buy less abroad, but it’s basically the same at home (“this will not affect the pound in your pocket”).
Despite their outrage, the variation in “windfall” gains calculated by the RF are modest:
- Those born in the 50s gained an average £80K from property and £45K from pensions.
- Those born in the 70s gained £35K and £10K respectively.
So the difference over 20 years is £80K, or £8K a year.
More pertinently, the RF points out that now these moves have occurred, they are unlikely to be repeated to the benefit of younger generations.
- Indeed, some reversion to the mean is more likely, especially after inflation is taken into account.
And even if they were to repeat, a lower proportion of younger cohorts will own the benefiting assets at the relevant age point.
- DB pensions have disappeared outside the public sector, and fewer young people own property these days.
Taxation
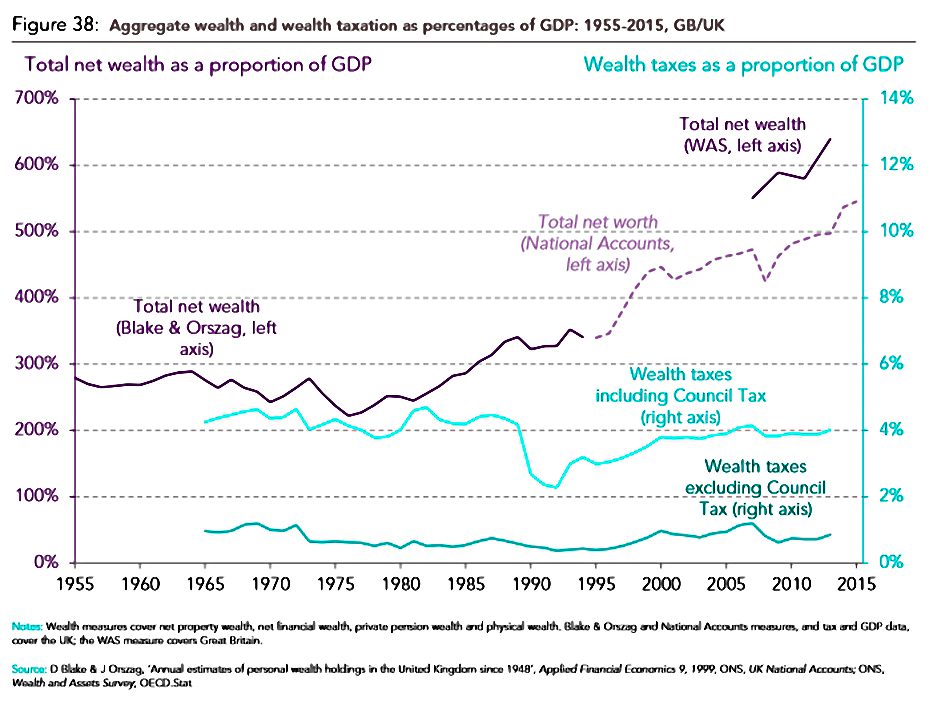
The RF notes that despite a rise in wealth compared to GDP, the tax raised from it is no higher than the 1980s.
They want this to change and they would like to see measures which reflect not just the “amount of wealth” but also:
- Whether the wealth comes from active saving or “windfalls”, and
- Inequality between and within cohorts.
They at least concede that this means that boomers who dodged the “windfalls” should not be punished.
But they also want the increased taxation to support “asset accumulation for younger cohorts”.
- That sounds like ageism to me.
Details of proposed policies are scant at the moment, but they “will be explored in more detail in subsequent reports [by the RF] for the Intergenerational Commission”.
Conclusions
Despite writing a 92-page report about wealth, the RF doesn’t really seem to be in favour of it.
- Particularly when it is not evenly distributed.
They describe themselves as a “think-tank that works to improve the living standards of those in Britain on low to middle incomes”, so I guess that’s not surprising.
- They spend a lot of their time begging for more welfare benefits.
- And they seem to have it in for us oldies.
They make some good points about the drivers of changes in wealth over the past few decades, even if all it really amounts to is “low interest rates make asset prices rise and DB pensions expensive”.
- But their interpretation of what this means is naive, and their recommendations are skewed by their left wing agenda.
Until next time.
Mike Rawson
Mike is the owner of 7 Circles, and a private investor living in London. He has been managing his own money for 40 years, with some success.