Weekly Roundup, 28th November 2017

We begin today’s Weekly Roundup in the FT, with the Chart That Tells A Story. This week it was about dividend hero investment trusts.
Contents
Dividend heroes

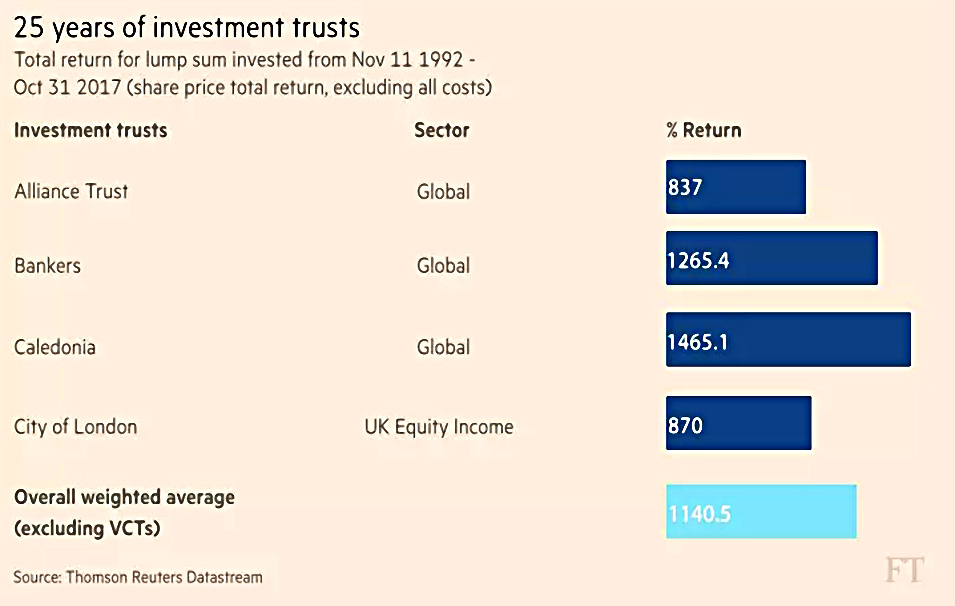
Ed Bowsher looked at the four investment trusts that have increased their dividends for 50 years in a row:
- Alliance Trust
- Bankers
- Caledonia, and
- City of London
The chart was more of a table this week, simply listing the trusts and their total returns over the past 25 years.
Regular readers will know that I’m not a member of the dividends cult – it’s the compounding of returns that makes dividend reinvestment successful, not the source of the reinvested cash.
- And there’s no need to reinvest in the stock or fund that provided the money in the first place.
In the case of the investment trusts, the constant increases result from the use of a “revenue reserve” fund, which smooths returns.
- In good years, the IT pays out less than the dividends received, so that it can top them up in bad years.
And if the revenue reserve runs dry, since 2012 trusts have been allowed to sell shares to fund dividends.
- This is obviously not sustainable in the long term.
Two of the four heroes have underperformed the average IT over the past 25 years, and two have outperformed.
Robo advice

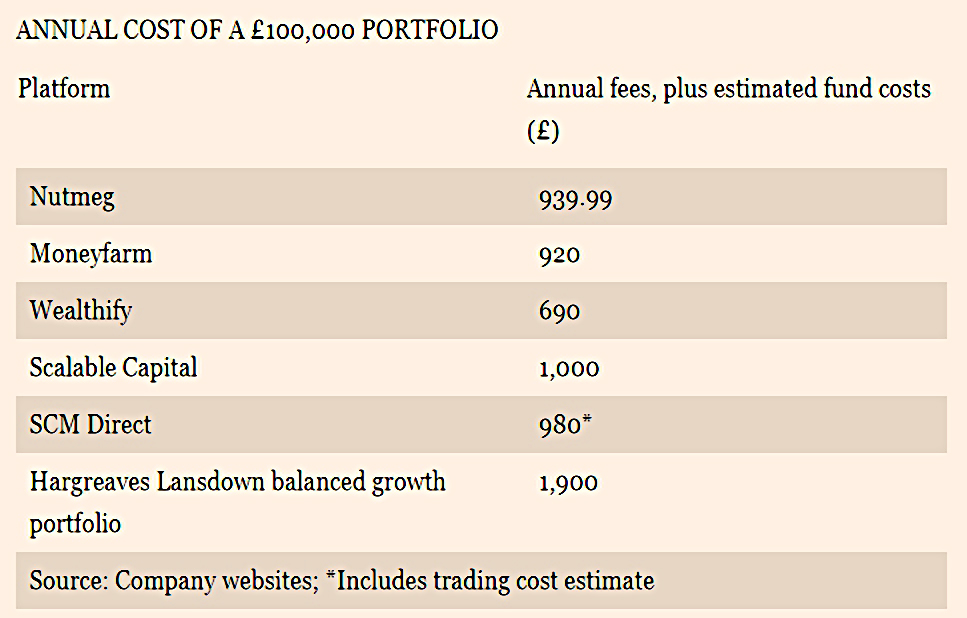
Kate Beioley looked at the state of the Robo Advice market, as Nutmeg revealed that it has passed £1 bn in assets under management.
- It has 49,000 customers, meaning the average pot size is around £20K.
- One their of assets are in accounts that are larger than £100K.
In contrast to their hipster millennial image, their average customer is 41 years old.
- But Nutmeg is still not making a profit.
It costs £200 to £500 for a robo advisor to acquire a new customer.
- At 1% pa on a £20K portfolio, that’s one to two and a half years of fees.
Amidst fears that the sectors will need to consolidate to become profitable, many of the robo advisors now have backing from large firms:
- Scalable Capital is backed by BlackRock
- Nutmeg is part owned by Schroders
- Aviva owns Wealthify, and
- MoneyFarm is backed by Allianz.
A billion pounds sounds like a lot, but the entire Robo Advice sector has only 1% of the UK market.
- Hargreaves Lansdown alone has 43% market share.
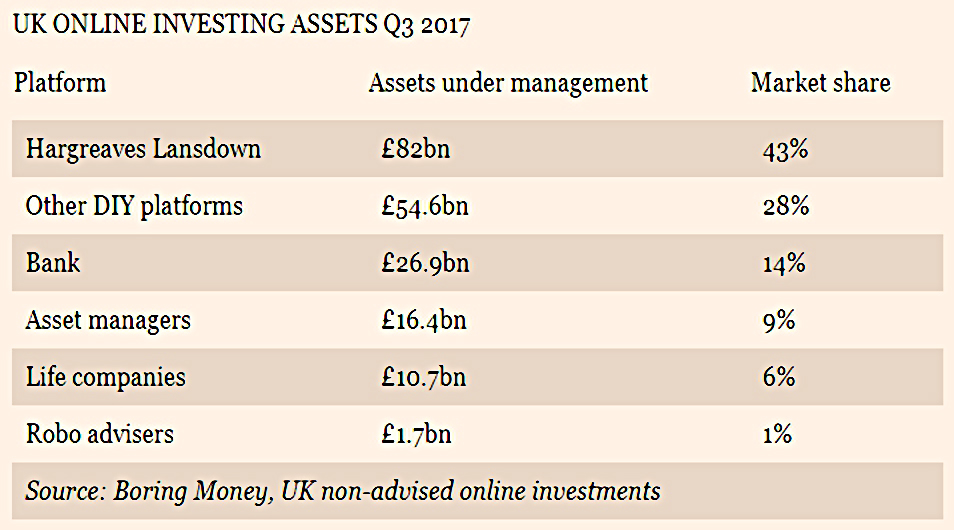
This is despite HL costing around double what the Robo Advice platforms charge.
- Note that DIY investing is missing from the table below, and would cost around £350 to £400 pa, far less than Robo Advice.
Budget reaction
We covered the budget last week, but there was no shortage of reaction pieces if you’d like to read more.

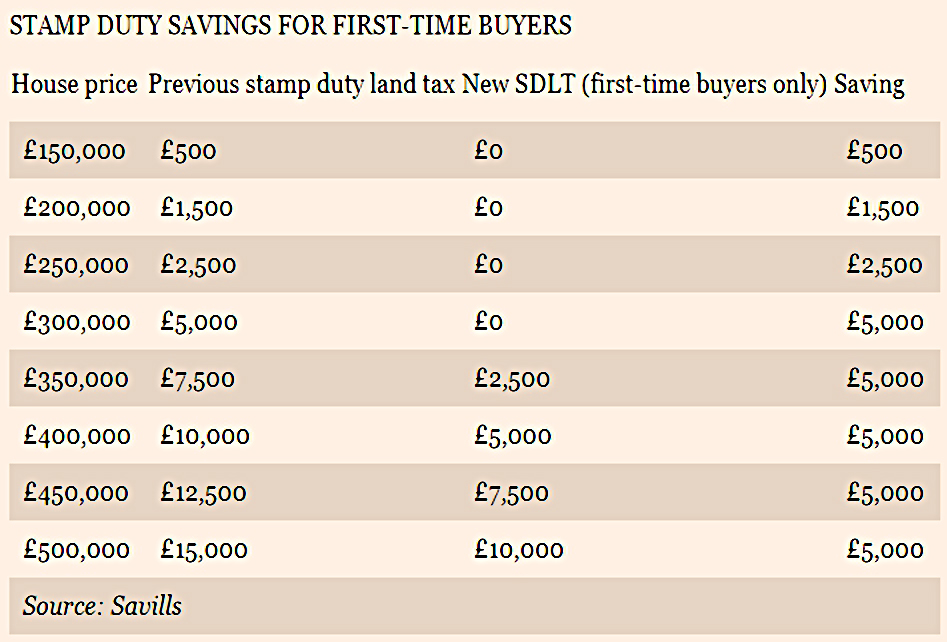
Merryn focused on the stamp duty changes, and the mounting disadvantages for buy-to-let investors.
- First-time buyers now pay £14K less to buy a £300K home.
There was also a double-page spread in the centre of the FT’s Money section.
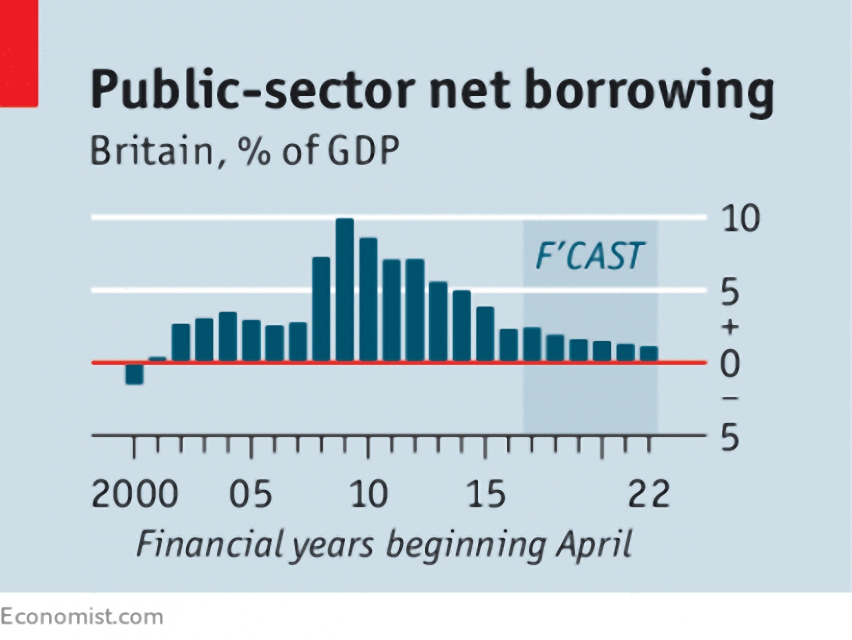
The Economist also had a couple of articles – 1 and 2.
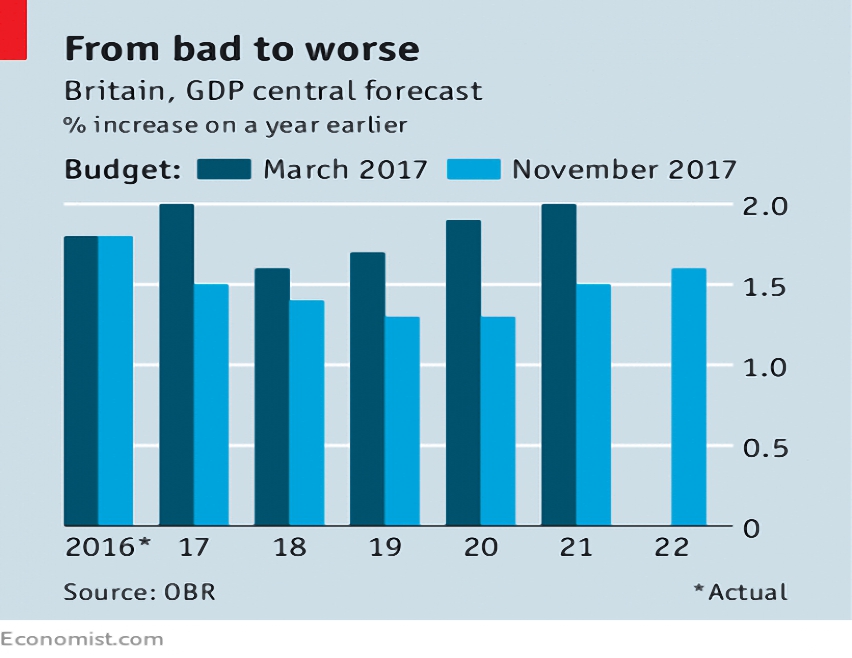
The general consensus was that Hammond’s budget was pretty good, but the prospects for Britain were not.
- Of course, the FT and The Economist are both anti-Brexit publications, so they would say that.
Defined returns
David Stevenson wrote about a new “defined returns” fund based on structured products.
- David has long been puzzled by the popularity of absolute return funds (which are usually anything but) and the relative unpopularity of structured products (which are more reliable, since they are contractually based).
David thinks that it might be because structured products often return your cash early in adverse circumstances (an autocall, or “kick out” plan).
- This means that investors have to decide again what to do with their cash.
- Whereas with an absolute return fund, they can just buy and hold.
I think there’s something in this, but the relative unpopularity of structured products in the UK compared to the Continent suggests to me that the favourable treatment of spread betting (no tax on profits) means that those investors who would be attracted by structured products choose to modify their risk profile using spread bets instead.
- I’ve also had trouble in the past with online trading of structured products, whereas the spread betting sites tend to be a joy to use.
There is one existing structured products fund, the Catley Lakeman AHFM Structured Products fund.
- Now there is a second fund, the FT SG UK Defined Returns Assets fund, from Societe Generale.
The new fund is systematic rather than discretionary, and buys six-year auto calls on the FTSE-100.
- This builds in a 40% buffer in the index before your capital is at risk.
Backtesting shows the fund would have returned 6.6% pa since 2007, compared to 5.6% for the FTSE-100 total return.
- The fund has lower volatility than the index, and a maximum drawdown of 38.5% during the financial crisis.
The fund is best suited to gently rising or falling markets
- If it was structured as an investment trust rather than an OEIC, I might be interested.
NHS pension

Josephine Cumbo reported that the number of young people quitting the NHS pension scheme has increased dramatically.
- 18% of those quitting in 2014-15 were under 30.
- But by last year the proportion was up to 29%.
Employee contributions to the scheme range from 5% pa to 14.5% pa, with most young staff paying 7% to 9% pa.

This is sad news, as the NHS pension is a good one.
- It underlines the poor job that the investment industry is doing of getting the message on pensions across to young people.
- The focus these days is on property and ISAs (and combining both, the LISA).
Perhaps it also reflects an increasing short-termism in society, but the fact remains that there’s not much you can do with your money that’s better than investing it in a DB pension scheme.
Inheritance tax
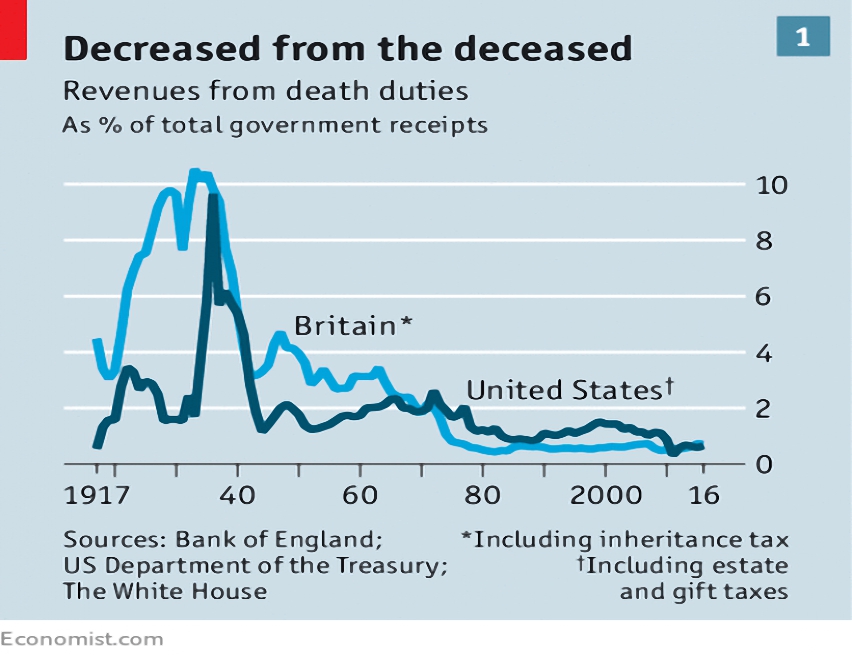
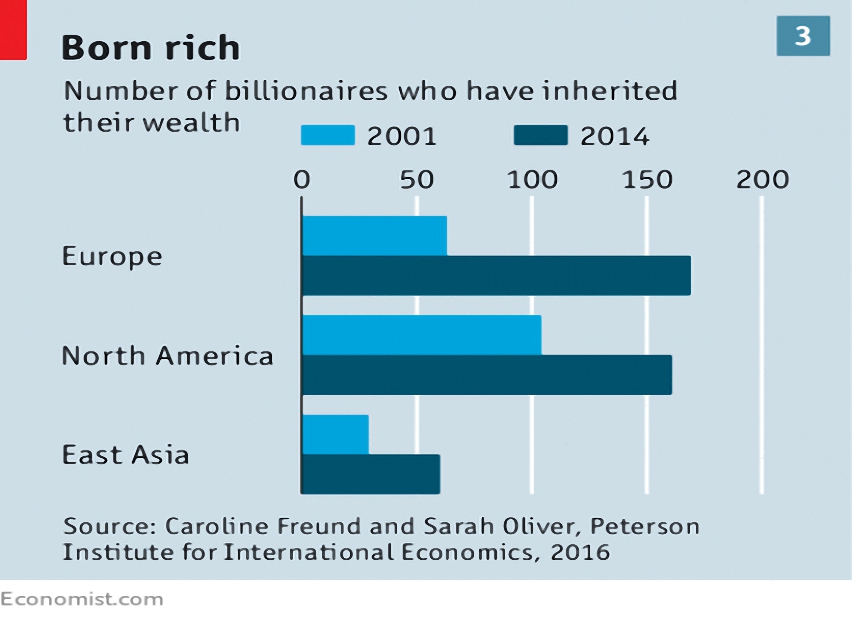
The Economist had a couple of articles about inheritance tax (IHT – 1 and 2) which it is in favour of.
- I am against it, since it is double taxation.
- And I am not alone – it is regularly chosen as the least popular tax in the UK and US, across all income brackets.
In fact, it’s actually triple taxation, since our money is already taxed twice:
- Once when we acquire it (income tax, NIC).
- And again when we spend it (sales tax / VAT).
These are the only two taxes (apart from sin taxes on booze and fags, and externality taxes like carbon credits) that I support.

IHT adds a third bite of tax when money is transferred from one person to another.
- A better way to handle this would be a general gift tax, with annual allowances (or using the income tax allowances).
IHT provides a disincentive to build up more wealth than you can use yourself.
- Which means that the most productive members of society are encouraged to quit halfway through their lives.
And in the UK, the price of houses in the south of England means that many more people are now caught by the tax than was originally intended.
- The new residence allowance will go some way to offsetting this, for those with children at least.
But the US IHT allowance is $5.5M, compared to £325K / £500K in the UK.
The argument that inheritance entrenches an elite doesn’t stand up, since few inherit before the age of 50.
- The elite’s advantages are passed on via assortative mating (see below), gifts from income (not least school fees) and social capital (connections).
- And avoiding tax via structures like trusts can lead to greater wealth preservation than simply passing the money down to the idiot third generation.
US redistribution
Sticking with tax, the Economist also looked at how the US redistributes income.
- Despite lower public enthusiasm for redistribution, the tax code is actually the most progressive in the rich world.
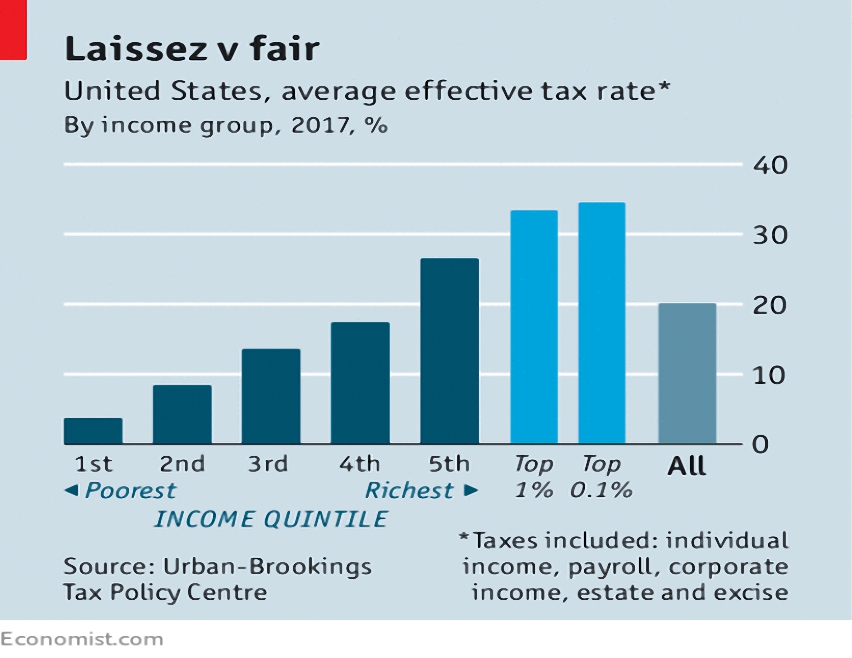
This is partly because there is no VAT, which is regressive, and the average sales tax of 10% is lower than OECD VAT rates (average 19%).
- There are also generous deductions – such as the earned-income tax credit and the child tax credit – that help the poor.
But because US government spending is not targeted at the poor, the net effect is weaker than in other rich countries.

Marriage
The newspaper also had a large feature on marriage.
- A good proportion of this looked at changes in developing countries, but I’ll focus on the effects in rich ones.
Only the rich and well-educated now marry, and they marry later.
- In the US, 88% of births to college-educated mothers are within a marriage.
- For high-school dropouts, the rate falls to 30%.
The average OECD out-of-wedlock birth rate is now 40%.
- And 47% of cohabiting couples break up within five years of a birth, compared to 18% of married couples.
Since children from stable homes do better in life, and are more likely to marry when adults (via assortative mating), the gap between the elite and the poor is getting bigger.
- The Economist expects these trends to spread to poor countries.
They would like to see civil unions introduced for heterosexuals, as they have been in the Netherlands.
- So would I.
Twitter pics
I have nine for you this week.
The first two are from Monevator, and concern the recency bias.
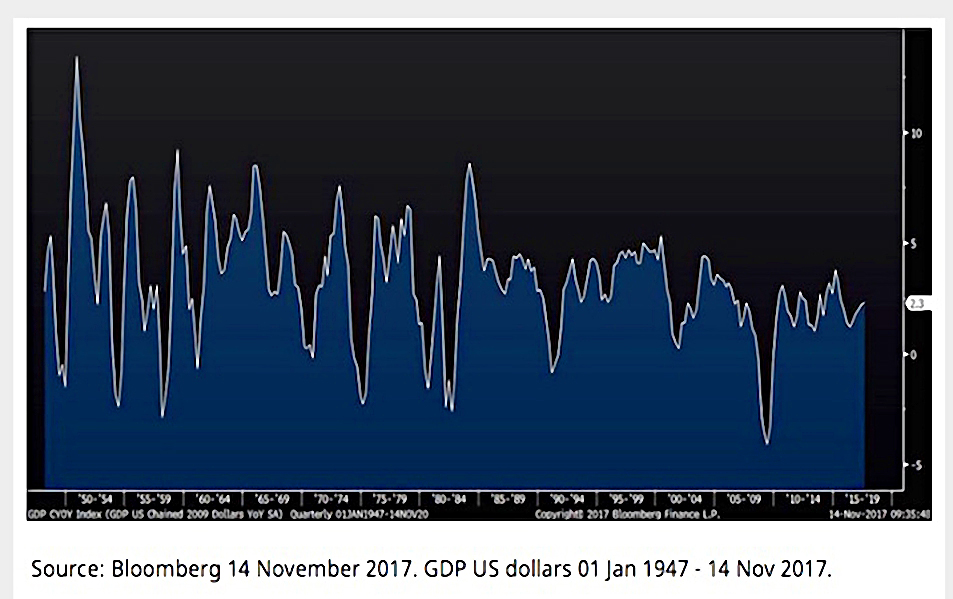
This is the yearly percentage change in post-war US GDP – looks choppy.
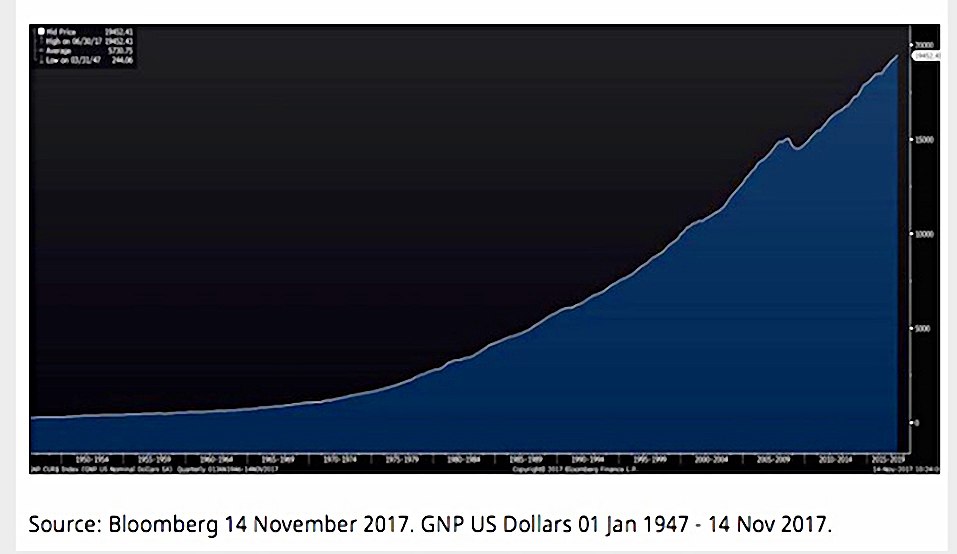
This is the same data plotted on a cumulative basis – nice and smooth.
The next compare the asset allocation of retail investment funds with that of institutional investors.

Here are the retail funds – mostly equities.

And here are the institutional assets – mostly fixed income and liability-driven (LDI).
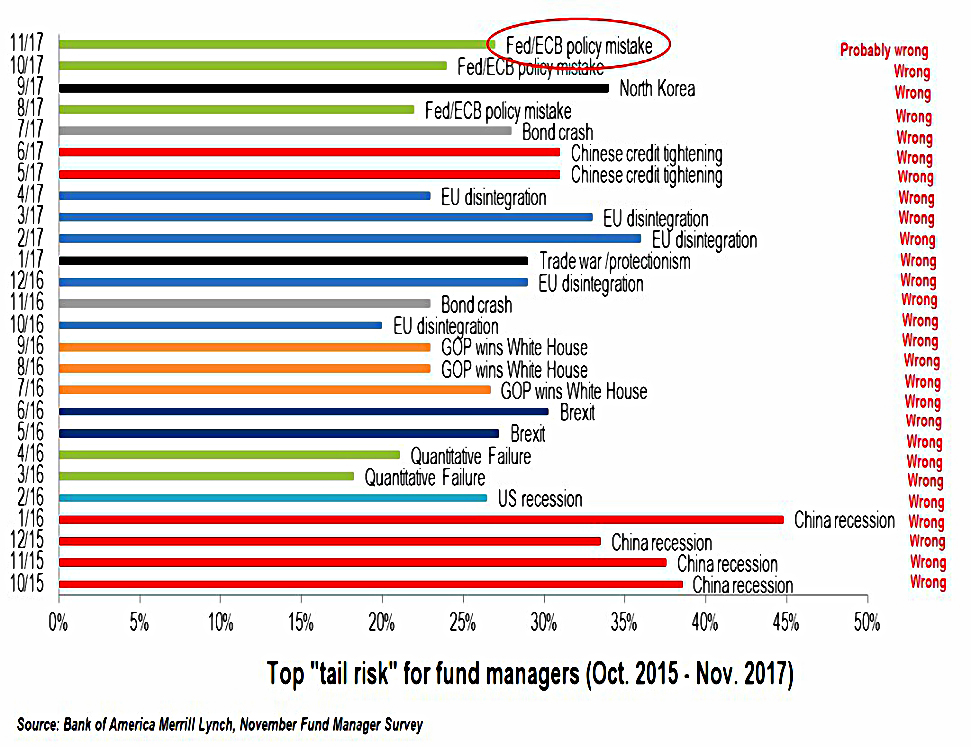
This shows how bad fund managers are at predicting tail risk.
The rest are about the budget in one way or another.
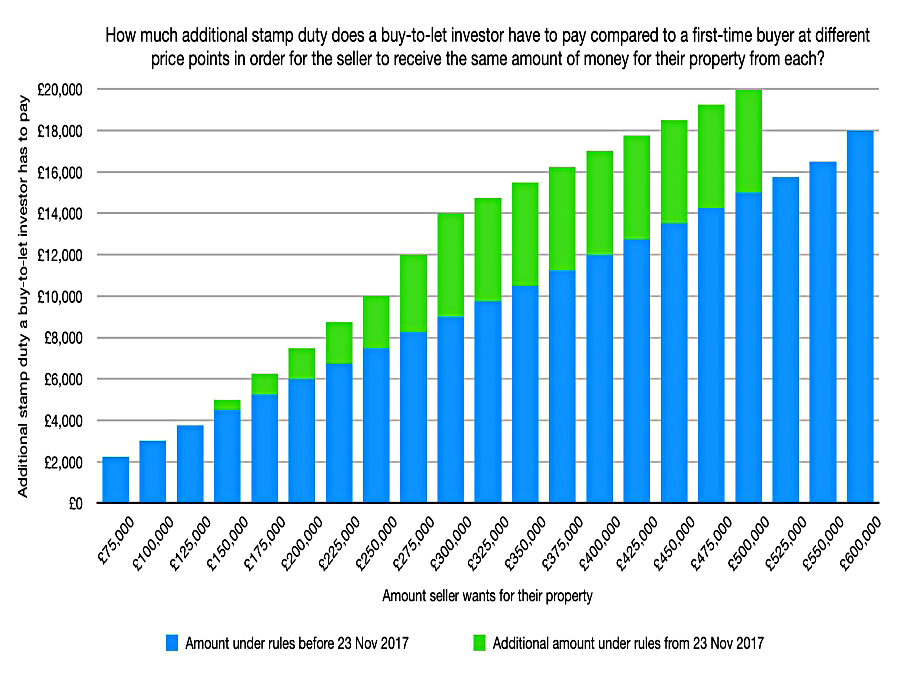
This chart adds more detail to the buy-to-let stamp duty burden above first-time buyers.
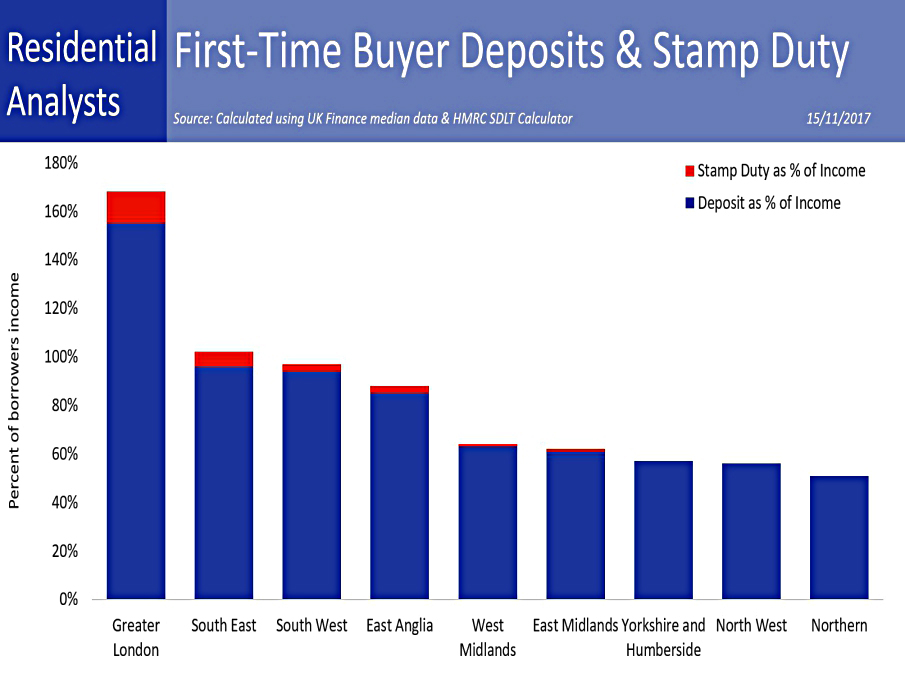
This one suggests that deposits are a much bigger problem for first-time buyers than stamp duty is.
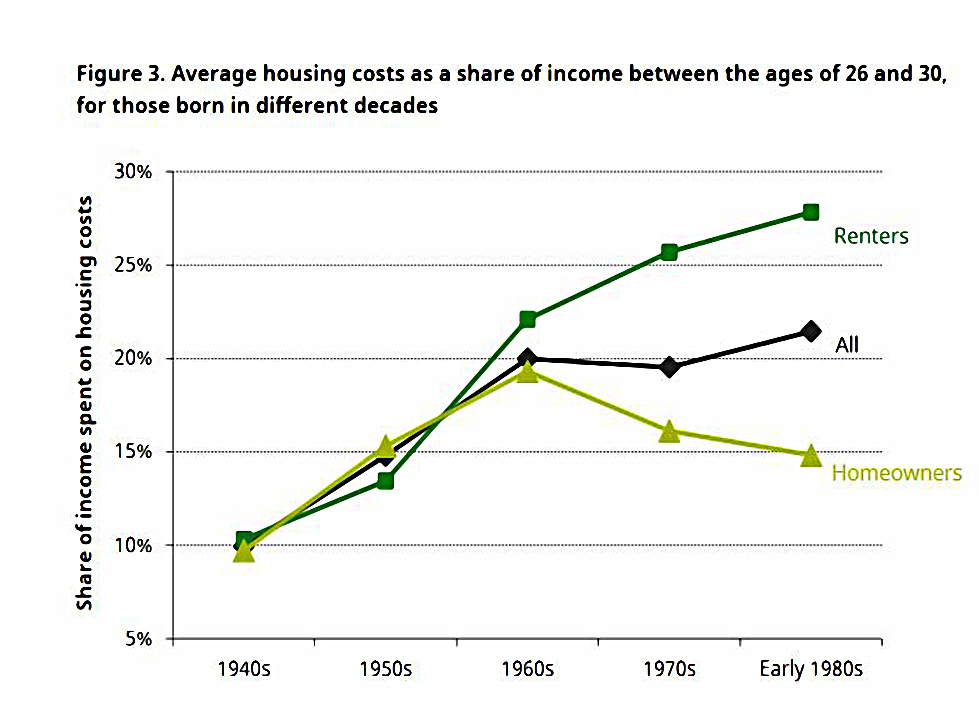
This one shows how housing costs have changed across generations.
- Renting is now significantly more expensive than buying.
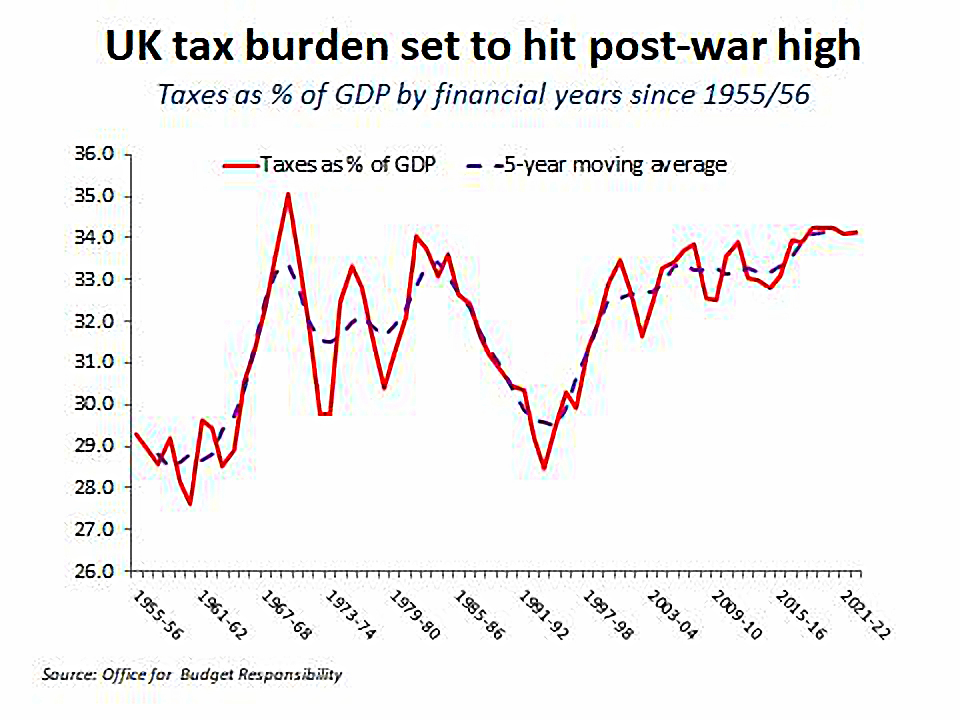
And the final chart shows that the tax burden is about to hit a post-war high (as a percentage of GDP).
Until next time.
Mike Rawson
Mike is the owner of 7 Circles, and a private investor living in London. He has been managing his own money for 40 years, with some success.