Trending, Fast and Slow
Today’s post looks at a paper from MAN on the speed of trend-following systems.
Trending, Fast and Slow
The paper – part of MAN’s “Paid to be Paranoid” series – looks at the 10-Year US Treasury yield through 2021.
- This has a nice move up, then a move down, and then a move back up again – all within a year.
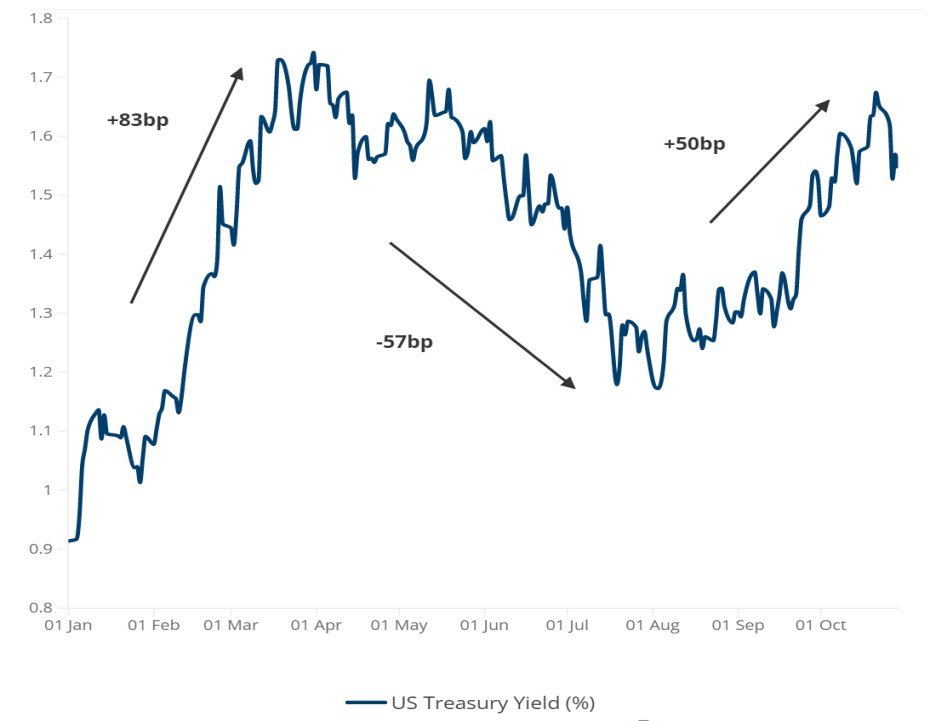
To have successfully followed this trend, a manager would have been short treasury yields up to the end of March, long until early August and the short again for the remainder of the year. Not an easy task.
Before reading the paper, my expectation is that trend systems match best to trends of similar duration.
- So a long-term trend follower might be looking for trends that last for six months to two years, and a short-term trend follower might be aiming at trends that only last a few days.
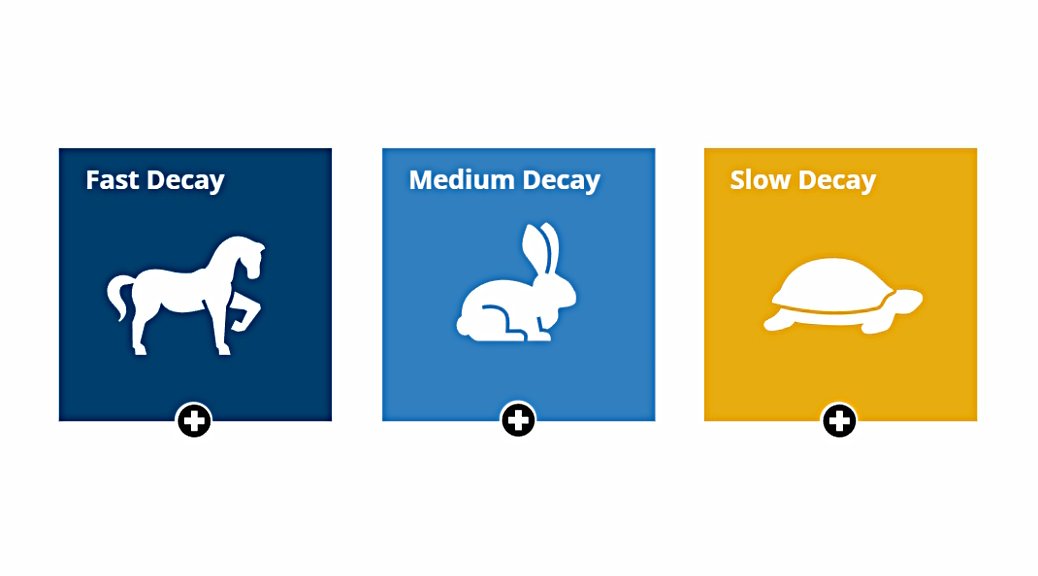
Several of the trend guys whose podcasts I follow run a variety of systems – often three – designed to capture fast, medium and slow signals.
I remember the guys discussing how their systems responded to the sharp Covid correction in the stock market.
- From recollection, fast systems got out and then back in again whilst the slowest systems stayed in the whole time.
The medium systems were the worst place to be since they got out in the crash but then didn’t get back in again quickly enough.
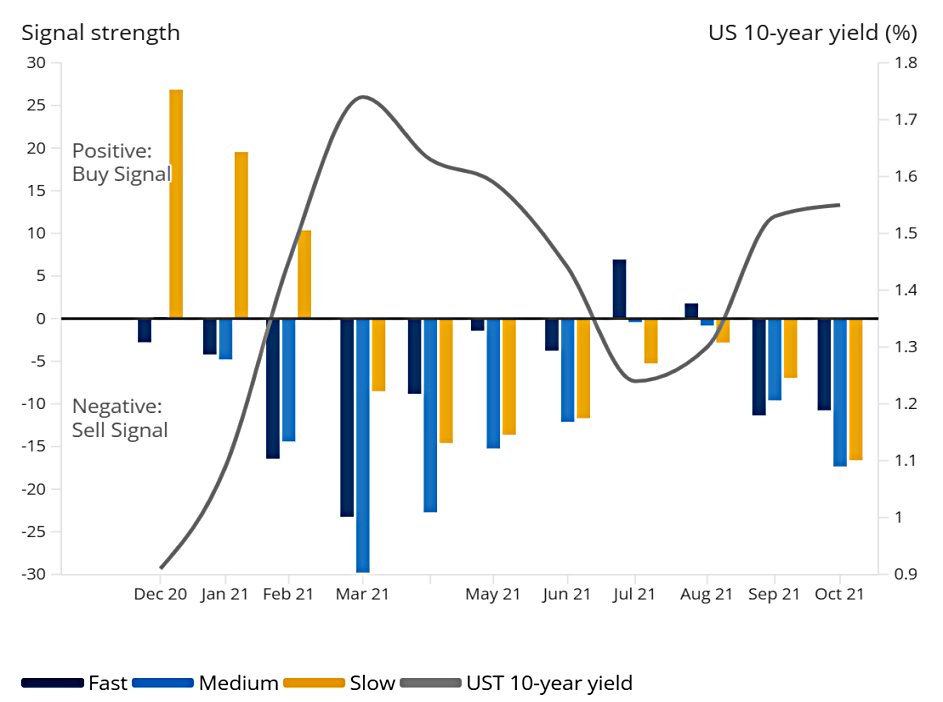
The MAN paper follows a similar approach (and so I would anticipate similar results) :
The ‘Slow’ model started the year with a strong signal for investors to go long on US 10-year futures, while ‘Medium’ and ‘Fast’ were a lot less sure that this was the right call. When all the models pointed investors to go short over the summer, only Fast changed direction briefly before returning to short.
The paper turns these signals into investment portfolios:
By using the signal strength as a proxy for the level of exposure and assuming a monthly rebalance for each model, we can see which trend model has worked the best.
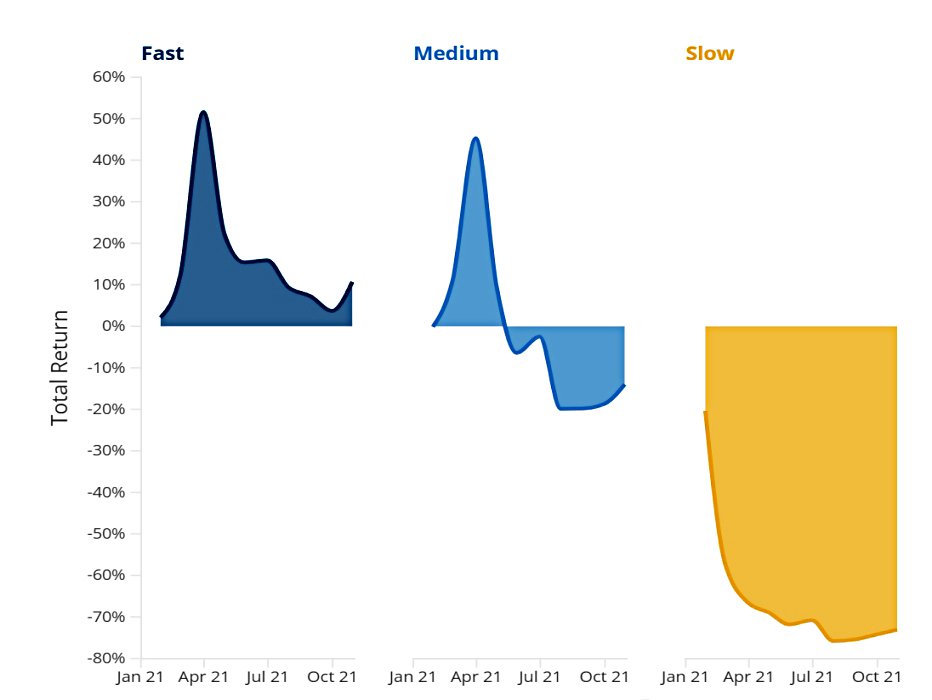
The Slow model never had a chance, but the other two models started well before falling back.
- Only the Fast model managed to hold on to gains for the year.
Volatility scaling
Volatility scaling is a common feature of trend systems:
When markets are calm, the model increases position sizing to maximise the return potential from smaller movements. Conversely, when markets are highly volatile, the model reduces the size of the positions.
In the simple system I use for a small part of my portfolio, using ATR to set the stop loss will automatically position size to (starting) volatility, but future changes in volatility are ignored.
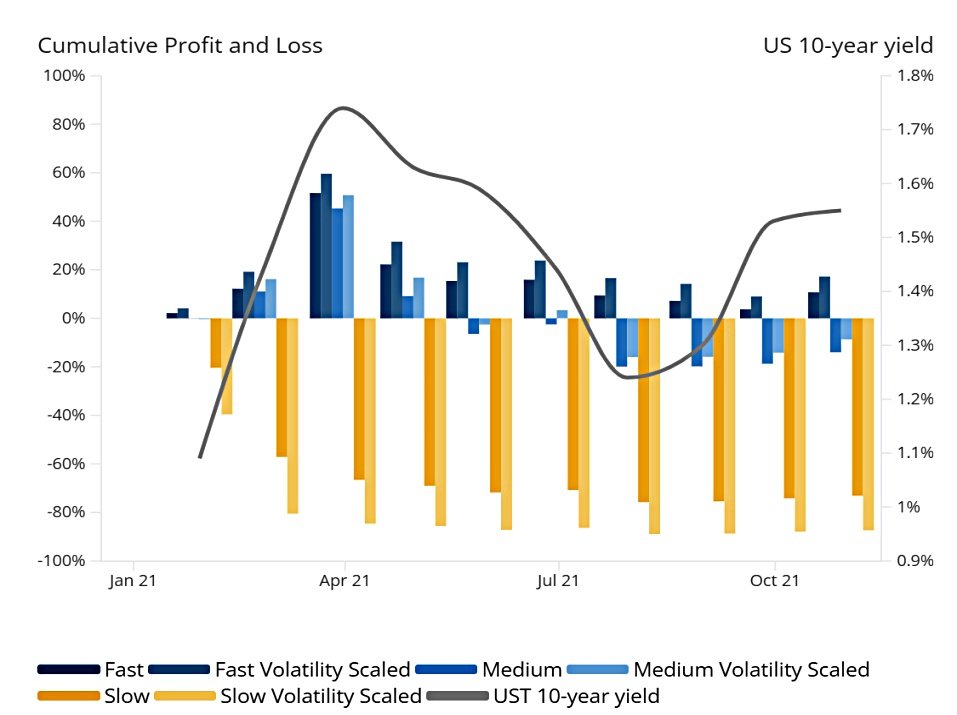
Volatility scaling helped the Fast model deliver an additional 6.5% cumulative return. The Medium return was slightly less negative as a result, but the Slow model was instead worsened even further by the volatility scaling, losing more than 87% of invested capital.
Conclusions
The negative tilt to the returns from the three systems is slightly worrying to me since I expect trend following to deliver (on average) market returns with lower volatility and smaller drawdowns.
- On the other hand, this is just one market (10-year US Treasuries) and just one year.
Trend following works best over the long run and over the maximum number of markets that you can afford to invest in.
The key lesson from the paper is the dispersion of returns.
- We need to diversify across time as well as asset classes and geographies.
Choose more than one time frame for your trend-following signals (three seems to be enough) and stick to them.
- Until next time.
Mike Rawson
Mike is the owner of 7 Circles, and a private investor living in London. He has been managing his own money for 40 years, with some success.