The Market Environment for Trend

Today’s post looks at a 2019 report from Abbey Capital on The Market Environment for Trend Following.
Contents
Abbey Capital
I hadn’t heard of Abbey Capital until recently when one of their managers was interviewed on a podcast I follow.
- Abbey is an Irish Alternative Investment Fund Manager that also operates as a Commodities Trading Advisor (CTA – a trend-following manager) in the US.
The background to the report (written in 2019) is that managed futures and in particular, trend-following had been having a bad decade.
- Results actually picked up in 2019 and 2020, but the analysis remains interesting.
The paper set out to assess various theories put forward to explain the underperformance:
- There is too much money in the space
- Trend followers are being front-run or gamed by other market participants
- Markets have become faster and Trendfollowers are too slow to react.
Abbey concludes that the market environment is the main issue:
[It is] characterised by fewer large moves, more reversion and fewer sustained trends. A unusually benign macroeconomic backdrop coupled with extraordinary monetary stimulus may have contributed to fewer major trends.
Abbey foresees several future scenarios which could be more favourable for trend following.
Performance
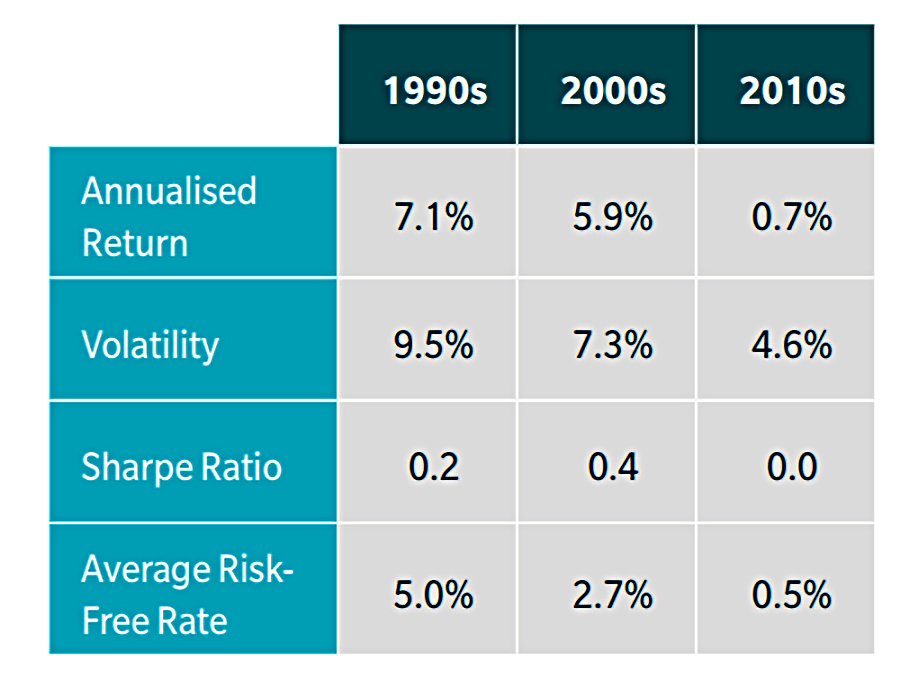
Returns from trend-following have been lower in the 2010s than in the two previous decades, even after accounting for the lower risk-free rate.
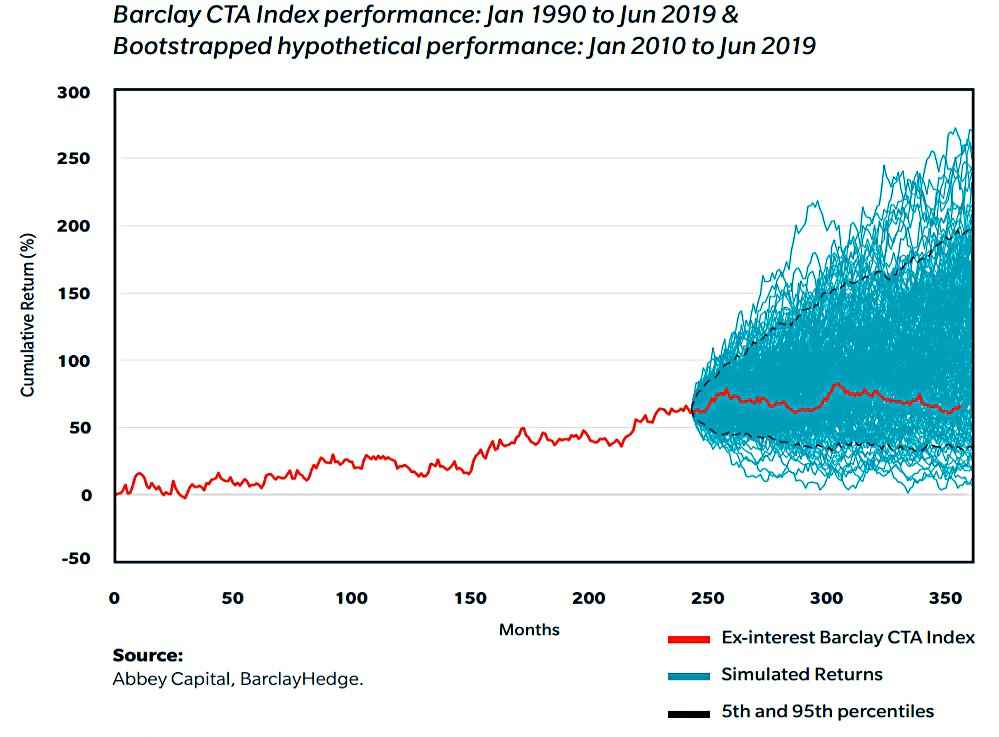
By generating simulated returns (via bootstrapping), Abbey shows that the observed results are:
Within the range of outcomes an investor could have statistically expected, assuming the characteristics of the return distribution in the previous two decades are unchanged.
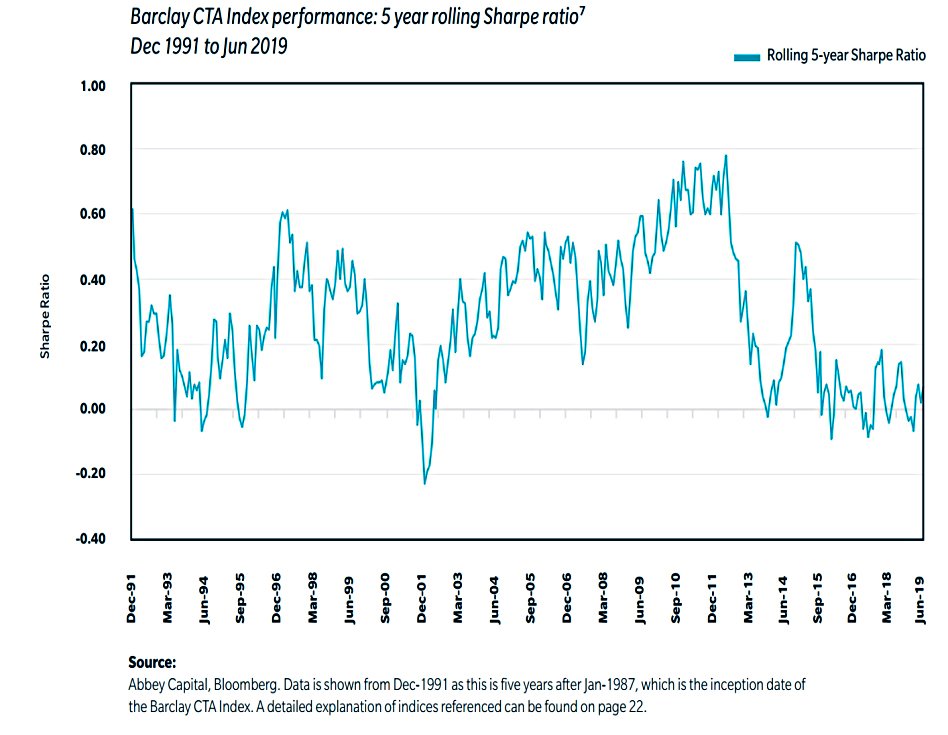
Abbey also notes that managed futures have had similarly difficult periods in the past.
- Sharpe ratios have been comparably low in the mid-1990s and around the turn of the century.
In the previous tough periods, poor returns were masked to some extent by higher returns from excess cash.
Too much money
The first possible explanation for underperformance is growth in assets under management.
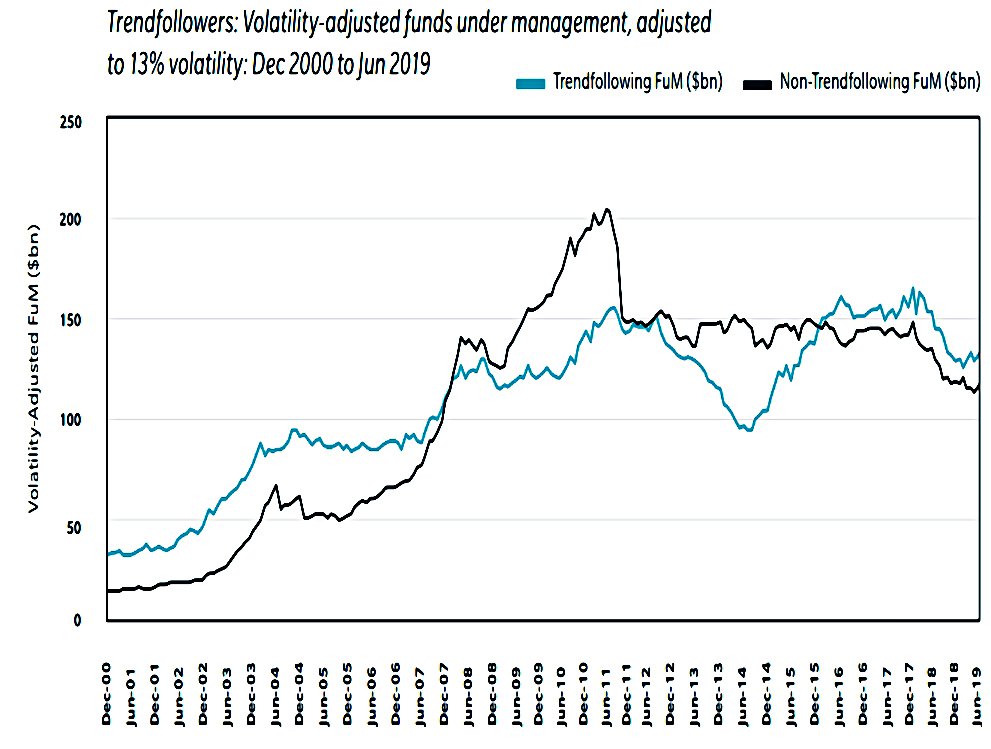
Funds under management (“FuM”) in managed futures have grown to just below $325bn in 20198 from circa $35bn in December 2000.
This total includes all strategies ( discretionary and systematic macro, short-term trading
and counter-trend) as well as trend following.
- These other strategies would not usually hold the same positions as trend followers.
Abbey also adjusted the data to a standard level of volatility (this changes over time for CTAs).
- They chose 13% volatility, which is the median level.
While FuM is still higher in this decade versus the previous decade, the current level is about the same as in 2008, which was one of the strongest years for managed futures, suggesting that current FuM should not be an impediment to performance.
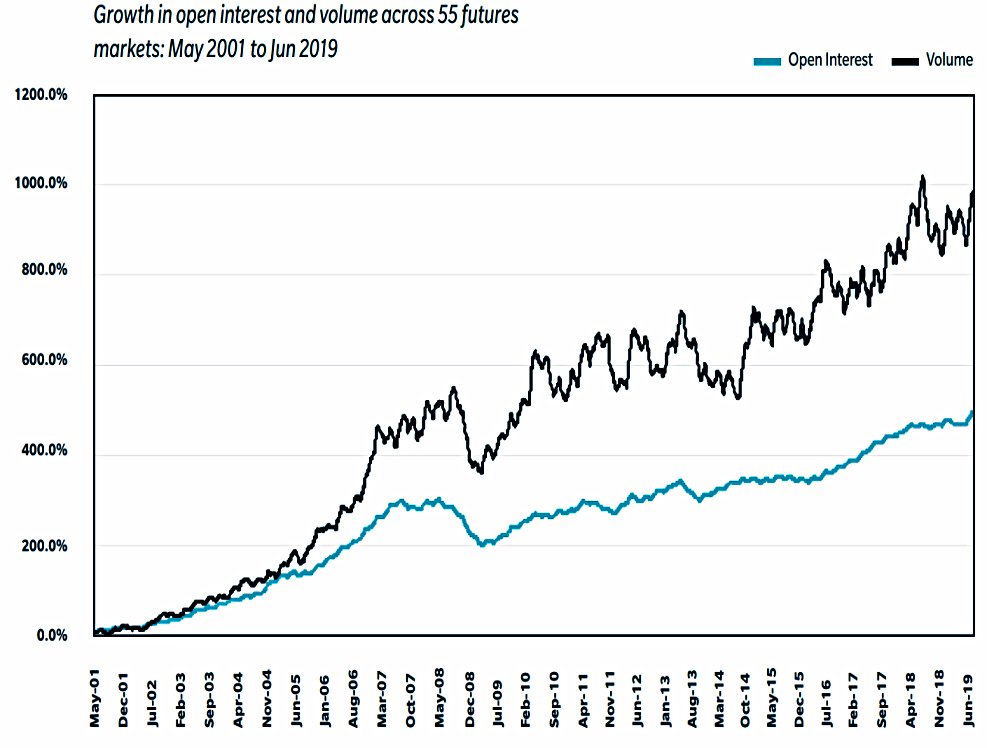
Abbey also notes that open interest in 55 major futures markets has grown by 450%, and volumes by 950%, since 2001.
- This is much greater growth than in Trend following FuM.
The excess assets have been spread across more futures contracts (including many more assets) and market impact may not have increased.
Gaming by other traders
A second theory for explaining CTA underperformance is gaming by other market participants.
High frequency traders may be able to anticipate Trendfollowers’ trades, trade ahead of them and generate gains by closing out positions when Trendfollowers trade.
This doesn’t make much sense, since HFTs hold trades for only milliseconds.
There have always been market makers in futures markets such as locals/floor traders so the profit being taken out of the market by market makers is nothing new. If anything, trading spreads and costs have declined, over time.
Abbey has not seen a deterioration in slippage but rather an improvement.
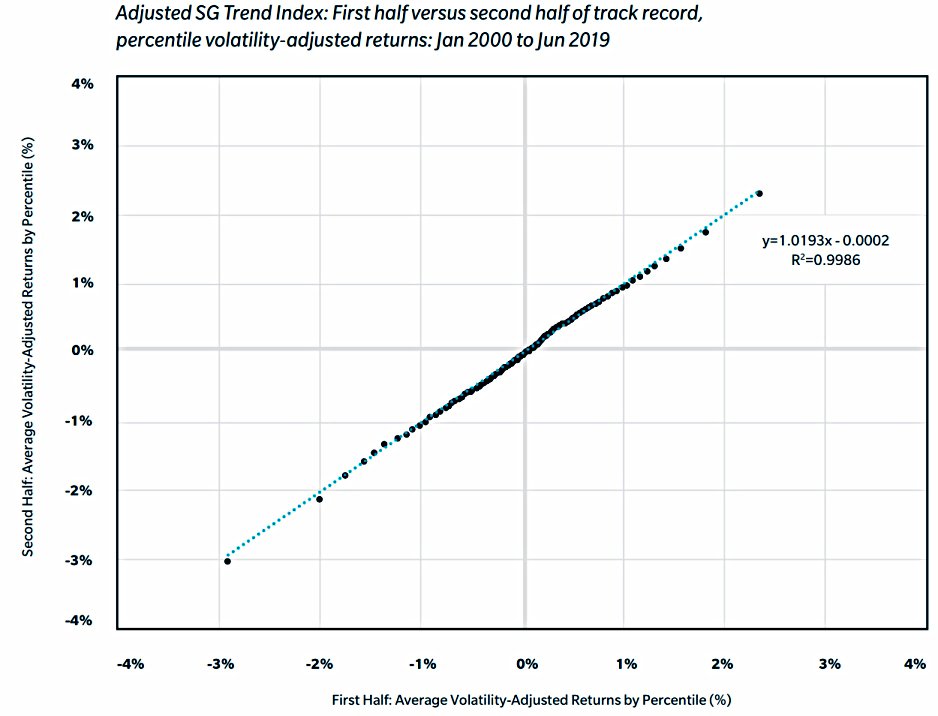
To investigate further, Abbey compared the best days with the worst days.
Trendfollowers typically trade more frequently on days with negative performance rather than positive performance. Negative days for a Trendfollower, by definition, will be characterised by corrections or reversals of trends with managers often reducing or closing out positions. On positive days, the trends continue and managers typically maintain positions.
So if slippage/gaming was an issue, we should see worse performance on negative days in recent years compared to the past.
The average daily return in the lowest 5% of days in the second period is only 0.07% lower than the first period, which is statistically insignificant.
Abbey concludes that CTAs are not being gamed and there is no noticeable crowding effect.
Faster trends
The third common explanation for the underperformance is that markets have become faster and trend-followers move too slowly to capture the moves.
This assertion appears to be driven by observation of a small number of market moves rather than a systematic review of all of the main futures markets. For sure, the moves in US equities in February and December of 2018 were quick and the recovery in January 2019 was also notable for its speed.
But CTAs trade across many markets, not just stocks – and most of these markets have not been speeding up.
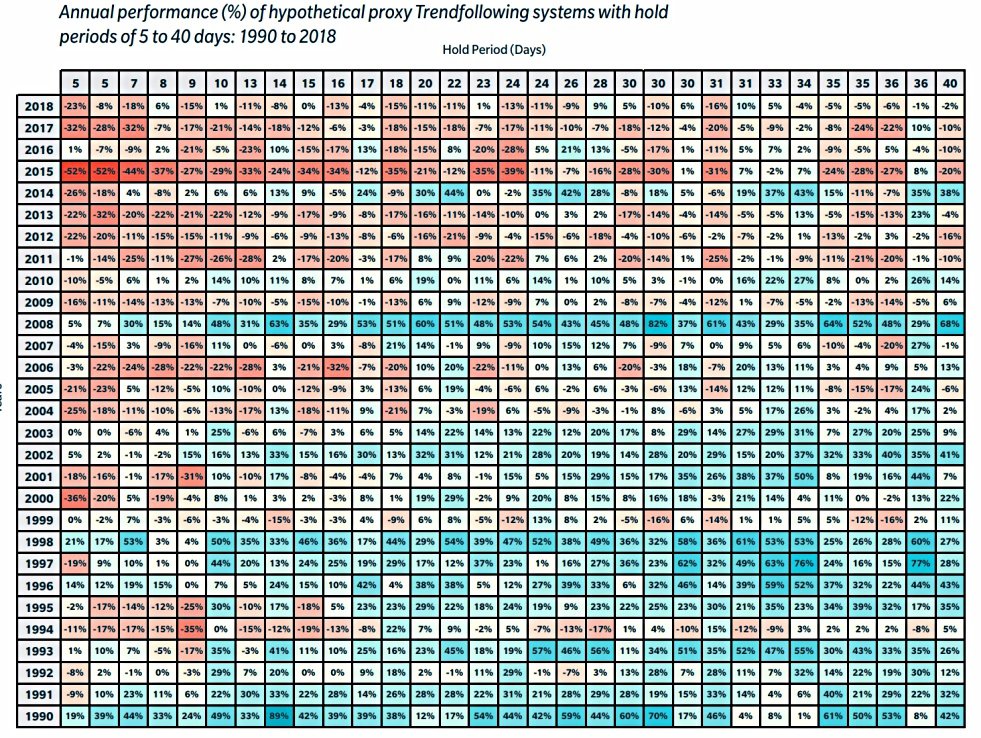
If speed really is an issue, then fast systems ought to show better relative performance compared to slow systems in recent years.
- The table above shows no evidence of this and highlights that medium-speed systems have done best overall.
Difficult markets
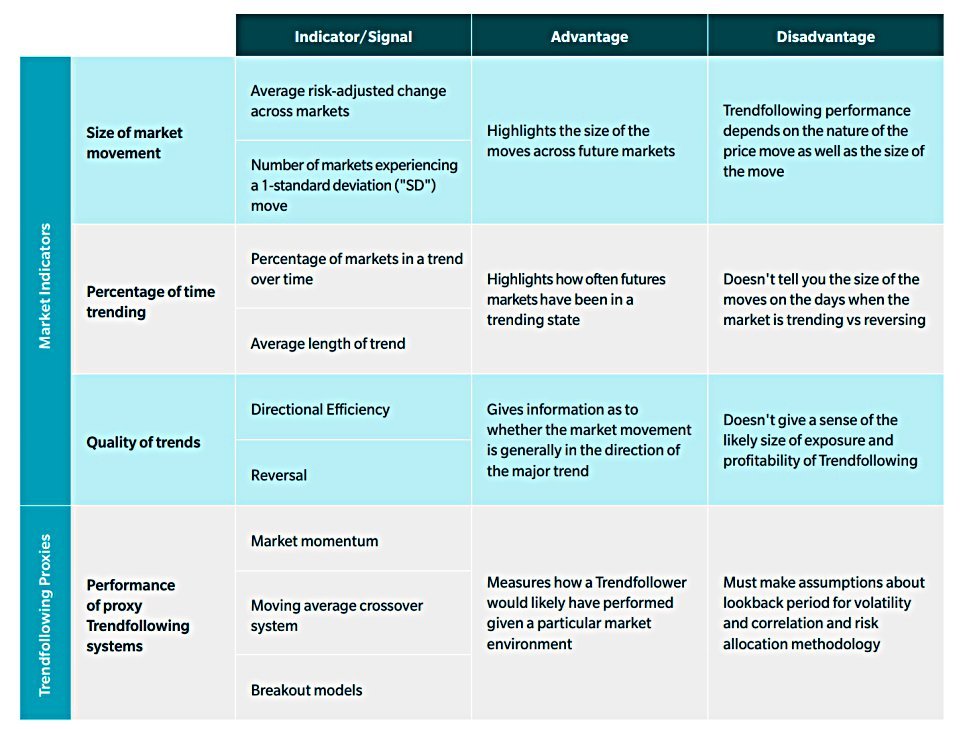
Abbey believes that the underperformance in the 2010s reflects difficult markets for trend-followers.
- The table above shows the indicators that they use to assess the suitability of markets.
Market moves
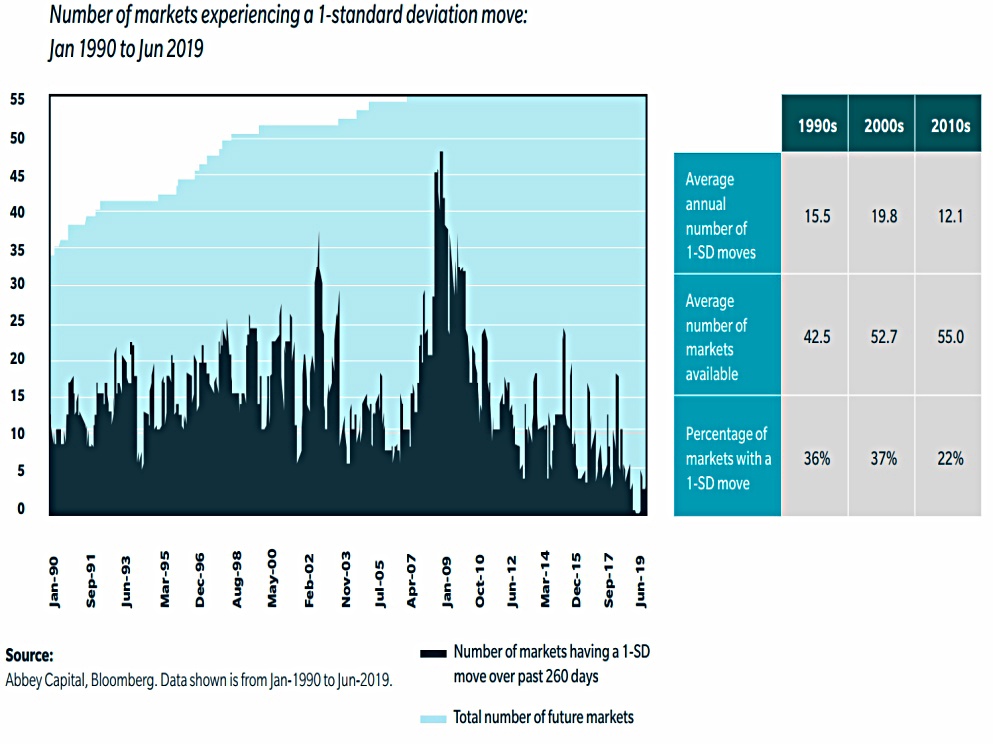
Trendfollowing will tend to do well when there are large directional moves in markets. Larger moves will offer Trendfollowers the opportunity to get into a position and profit.
Abbey looked at 1-standard deviation moves.
- There were fewer of these in the 2010s.
Trending
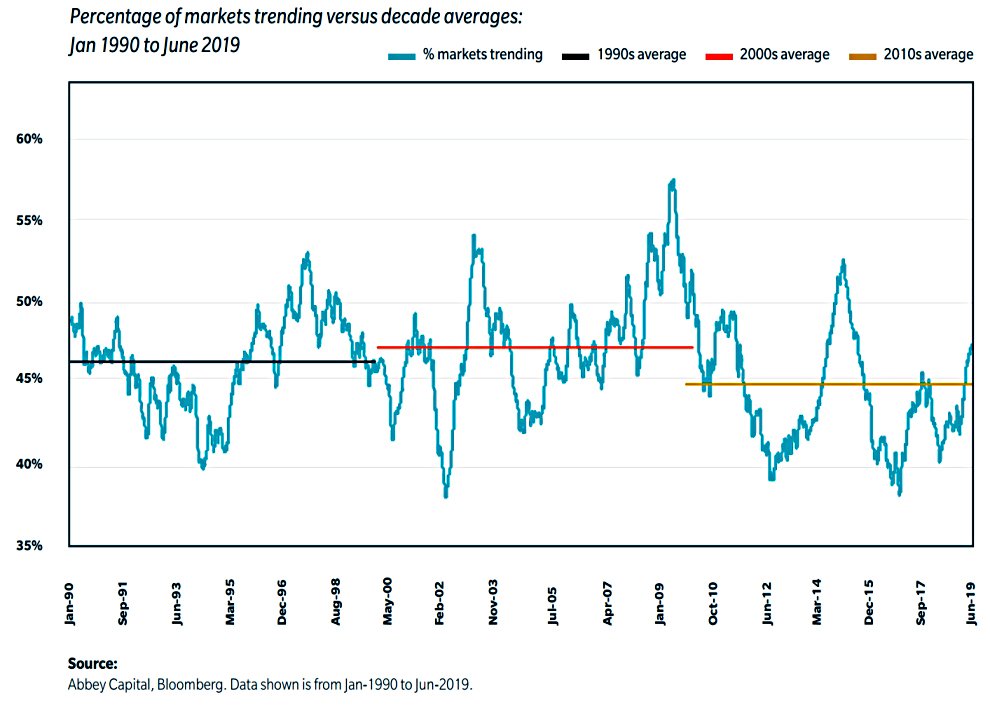
As well as large moves, trend followers look for a high percentage of time spent in trends.
- Choppy markets won’t lead to large profits.
Abbey looked at two things:
- classifying whether a market is in a trend, consolidation or correction phase by reference to the price and moving averages, and
- measuring the duration of trends for a typical trading strategy (such as a 20-120 day moving average crossover).
The percentage of markets in a trending state is lower in the 2010s.
Quality of trends
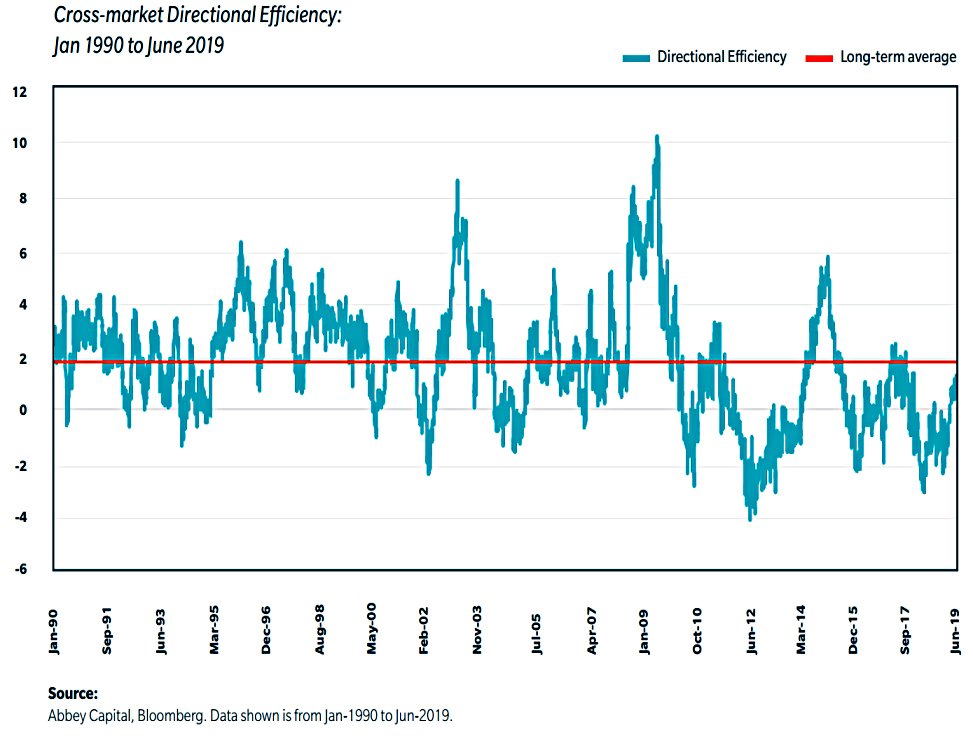
Abbey also looked at the quality of trends.
A price move with fewer reversals will make it easier for a Trendfollowing system to hold a position and will be more efficient.
They looked at two measures:
- Directional Efficiency (“DE”), which measures how much of a price move is in the direction of the major trend and
- A cross-market reversion indicator which measures how much reversion rather
than directional movement there is in a given price move.
Again, quality has dropped in recent years.
Proxies
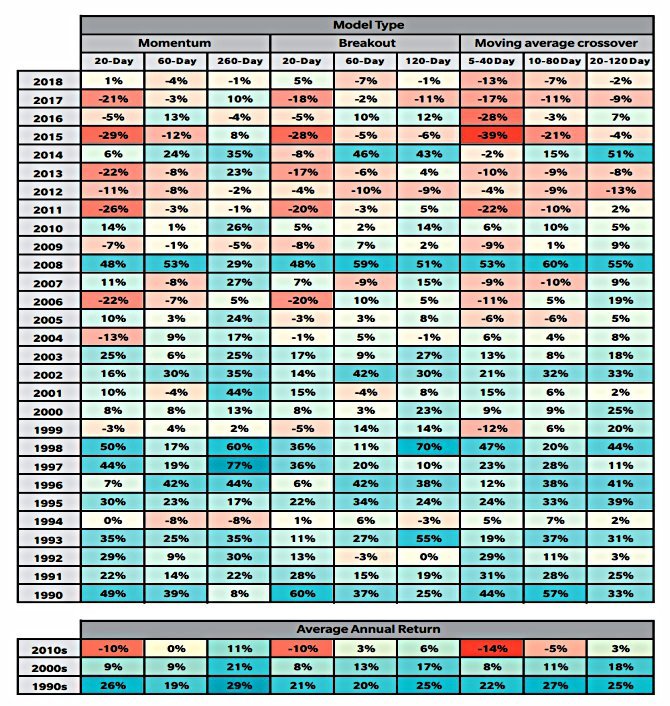
Abbey also looked at the hypothetical performance of nine proxy trend models.
- Once again, performance has been worse in recent years.
If the Trend proxies were indicating positive performance for Trendfollowing which was not being achieved by CTAs, that may be a warning flag of a structural problem with the space. However, this is not the case.
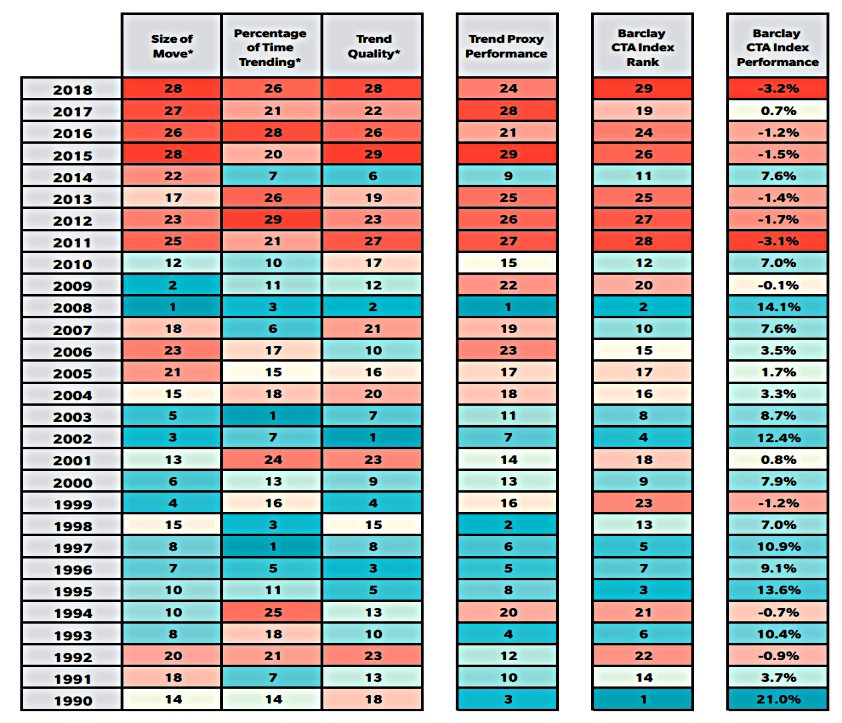
Stacking the indicators side-by-side with the proxy model performance tells a similar story.
Why?
If we accept that there have been fewer large moves and fewer sustained trends and that this has translated into worse CTA performance, the next question is why?
The development of major trends can sometimes be traced to major economic events (such as the Global Financial Crisis) and policy shifts (e.g. ECB easing in 2014) but in other cases they have been driven by more idiosyncratic events. It is possible that the recent decade has just, due to chance, had fewer events which have been significant enough to generate sustained trends.
Alternatively, macroeconomics and policy trends could play a part.
- The macro backdrop has been relatively stable in the last decade.
Headwinds of deleveraging, coupled with long-term challenges such as demographics has resulted in a long but steady economic upswing.
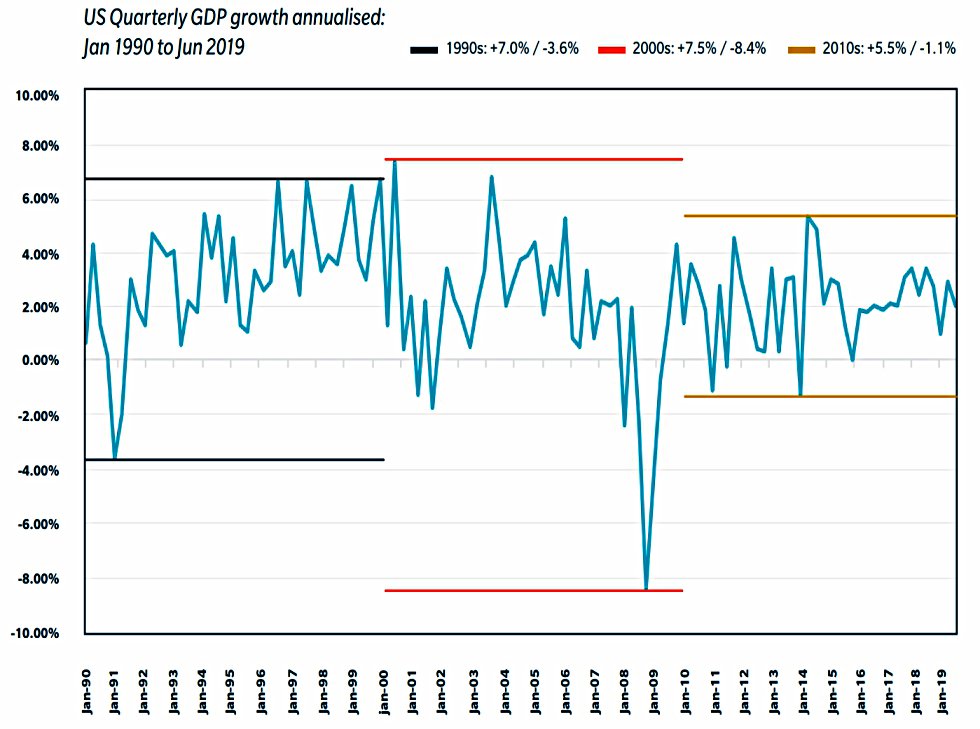
US GDP was more stable at the time the paper was written, but of course, since then we’ve had the Covid recession and recovery.
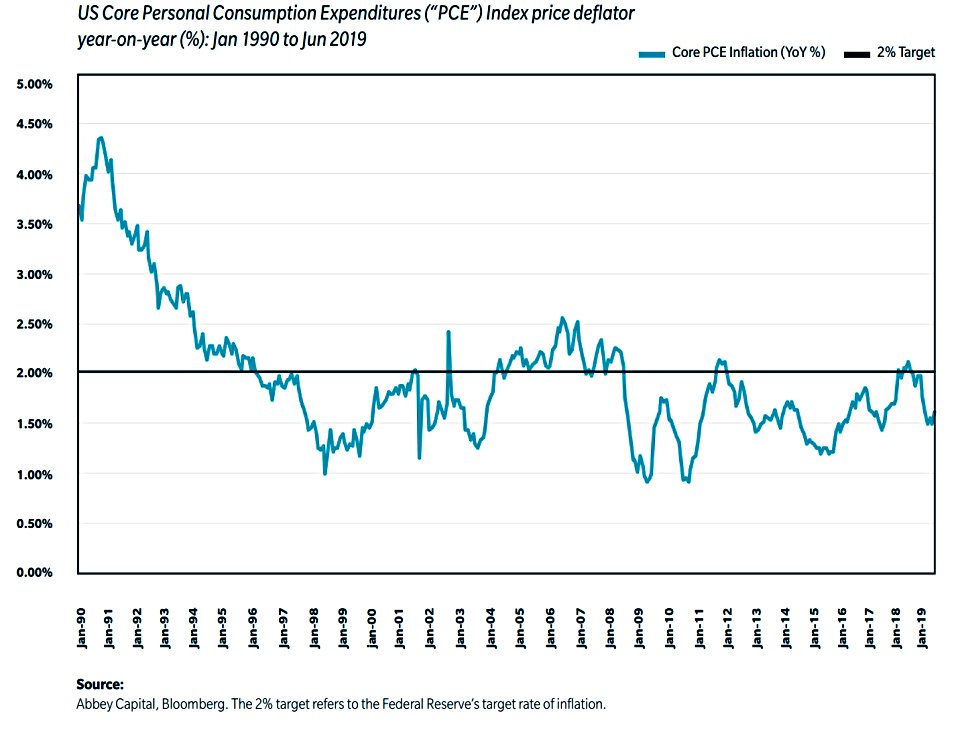
Inflation was also stable to 2019 but rose significantly in 2021.
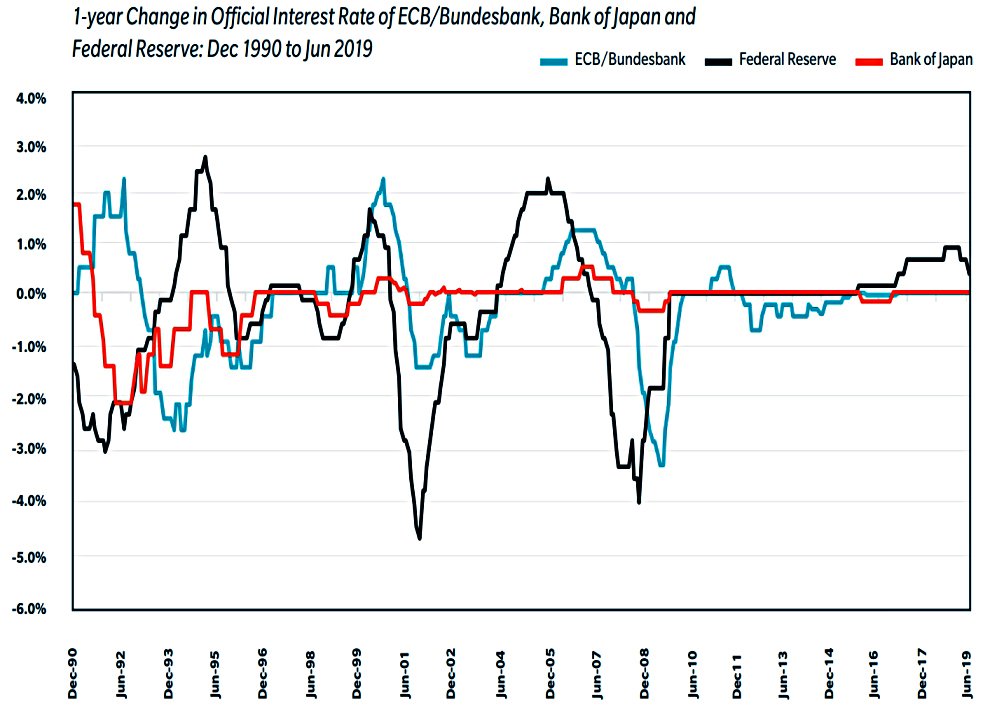
Interest rates have been stable (and very low), though rises are expected in 2022.
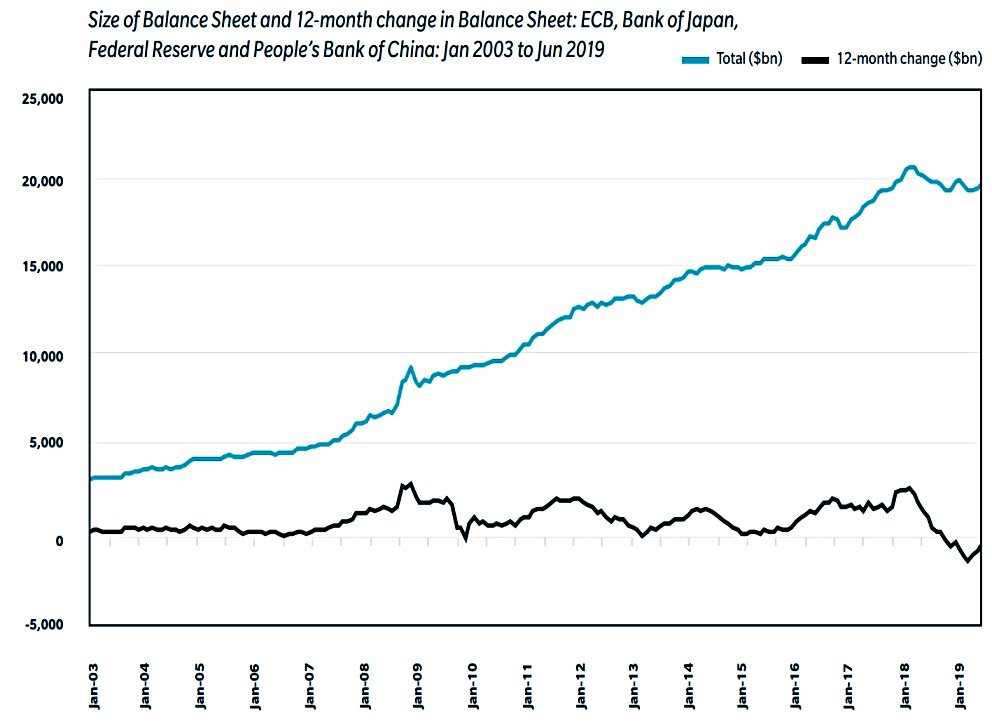
QE has inflated the balance sheets of the central banks, and at the time of writing is still continuing.
The stated aim of QE has been to reduce risk premia and this, along with the lower macro volatility, may have contributed to low volatility in fixed income markets in the last decade.
What might help
The last section of the report looks at what might lead to greater directional movement in markets:
- More variability in economic conditions (recessions and recoveries)
- We’ve already had one since the paper was written
- Higher inflation
- It’s already here
- A “Minsky moment” as low volatility encourages risk-taking.
- This was a good call when the paper was written, but post-Covid and with higher interest rates on the horizon, complacency is out and the wall of worry is back.
- An end to QE.
- At the time the paper was written, QE had been replaced by quantitative tightening (QT) in the US and Japan was tapering.
- The US had to row back on QT, but it’s now tapering again, and we can expect tapering from most major central banks.
- MMT and debt financing, leading to bigger deficits and more fixed income volatility.
- This is still a possibility in the US, though the November mid-terms might introduce a political block.
Conclusions
Although the paper is a few years old, and conditions have changed since it was written, there are still a few lessons we can draw:
- The poor performance of Trend in the 2010s was down to market conditions.
- We can reasonably expect good performance from Trend when suitable market conditions arrive.
- These conditions look more likely now than when the paper was written.
- The proxy models used by Abbey are a hand crib sheet for DIY trend followers.
Until next time.
Mike Rawson
Mike is the owner of 7 Circles, and a private investor living in London. He has been managing his own money for 40 years, with some success.