Expected Returns 2 – Styles

Today’s post is the second in our series looking at papers by Antti Ilmanen, as a prelude to tackling his magnum opus, Expected Returns.
Last time

Last time out we looked at Understanding Expected Returns, from the Fourth Annual European Investment Conference of the CFA (Chartered Financial Analyst) Institute, held in Paris on 2–3 November 2011.
Here are the key takeaways:
- Investors tend to think of expected returns as a function of the asset class.
- This leads them to take on too much equity risk since diversifying assets like bonds have lower returns that would need to be juiced by leverage.
- Diversification (multiple sources of risk which have worked well over long periods) can help, but correlations are higher when things get tough (in crashes)
- There’s also insurance, but this is expensive when it is needed (because it becomes popular)
- Selling volatility gives good returns except in a crash because people over-pay for insurance.
- “Lottery tickets” – the most volatile members of an asset class (eg. small cap blue-sky growth stocks) – generally offer poor returns.
- They are over-priced because of the preference of some investors to chase outsize returns.
- Low volatility stocks outperform in absolute terms and have much better risk-adjusted volatility (a higher Sharpe ratio – SR).
- There is no reward for buying bonds longer than 5 years or riskier than BB.
- Iliquid assets (eg. venture capital, private equity) have higher returns but did badly through the 2008 crisis.
- For behavioural reasons, diversifying across investment styles (Value, carry/yield, trend/momentum, volatility and liquidity) may offer greater returns for less risk.
- But styles have lower volatility than stocks, and so can’t diversify away the equity risk.
- Value and trend may seem contradictory, but it’s a matter of timescale.
- Trend dominates for up to a year, before mean reversion sets in.
- This means that chasing multi-year returns (as many investors do, even when choosing funds) runs straight into reversal effects.
- Value and trend actually combine well together (recent winners can still be cheap), and they act as good diversifiers for each other.
- Trend also protects against tail risk (does well in crashes).
- Limited market timing (“time variation in return sources”) may also increase returns.
- Timing can be based on valuation measures, the macro environment and on investor risk aversion.
- But timing is risky and should, therefore, be a minority component.
My portfolio
My own portfolio has a heavy allocation to equities for a good reason – I need the returns.
- I’m targeting an SWR of 3% to 3.25%, and that means that I need a target allocation to equities of 75% (( In practice, my exposure to expensive London property means that I have to include equity alternatives in that total in order to get anywhere close ))
- I am unwilling to take on the necessary levels of borrowing needed to juice up a true risk parity portfolio (( I can envisage portfolios with 10% to 20% leverage at times, but 100%+ leverage is unthinkable for me ))
On top of a base passive diversified portfolio, with equity allocation matched to the required return, I have two overlays/satellites:
- Style (factors / smart beta)
- Market-timing (tactical asset allocation) based on valuation, macro indicators and investor sentiment.
Styles
Today’s paper is called Investing With Style and was co-authored with Cliff Asness of AQR and others.
- It appeared in The Journal of Investment Management in 2015.
The starting point is once again the domination of equity risk in standard portfolios.
- The 60/40 stock/bond portfolio (presumably in the US) is 99% correlated to the 100% stock portfolio.
All an investor should care about is receiving positive average returns that are uncorrelated with what she currently owns.
For the authors, styles can do this, and they are cheaper and more liquid than other diversifiers (PE, hedge funds).
The catch (the price we pay) is not too bad:
Style investing requires the “three dirty words in finance”—leverage, short-selling, and derivatives.
So it won’t be simple.
Which styles?
In the paper, there are four styles to choose from: (( Actually, you’re supposed to use all of them together, rather than choosing between them ))
- value
- momentum
- carry (yield – this is closely related to value for stocks)
- defensive (low risk/low beta, so equivalent to low vol)
- This style can also be extended to include quality measures.
Other factors like size and illiquidity are not included.
- Size is excluded because it has become less robust since its publication, and also because it is more difficult to extend to non-stock asset classes.
- Illiquidity is also too diverse across asset classes.
Mechanisms
The paper discusses the risk-based and behavioural explanations of why factors work, but choosing between these two explanations is not necessary in order to implement the recommendations of the paper.
- The authors also offer leverage constraints (for some investors) as an explanation of why low risk might work.
Long-short
The authors argue for the long-short implementation of all of the styles simultaneously, rather than long-only tilts of a subset of styles.
- Hedged styles have lower correlations with stocks, other passive long exposures, and with each other.
Asset classes
The paper looks at seven asset classes, referred to as contexts:
Individual stocks globally, industries, country equity indices, government bond indices, interest rate futures, currencies, and commodities.
The contexts were chosen for liquidity and capacity.
- The markets used for individual stocks were the US, UK, Japan and Europe.
Results
There’s plenty of detail in the paper on the data and the methodology, but we’ll focus on the pretty pictures.

The first chart shows the returns from the styles between 1990 and 2013.
- Note that each of the styles works, but they all suffer from individual drawdowns.
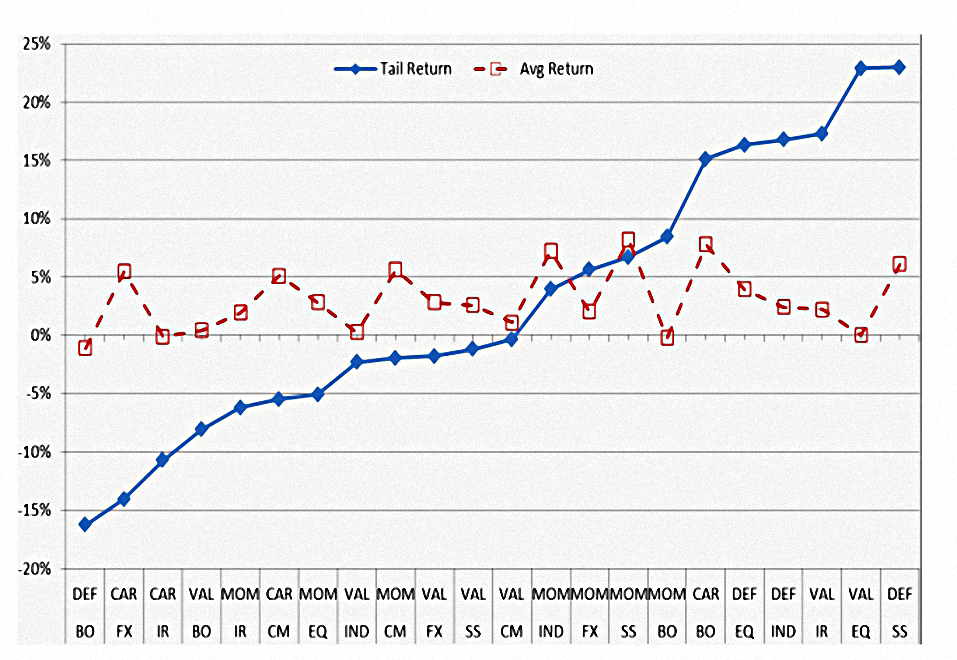
This chart shows that average returns across styles and assets are remarkably consistent, but that tail returns (in crashes) vary significantly.

This chart shows the leverage used by the strategy, with the long and short sides shown separately.
- The absolute levels (averaging around 350%) are scary, but the net levels less so (apart from around the 2008 crisis).
- It would have been nice to see the net levels plotted on this chart, too.
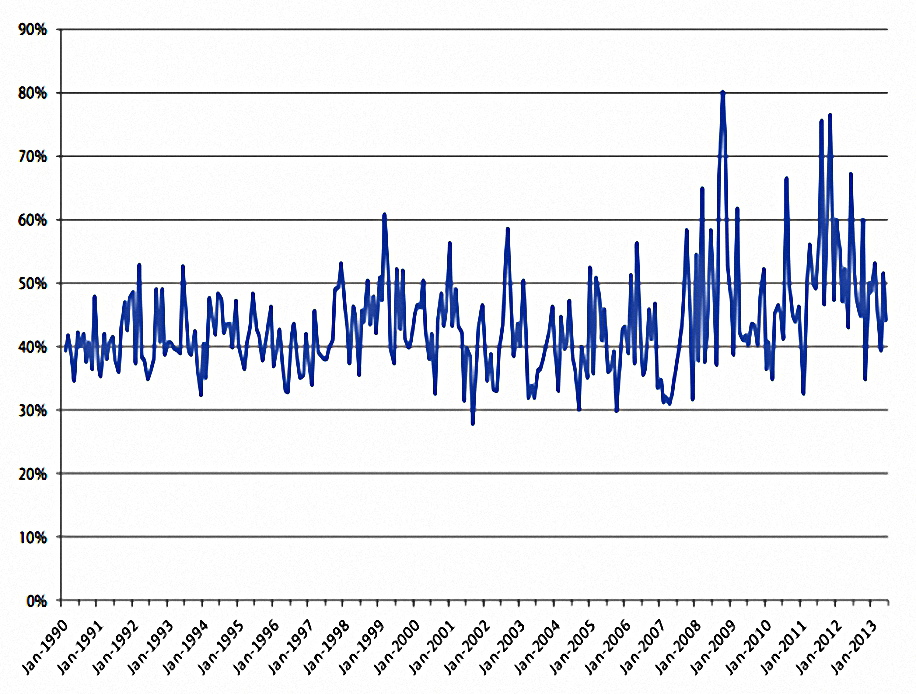
This chart shows turnover levels for the strategy, which are about double what I would target.
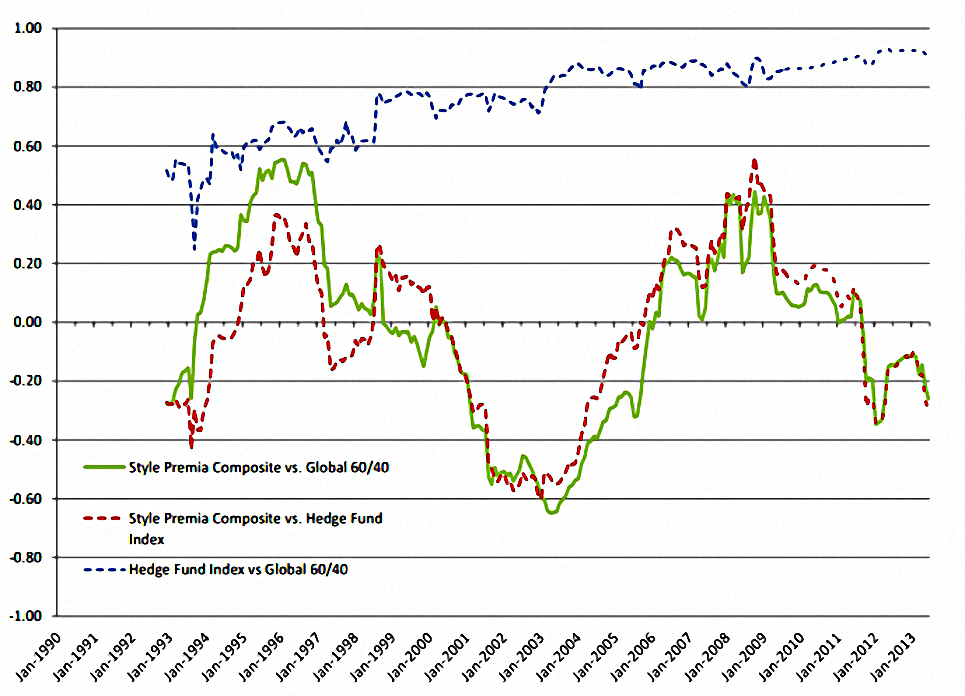
This chart shows that the composite style premia portfolio is not massively correlated to a 60/40 stock/bond portfolio, or to the hedge fund total return index.
- Note however that the hedge fund index shows an increasing correlation to the 60/40 portfolio.
Further analysis within the paper explains this:
Hedge funds have increased their exposure to passive equities significantly through time, while at best retaining their mild exposures to style premia.
Conclusions
Today’s paper has reinforced some of the ideas from Antti’s previous paper (around styles and factors), rather than introduce too many new ones.
- I am even more convinced that styles can help a necessarily equity-heavy base portfolio, though implementation will not be straightforward.
Until next time.
Mike Rawson
Mike is the owner of 7 Circles, and a private investor living in London. He has been managing his own money for 40 years, with some success.