Expected Returns 9 – Alternatives

Today’s post is the ninth in our series looking at papers by Antti Ilmanen, as a prelude to tackling his magnum opus, Expected Returns.
Story so far

We’ve looked at eight papers / essays, a blog article and a slide deck so far.
- The lessons learned had become as long as a blog article in themselves, so I have moved them to a separate master page here.
Alternatives
We are working our way through a pamphlet produced by the CFA Institute and based around extracts from Antti’s book Expected Returns.
- So far we’ve looked at equities, bonds and credits (corporate bonds).
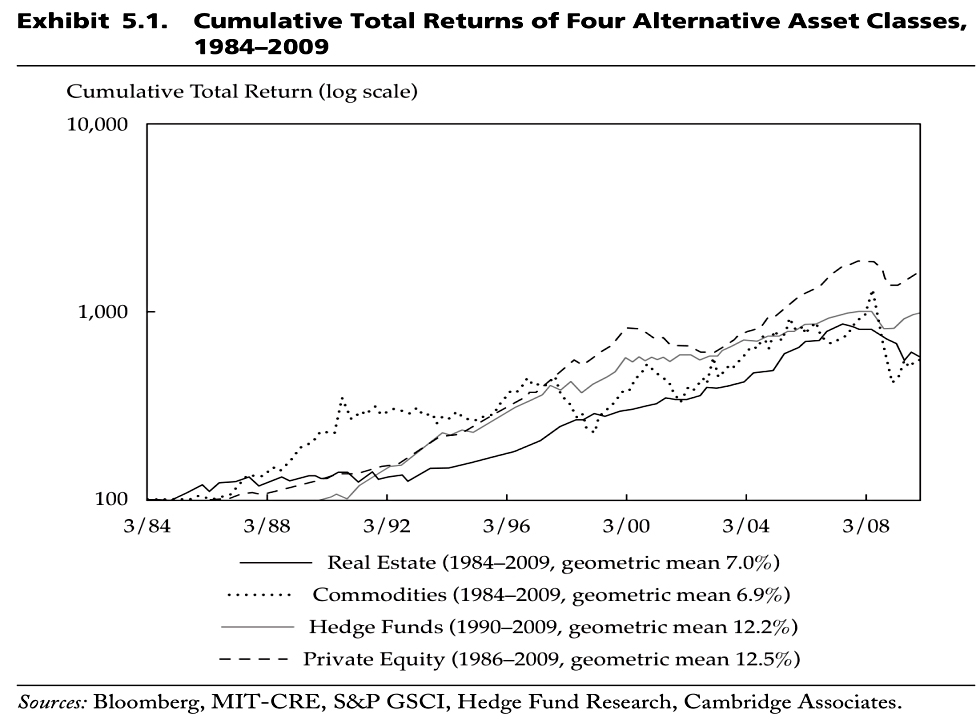
The final chapter in the pamphlet is on alternatives (real estate, commodities, hedge funds and private equity).
- Alternatives improve diversification under normal conditions and may enhance returns.
- But they are often less liquid and less transparent, and their performance has decayed over time.
- Alternatives became more popular in the 2000s but failed their big test in the 2008 crash.
- Real estate and commodities are seen as diversifiers and as inflation protection.
- Many see hedge funds and private equity as sources of alpha, and as active management strategies.
- Real estate returns are between those of stocks and bonds, but they are heavily influenced by starting valuations.
- Long-term real price growth is almost zero, but yields can be significant.
- Commodities (Futures funds in the US) are very good diversifiers and inflation hedges – especially oil.
- Returns are driven by “roll returns” (see below) rather than spot price appreciation.
- Hedge funds have outperformed historically.
- This could be explained by selective reporting (a form of survivorship bias) or via risk factors.
- Private Equity has underperformed listed equity, despite a liquidity handicap.
- Some investors still like it for its lack of correlation and smoothing of (reported) returns.
Returns
Antti notes that HF and PE returns may be exaggerated because of survivorship and other reporting biases.
He also points out that alternatives lack forward-looking indicators like yields or valuation ratios.
- Despite this lack of evidence on the time-varying nature of alternative returns, there’s little doubt that returns do vary strongly.
Alternatives prosper under conditions of high liquidity and high risk appetites and do badly when conditions are tough.
- This procyclicality is frustrating for holders of a well-diversified portfolio (such as myself).
- And it’s one reason why I am so drawn to Rob Carver’s sub-division of alternatives into Equity Alts, Bond Alts and True Alts.
Antti suggests that short-term momentum and long-term reversal patterns can be used – along with excessive money flows – to time alternatives.
Real estate
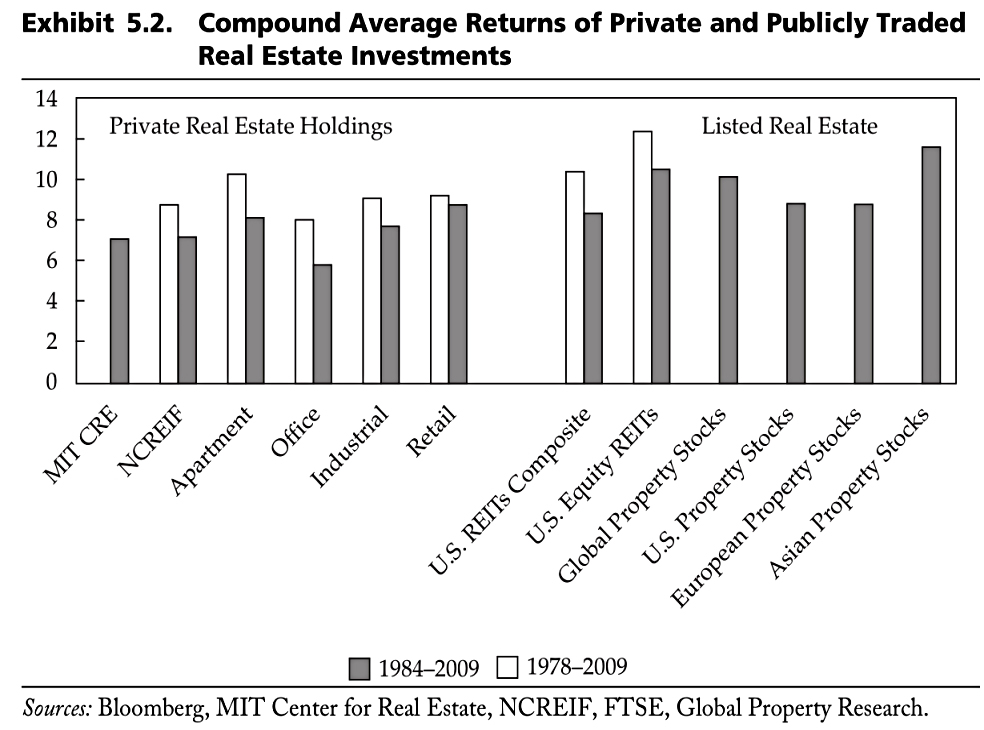
In the US (between 1978 and 2008), REITs outperformed commercial and residential property, as well as farmland.
- REITs also beat stocks and bonds, but not small-cap stocks.
Antti puts this down to leverage and growing institutional demand.
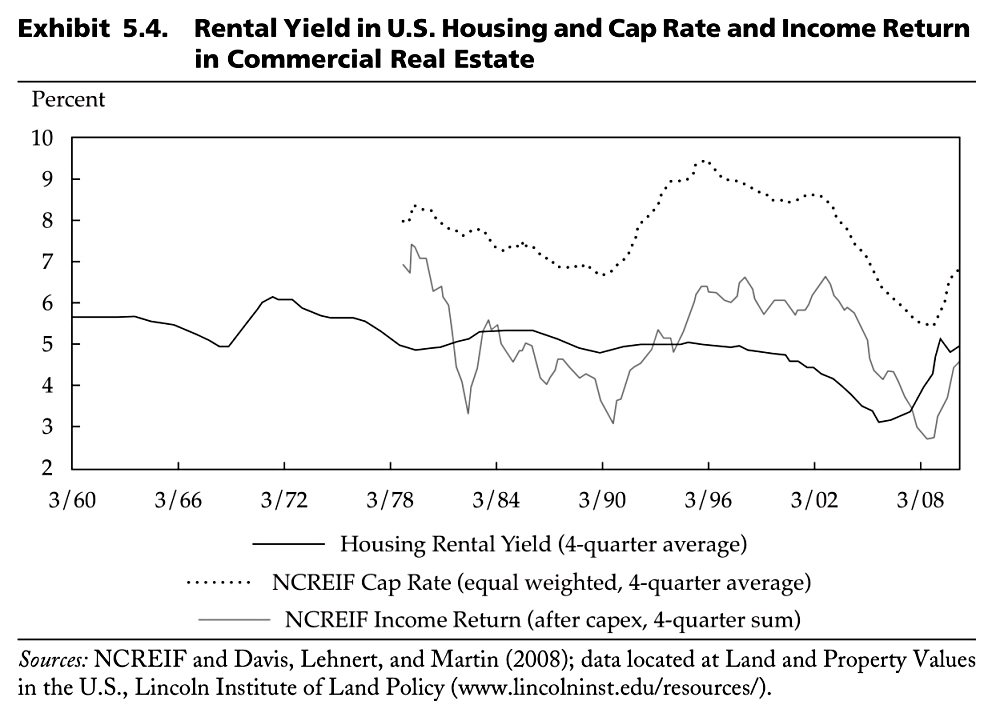
(Net) rental yield is the most popular valuation measure and can be seen as equivalent to earning yield or dividend yield in stocks.
- The relative yield, when compared to dividend yields and/or bond yields, says something about the relative attractiveness of the three asset classes.
Income and asset values are closely tied to inflation over the long-term – the long-term return mainly reflects the cash yield.
- Note that price bubbles of more than a decade (eg. London from 1995 to 2009) are still possible.
Since property is usually bought with debt, low interest rates can push up prices and depress future returns.
- The relative cost of renting and buying can be used to indicate whether prices are high or low.
Economic growth, inflation, demographics, population migration and physical supply are also important factors.
Real estate is more prone to bubbles than other asset classes, due to the difficulty of pinning down fair value and the near impossibility of selling the asset short, as well as the cost and
infrequency of transactions.
Commodities
Here Antti concentrates on futures contracts rather than holding spot commodities.
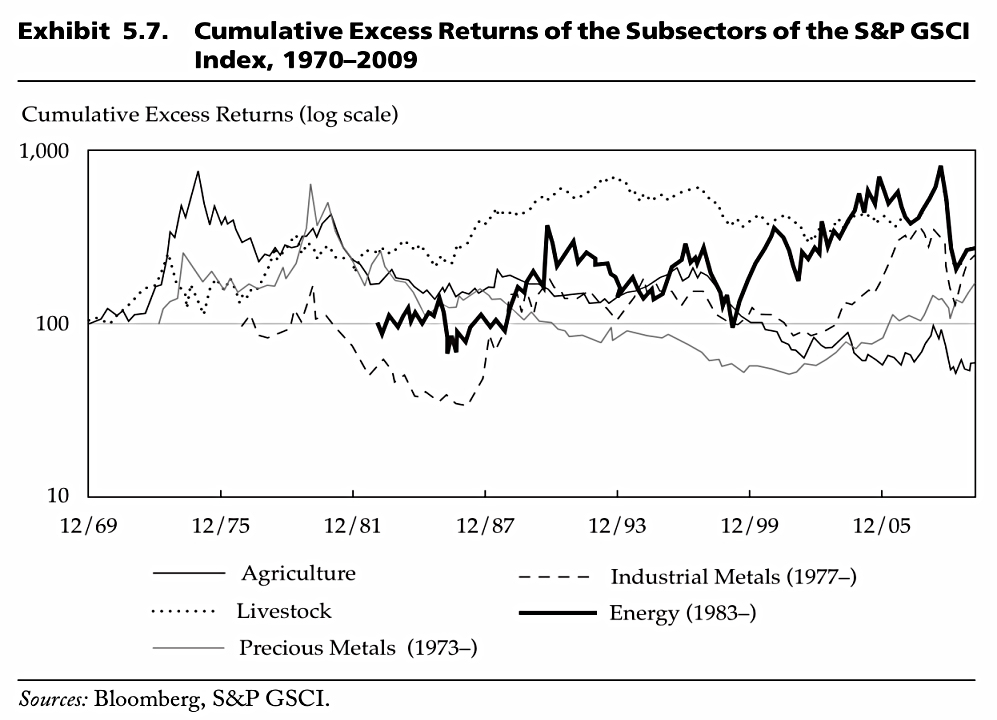
Commodities (especially energy) tend to be good inflation hedges. However, some commodity prices (notably industrial metals) are quite procyclical, perhaps increasingly so.
Finally, all commodities tend to benefit from loose monetary policy and easy credit and liquidity conditions.
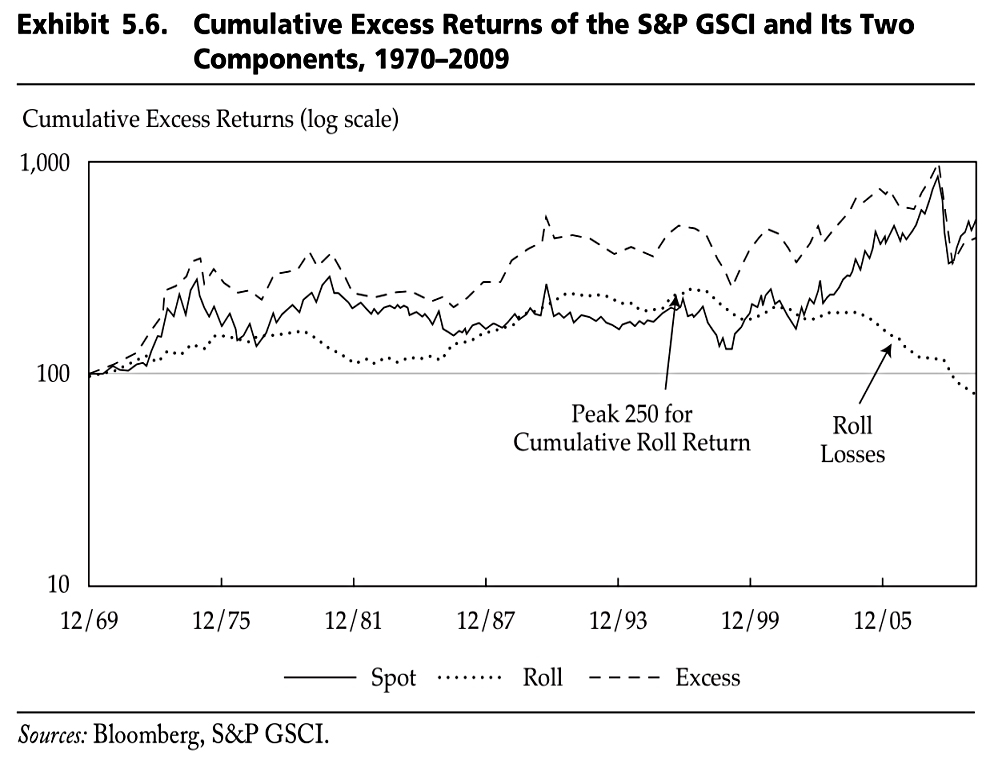
The return from futures contracts has three parts:
- spot price change (unexpected return),
- collateral return (riskless return), and
- roll returns (risk premium).
Collateral return refers to the margin income earned when buying futures contracts, typically earning the Treasury bill return.
Roll return depends on the shape of the futures term structure.
The change in the spot price (often proxied by the nearby futures price) is the most visible and volatile part of return.
The spot price change is the least important for long-term returns.
The long-run anchor for commodity prices reflects the marginal cost of production—albeit estimated with large uncertainty—while spot prices and the term structure largely reflect inventories and thus demand-and-supply conditions, which are more cyclical.
If the term structure is downward sloping (“backwardated” in commodities jargon), the roll return is positive as the second contract can be bought at a lower price than the first contract was sold.
Conversely, when the term structure is upward sloping (“in contango”), the roll return is negative.
According to Keynes, the term structure should normally be inverted (S > F) because producers create more hedging pressure than customers.
- Speculators taking the other side of the hedging trade can earn an insurance premium by bearing the price risk.
Storage and financing costs – and the “convenience yield” of holding inventory – can be used to explain either shape of the curve.
High storage costs (or high interest rates) can make spot prices systematically low relative to futures.
High current inventories have the same effect.
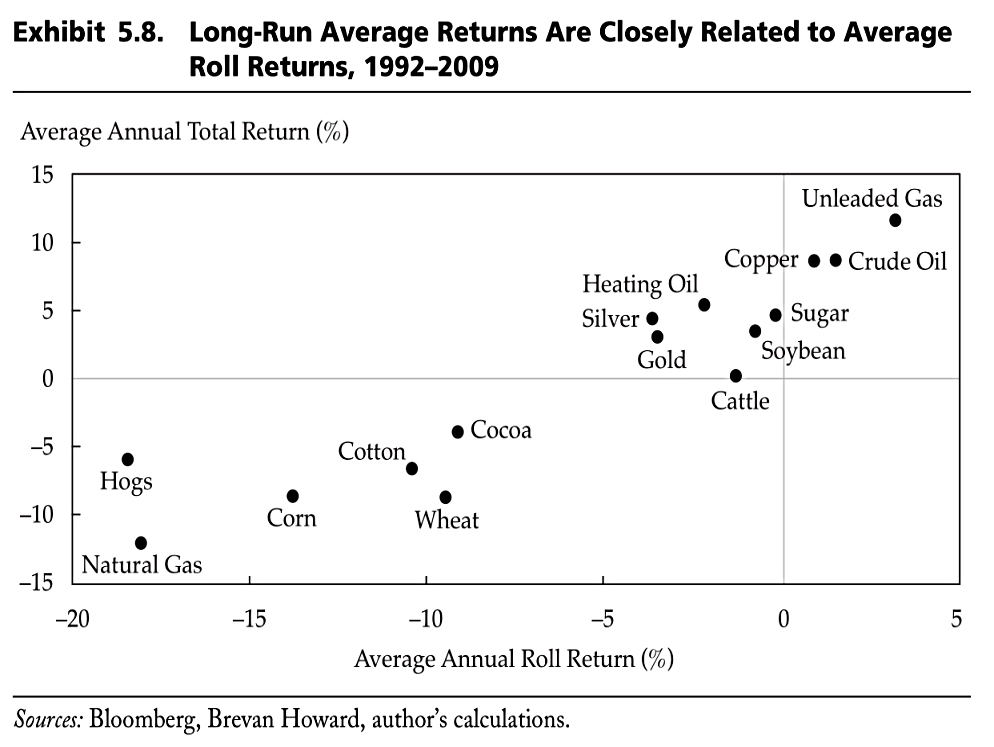
Long-run returns are driven by the roll, but this is less useful for short-term market timing in individual commodities.
A dynamic cross-commodity strategy based on the roll return—overweighting commodities with a currently backwardated term structure and underweighting those with a contangoed term structure—has added value over time.
The aggregate roll can be used to time an aggregate commodity portfolio.
- Momentum and trend-following are even more successful.
Hedge funds
Hedge funds began as long-short equity funds with high fees and withdrawal restrictions, but they have since diversified into many flavours and almost every asset class.
- They are best thought of as unconstrained funds and as a bet on the manger’s skill.
They no longer hedge away systematic risk, but rather seek out attractive opportunities, hedging away undesired exposures.
Global macro is probably the most interesting sub-class since these funds are tue diversifiers away from equities.
- In contrast, equity long-short funds remain Equity Alts.
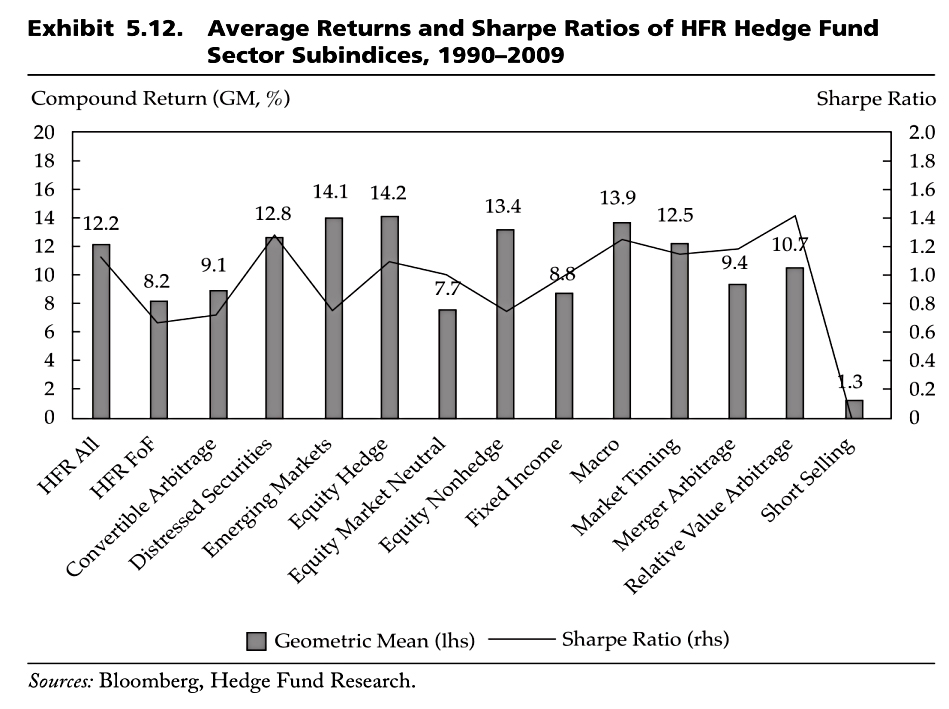
HFs have produced higher net returns and higher risk-adjusted returns than traditional equity/bond portfolios and have certainly outperformed cash, which is arguably the right benchmark for an “absolute return” manager.
They also “outperformed” (ie. lost less than) other active managers in 2008.
This good performance can be explained by a lack of constraints, manager incentives and diversification within the group.
- Alternatively, it can be explained through reporting biases (survivorship and backfill – reporting is voluntary) and the taking on of risks that are not captured by the Sharpe ratio.
It’s likely that the outperformance is not all alpha, and there might be no alpha at all.
Antti reports on work by Ibbotsen, Chen and Zhu (2011):
- Equally-weighted returns were 14.9% pa
- Adding back dead funds reduced returns to 11.7%
- Excluding returns from before the first date of voluntary reporting (to avoid backfill bias) reduced returns to 7.7%.
A bias-adjusted value-weighted portfolio (which overweights large funds) returned 11.8%.
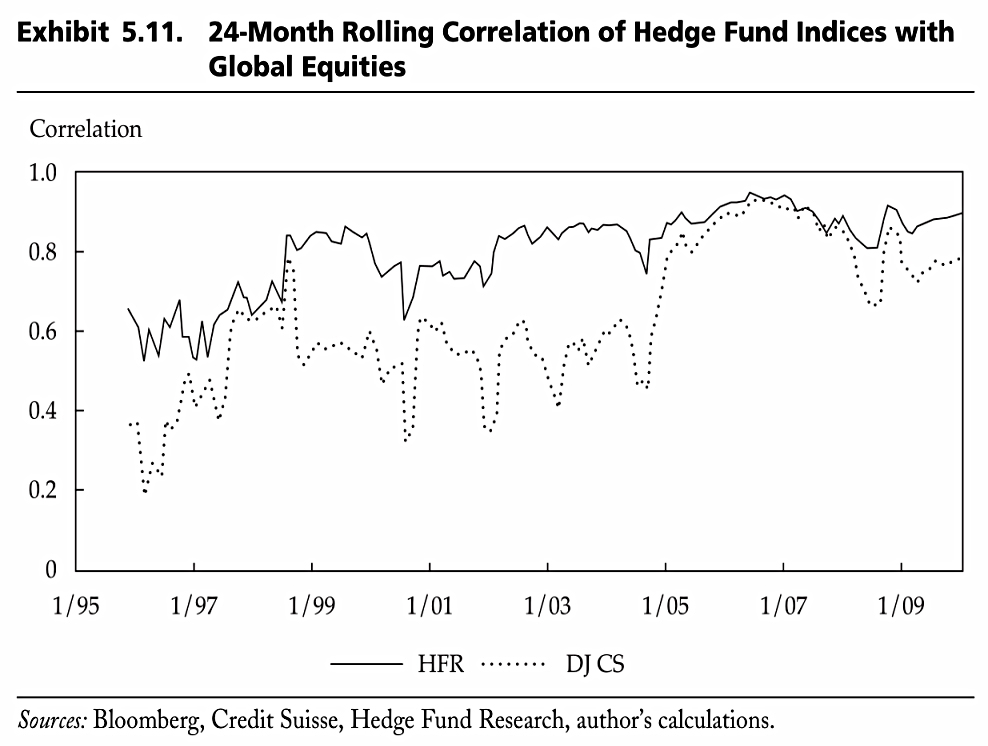
This chart shows the increasing correlations between global equities and two popular hedge funds.
- In order of increasing correlations, the best sub-sectors are short-sellers, trend followers, global macro and market-neutral funds.
Private Equity
We’ve looked at Antti’s thoughts on private equity in a previous article, so here I will focus on any new messages.
The first distinction is between VC (helping small companies to go public) and buyouts (of struggling public companies which are then taken private and are typically loaded up with tax-efficient debt).
- In the UK, private investors can access VC through VCTs, and (with more risk but perhaps less return) EIS and crowdfunding.
- Buyout PE is also available through a large number of investment trusts.
Here’s what we said about PE last time out:
- Private equity (PE) is hard to model because of a lack of good data and an artificial smoothing approach to pricing.
- The premium for PE (specifically, US buyouts and not VC) over and above lower-cost public equity is not large and has been shrinking over time.
- Investor demand has driven up PE valuations, and a large premium may not return.
- Nevertheless, institutional demand for PE is increasing – probably because of a preference for return-smoothing (lack of mark-to-market), particularly during market crashes.
- The return smoothing reduces the reported volatility and beta of PE, which in turn overstates the alpha and the diversification benefits (lower correlations) of PE.
- PE has several tilts over public equities – equity risk, illiquidity premium, (small) size and value.
- The equity risk comes from the 100% to 200% of debt for every dollar of equity that is typical in PE – Public firms average 50% of debt for each dollar of equity.
- PE has a beta well above 1, and its diversification benefits are artificially created through price smoothing.
- This strategy will survive a fast bear market like 2007-09 but will be exposed by a slower one.
PE funds earned 12.4% annually between 1986 and 2009 while VC funds earned 14.5%. These results clearly exceed the 9.2% return on publicly listed U.S. equities.
It seems that published PE fund returns are overstated and published risks understated (and underappreciated). The typical PE manager is skillful enough to outperform public indices on a gross basis, but the benefits of these skills accrue primarily to the manager and not to the investor.
Conclusions
A lot of what we’ve covered today will seem familiar, perhaps with the exception of the section on commodities.
We’ve now completed all of the preparatory work on Antti’s articles and slides.
- In the next article, we’ll start to look at the book itself.
Until next time.
Mike Rawson
Mike is the owner of 7 Circles, and a private investor living in London. He has been managing his own money for 40 years, with some success.


Small editorial point – your use of PE as an abbreviation for Private Equity gets read/interpreted as Price/Earnings, which may be a bit confusing
PE has 50 meanings, but in the context of alternative asset classes, I think most people would understand that it means private equity.