Factor Investing 2 – FaCS or Factors

Today’s post is the second in a series on factor investing, otherwise known as smart beta.
Contents
The story so far

A couple of weeks ago we took our first look at factor investing, sometimes known as smart beta.
Here’s what we learned:
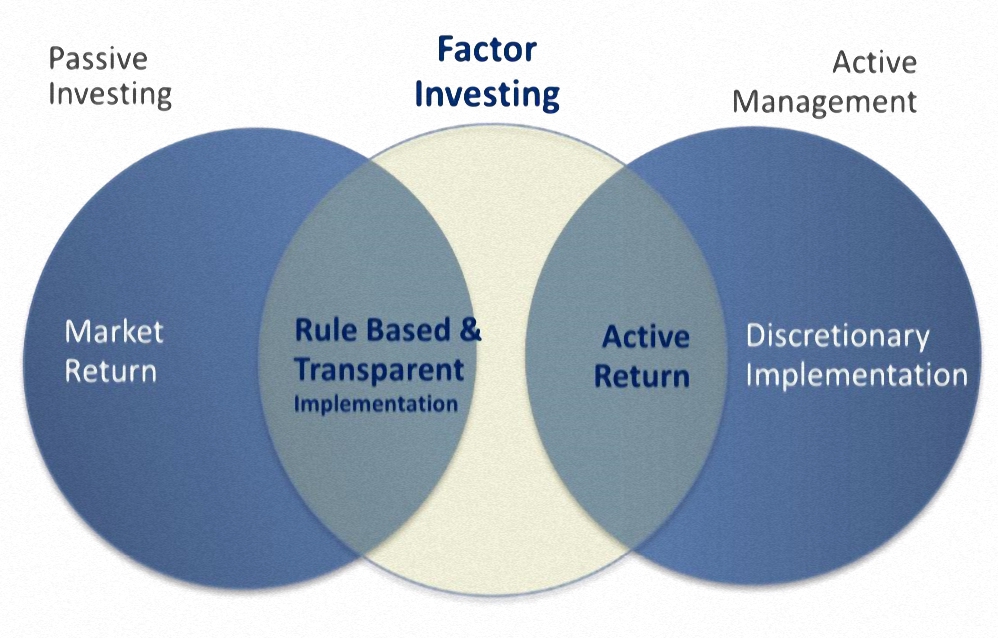
- Factor investing is the use of a rule other than market-cap weighting to allocate money within a pooled investment fund.
- Different observers would place factor investing at different points along the passive / active spectrum.
- They deviate from market-cap weighted indexes, which now monopolise the term “passive”.
- But factor funds require no active management from the private investor.
- MSCI (our data source for now) currently have six factors:
- Value
- Small Size
- Momentum
- Low Volatility
- High Yield / Dividend, and
- Quality
- All of the factors have been supported by academic research over varying look-backs of financial history, and across a variety of asset classes.
- But no factor works all of the time so diversification across factors is a good idea.
- A long time horizon and some kind of timing mechanism (momentum / trend following) for entry are also good ideas.
- There are three explanations on why they work – exposure to systematic risk, behavioural biases and (institutional) investor constraints.
- Recent very long-term studies have tended to support the behavioural explanation.

FaCS
Having just come to terms with MSCI’s list of six factors (I see yield as part of value, and struggle to pin down quality), the next paper I read introduced the FaCS classification, which has eight factors.
- Growth and Liquidity are the new faces.
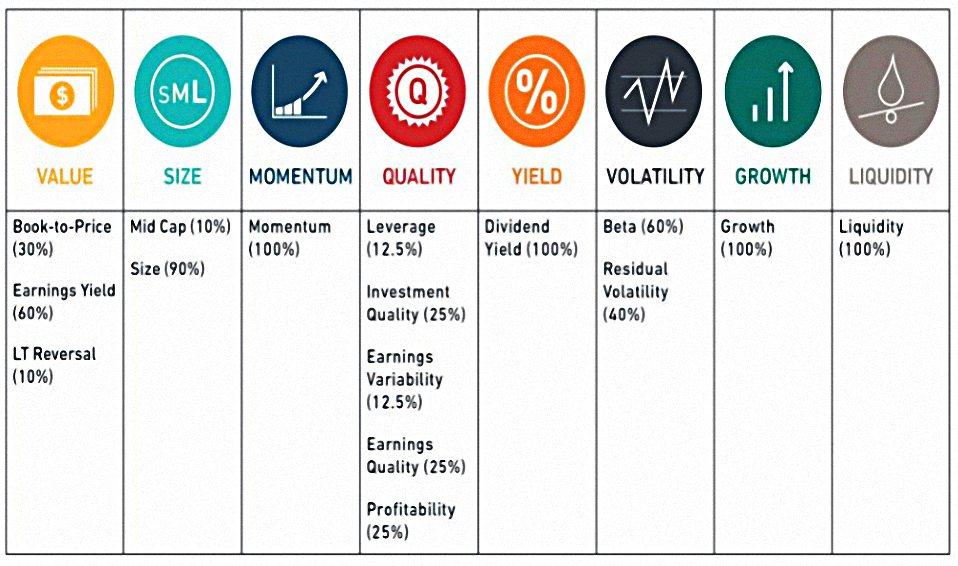
Even more disturbingly, the eight FaCS are derived from sixteen style factors in the GEMLT (Global Total Market Equity Model for Long-Term Investors).
- And the 16 style factors are in turn derived from 41 “descriptors”.
As Swift put it:
A flea has smaller fleas that on him prey;
And these have smaller still to bite ’em,
And so proceed ad infinitum.
GEMLT was produced by Barra – now part of MSCI – in 2016.
- It’s their fourth-generation model in a series of research papers dating back to 1973.
MSCI seem to intend FaCS to be used to hold mutual funds to account in a Ronseal sense – to see if they do what it says on the tin.
- Whether we as private investors will be able to find funds which track these new factors is another question.
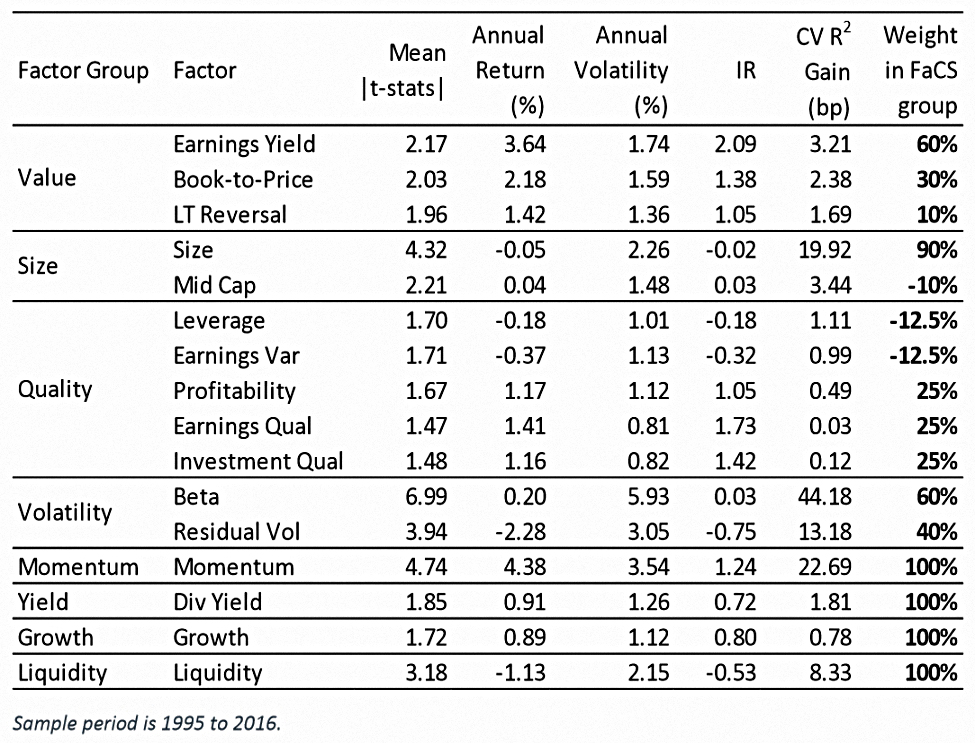
MSCI have found that factors are responsible for around 55% of mutual funds active returns. Within this:
- style factors contribute 35%
- country and industry factors contribute 25% each
- currency factors contribute 15%.
Factor exposures
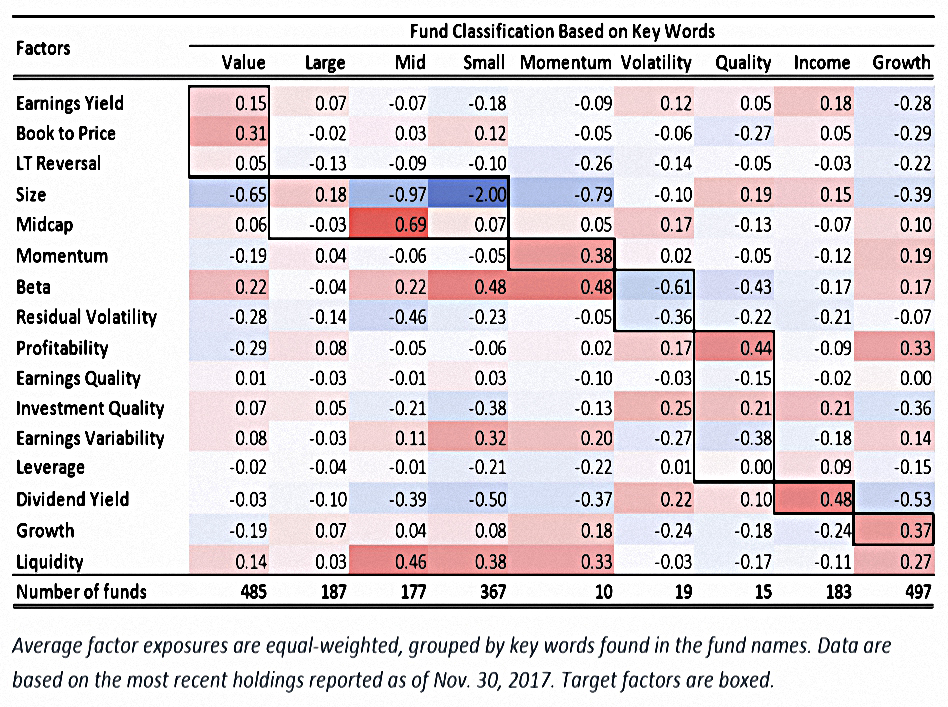
The table above shows the exposures of various types of fund to the 16 GEMLT factors.
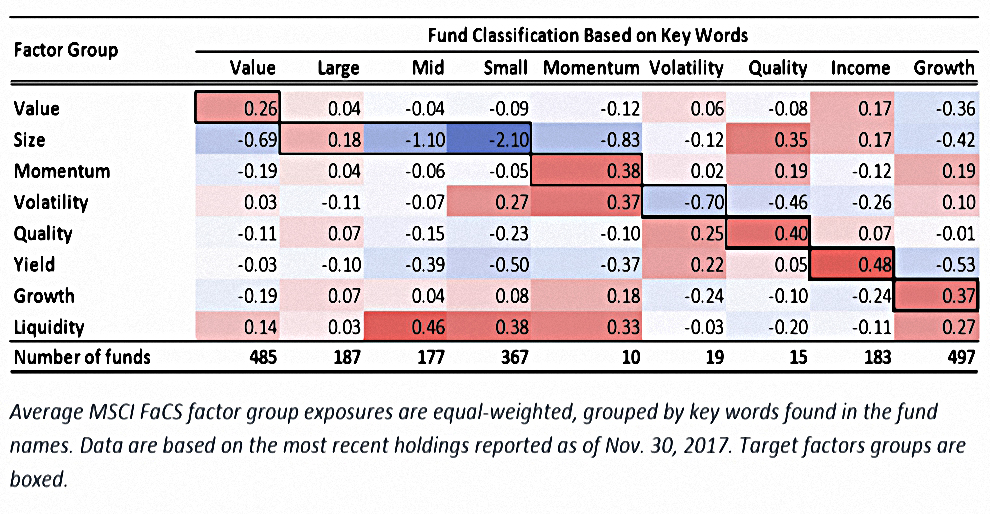
Here’s a similar table, but using the “new” FaCS factors.
- Both sets of factors seem to be consistent with the strategies used by US active mutual funds.
Applications
MSCI identify three applications for the FaCS:
- fund reporting,
- comparing funds and
- assessing style drift.
The first looks to be mostly of interest to industry professionals, but the last two could be useful to private investors.
Reporting
To illustrate the reporting aspect, MSCI map the FaCS to the existing factor indices for Value, Momentum and Quality.
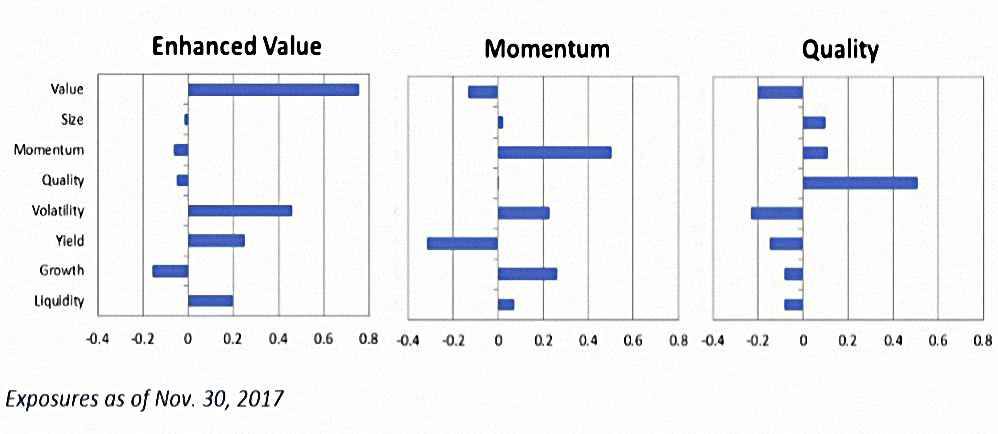
I’m not sure this helps me much.
Comparing funds
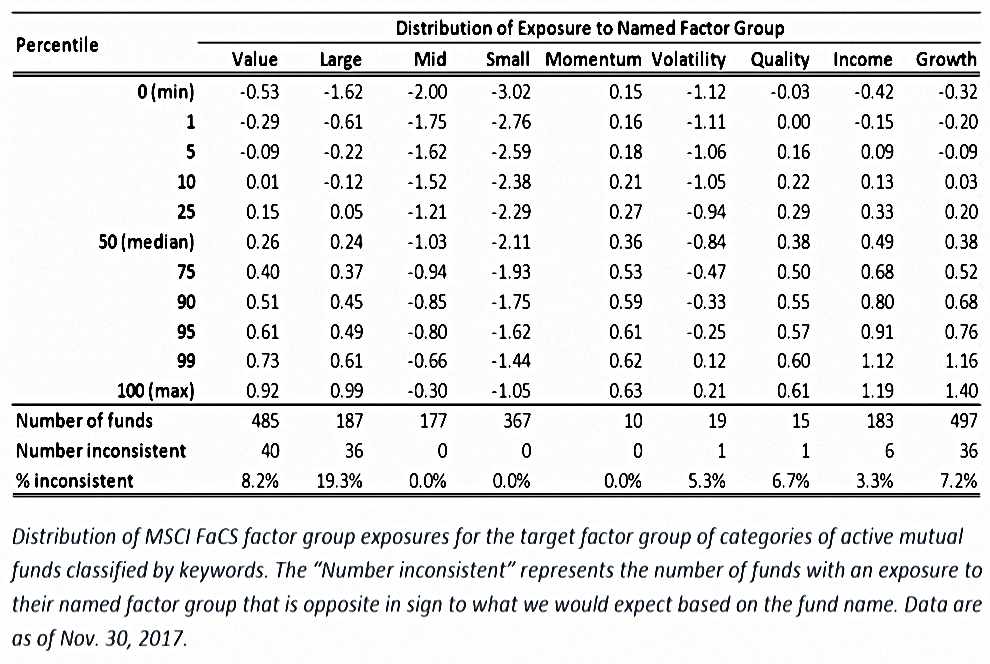
For this application, MSCI present an alternative version of the factor exposure table above.
- A notable addition is the percentage of funds with inconsistent exposures.
Bizarrely, the large cap group seems to be the worst offender, with almost 20% of firms showing inconsistent exposure.
- Again, I’m not sure what to do with this result.
MSCI also found overlaps / confusions between (quality & dividends) and ()growth & quality).
- And even where there was no inconsistency, there was wide variation in exposure to the desired factor.
These issues should be limited to active funds.
- Smart beta funds which track a factor index should have a high factor exposure and no inconsistency.
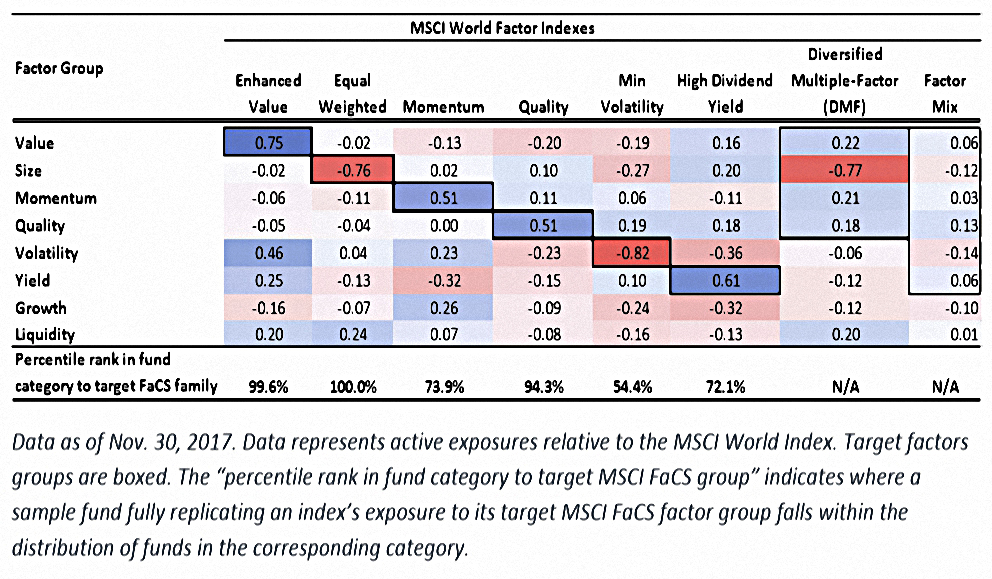
The table above shows that factor index funds do have much better exposure.
- The worst performing category was Min Vol, where the index fund would have ranked only in the 55% percentile amongst active funds.
- In contrast, the Value and Equal Weight index funds rank in the 100th percentile.
Momentum, Quality and Yield index funds all did acceptably well (73rd to 95th percentile).
Style drift
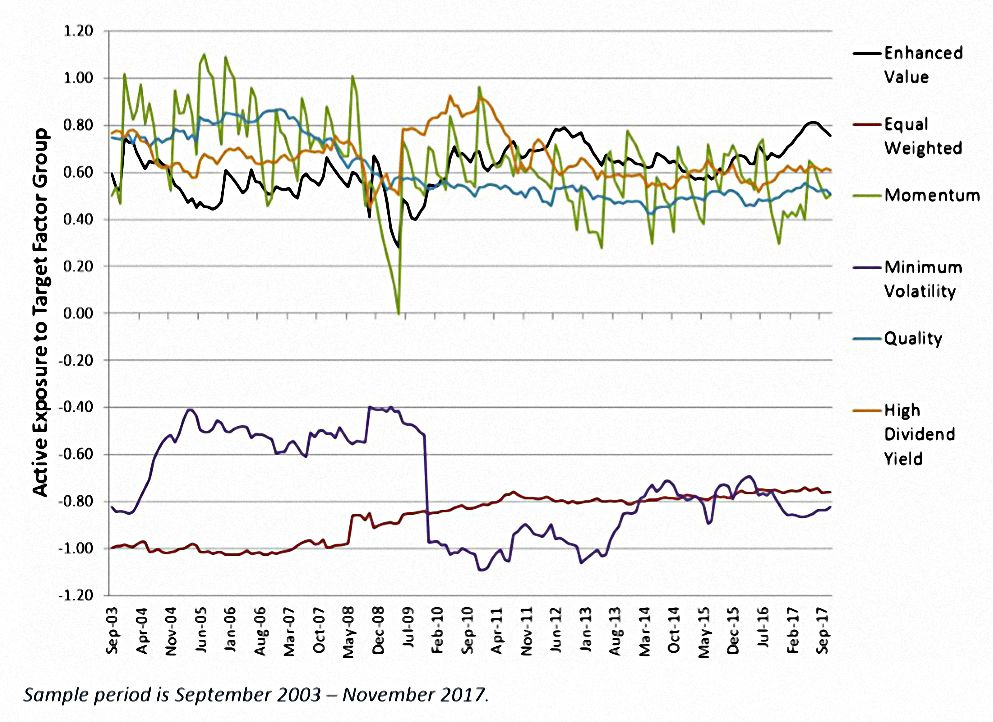
Style drift is assessed by plotting factor exposures over time.
- Momentum shows the fastest changes in exposure, but there’s not too much evidence of drift even here.
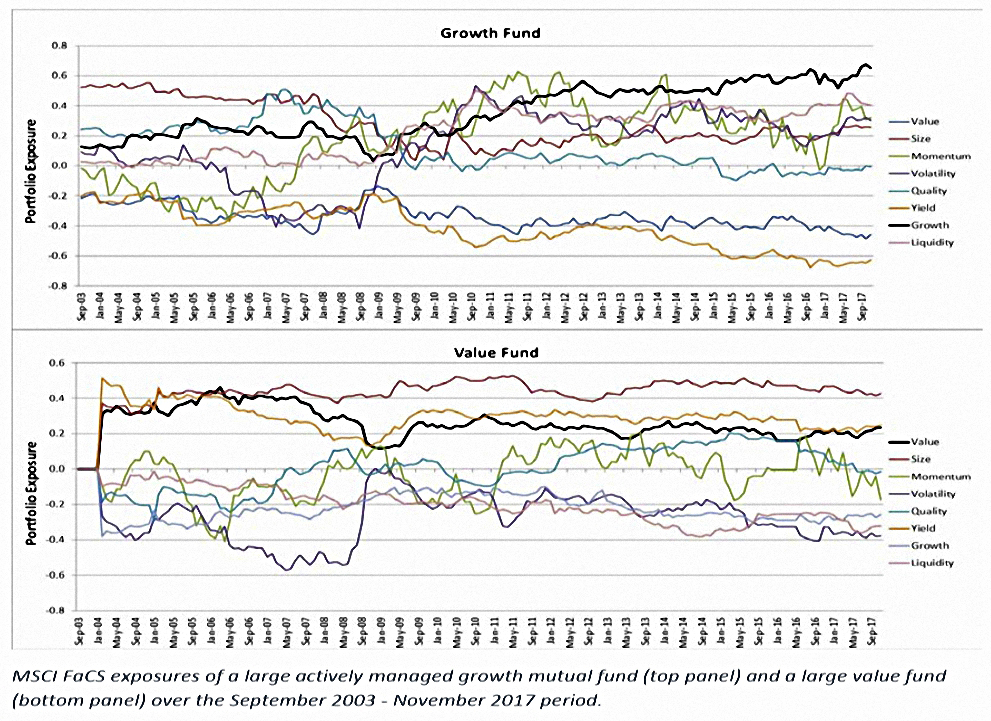
This chart shows factors exposures over time for a large active growth fund, and for a value fund.
- This kind of analysis is best suited to active funds, as factor index funds should retain fairly constant factor exposures over time.
Conclusions
It’s been a bit dry for me today. I’ll take away two points:
- There are lots of ways to slice and dice factors.
- The factors index funds do a decent job of providing exposure to the correct factors.
What will matter in practical terms is which factors we can cheaply buy exposure to.
- So in the follow-up article, I’ll take a break from the MSCI papers, and look at which funds are available.
Until next time.
Mike Rawson
Mike is the owner of 7 Circles, and a private investor living in London. He has been managing his own money for 40 years, with some success.