Smart Beta Goes Wrong – Research Associates

Today’s post looks at a couple of reports from Research Associates on the subject of Smart Beta.
Contents
Horribly Wrong
The first paper dates back to 2016 and is called “How Can Smart Beta Go Horribly Wrong?”
- It was written at a time when smart beta strategies were attracting a lot of money based on historical (paper) performance.
The authors compare this to the performance chasing often seen in actively managed funds.
If the strong performance comes from structural alpha, terrific! If the performance is due to the strategy becoming more and more expensive relative to the market, watch out!
There are four key points in the paper:
- Excluding valuation changes, factor returns are generally lower than recent (in 2016) performance would suggest.
- Value-add can be structural/repeatable or situational (driven by rising valuations)
- Performance-chasing investors push valuations higher, increasing the risk of mean reversion to historical valuation levels (and hence of poor future performance)
- The recent (in 2016) popularity of smart beta makes a future crash a reasonable possibility.
Many of the most popular new factors and strategies have succeeded solely because they have become more and more expensive.
It should be noted that Research Associates (RA) were one of the first smart beta practitioners.
Tech bubble
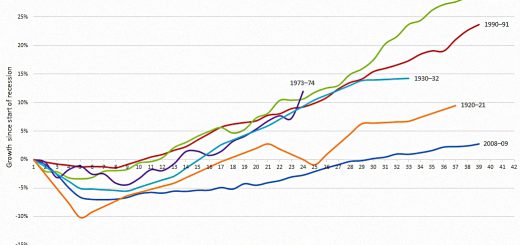
RA draw parallels with the cot com bubble of 1999:
Over the second half of the 20th century, the S&P 500 Index produced a 13.5% return (an annualized real return of 9.2%) and 10-year Treasuries a 5.7% return (an annualized real return of 1.6%). The investing industry embraced these historical returns as gospel in setting future return expectations.
Unfortunately, the returns were driven by rising valuations.
Fully 4.1% of the annualized 50-year (1950–1999) stock market return— nearly half of the real return!—came from rising valuations as the dividend yield tumbled from 8% to 1.2%. The Shiller PE ratio more than quadrupled from the post-war doldrums of 10.5x to a record 44x. If we subtract nonrecurring capital gains (for stocks) and losses (for bonds) from market returns, the adjusted historical excess return falls to 2.5%.
The industry should have been expecting lower future returns (from mean reversion) rather than a continuation of multiple expansions.
Even after the stellar bull market since early 2009, the annualized real return on U.S. stocks from 2000 to 2015 has averaged a scant 1.9% (not even matching the average dividend yield), while U.S. bonds have delivered an outsized real return of 3.6%. The “excess return” for stocks has been negative by a daunting 1.7% a year.
Even 50 years of returns cannot be relied upon.
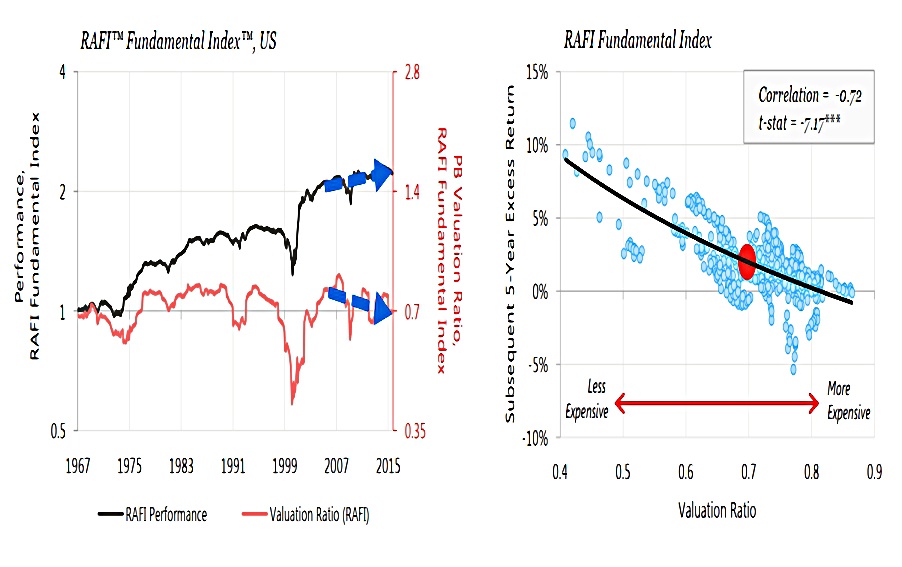
Value factor
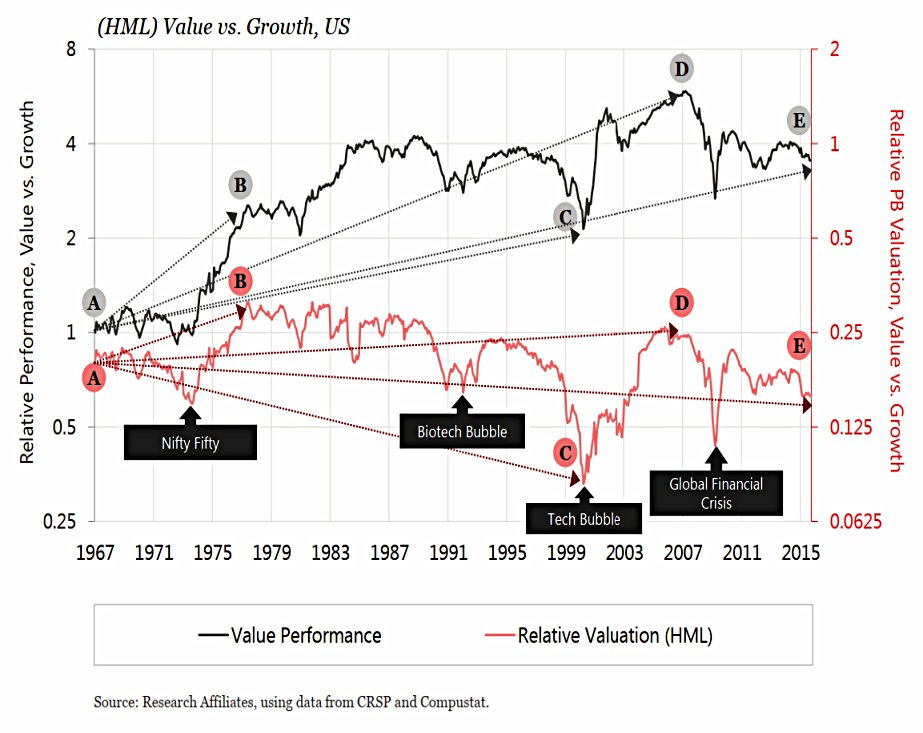
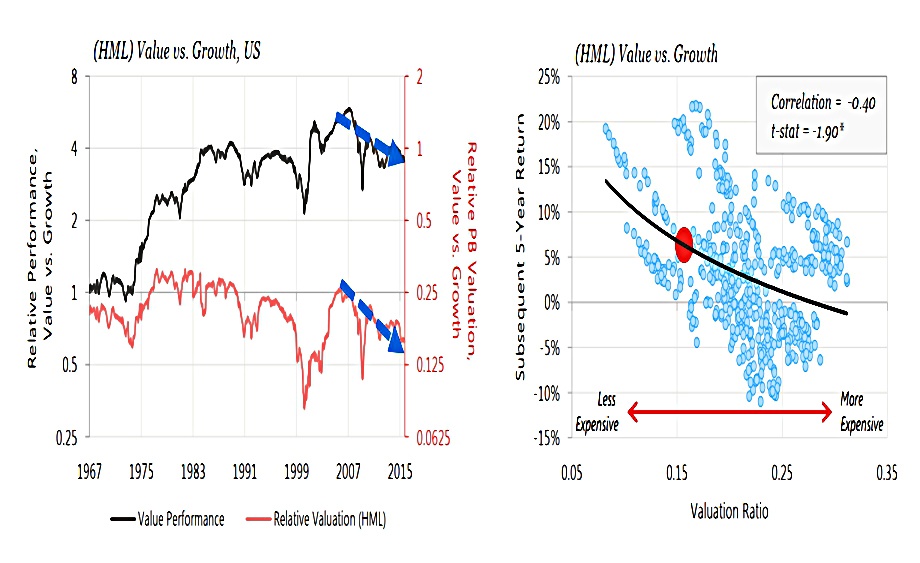
The black line shows the absolute valuation of value stocks, and the red line shows the relative valuation (compared to growth stocks).
For the past eight years, value investing has been a disaster with the Russell 1000 Value Index underperforming the S&P 500 by 1.6% a year, and the Fama–French value factor in large-cap stocks returning −4.8% annually over the same period. But, the value effect is far from dead! In fact, it’s in its cheapest decile in history.
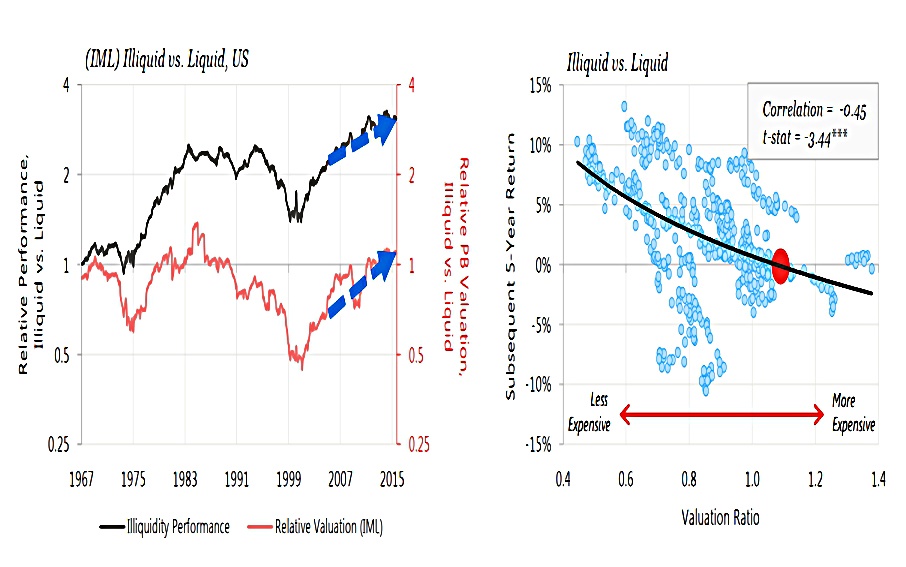
Relative valuation
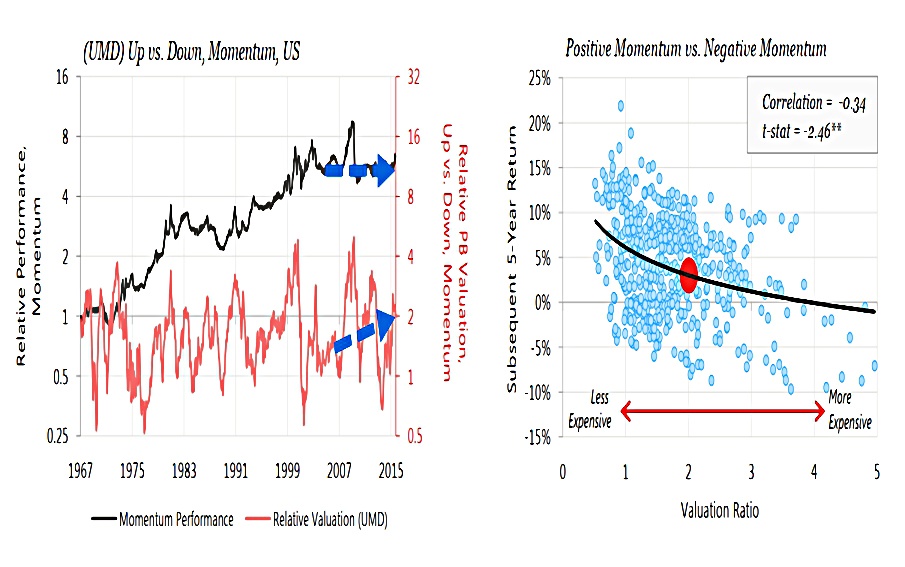
The paper looks at six factors: value, momentum, small-cap, illiquid, low beta, and high profitability.
Performance appears closely matched to changes in relative valuation levels for four of the six factors, with the exception of momentum and perhaps low beta.
Momentum and low beta share the characteristic of rapid turnover, which means that the changes in valuation will change with portfolio changes, rather than from the stocks becoming more or less expensive.
The positive momentum factor portfolio will usually trade at a premium because high momentum stocks have, by definition, risen in price. The higher a strategy’s turnover, the less informative are valuation changes.
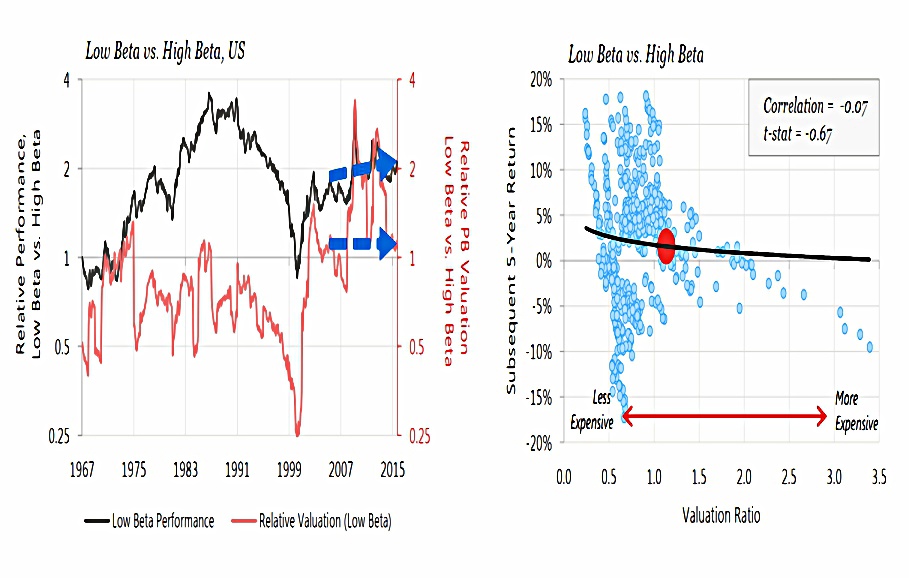
The other takeaway is that the normal valuation for a strategy can change as the market evolves.
- A good example is low beta, which has only recently become popular and whose valuation has been driven to an all-time high.
Until those high valuations mean revert, the link between valuations and returns will seem weak.
RA Smart Beta
RA uses a narrower definition of smart beta, which has two requirements:
- the strategy must sever the link between the price of a stock and its weight in the portfolio
- a smart beta strategy should include most of the advantages of conventional indexing, such as low turnover, broad market representation, liquidity, capacity, transparency, ease of testing, low fees, and so forth
This leaves them with six strategies:
- equal weight
- Fundamental Index (an RA TradeMark)
- risk efficient (from EDHEC)
- maximum diversification (as popularized by TOBAM)
- low volatility
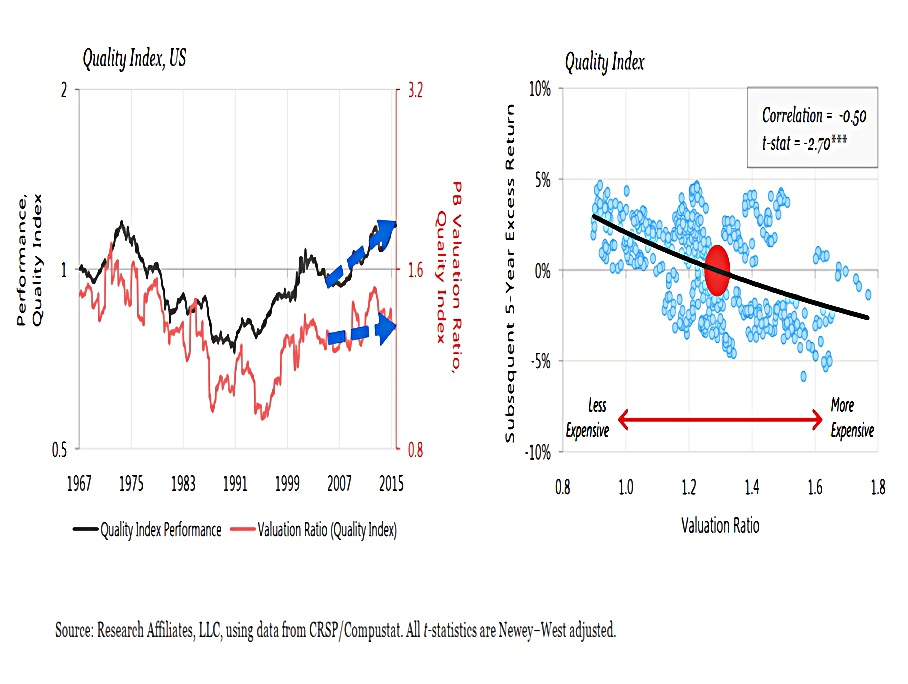
- quality (based on profitability, leverage, and earnings volatility)
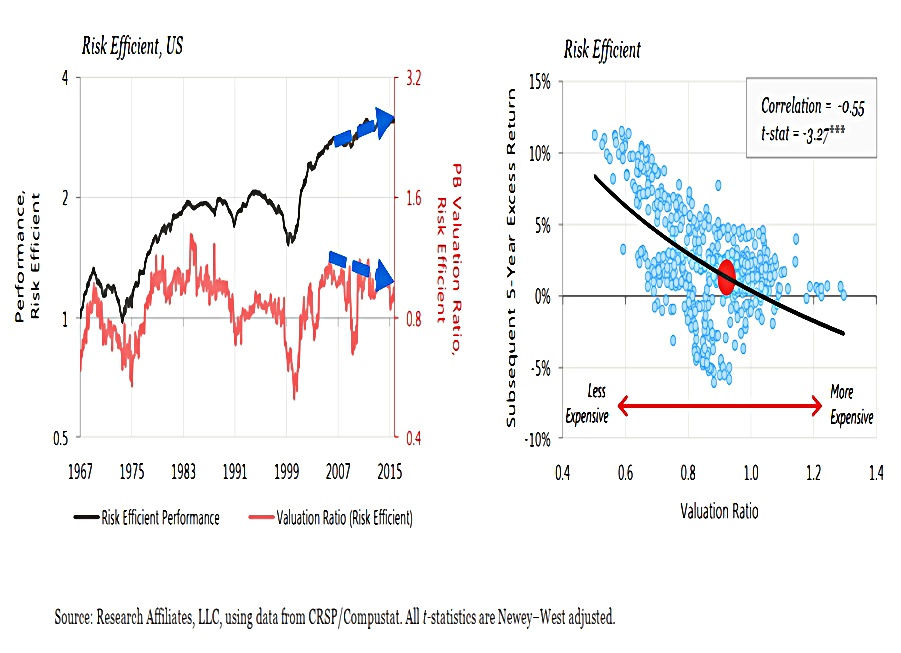
RA make several points:
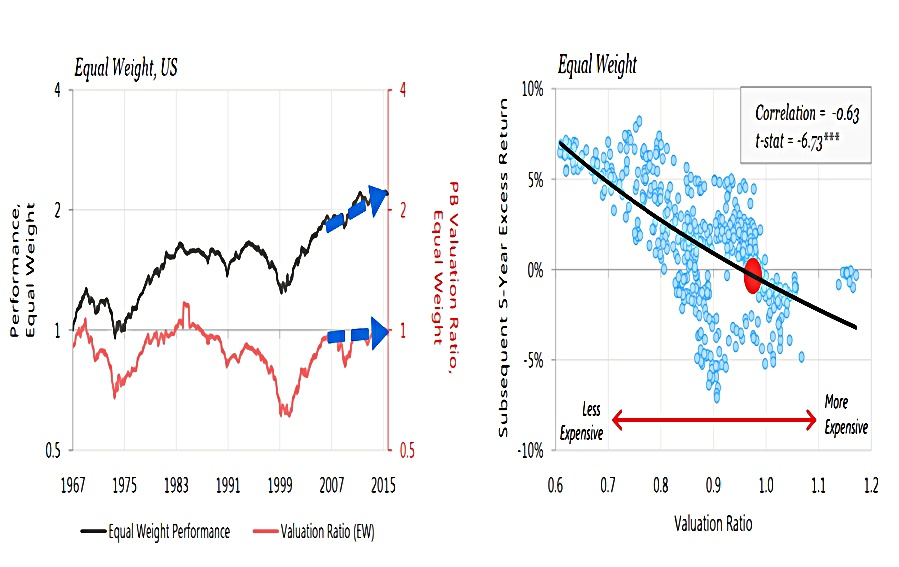
- For equal weight and Fundamental Index, a significant wedge between performance and relative valuation level develops over time.
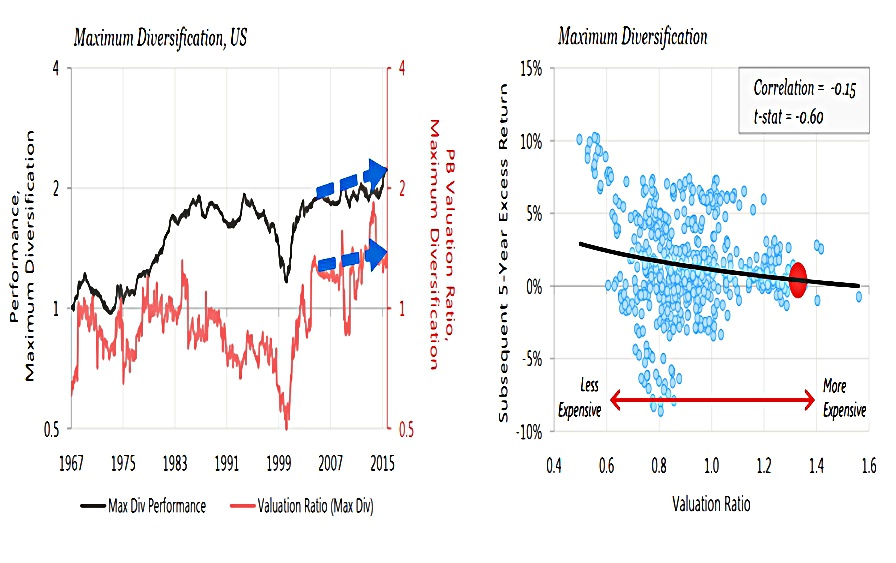
- For the maximum diversification and risk-efficient strategies, the return due to changes in valuation is significantly more volatile than for the other strategies.
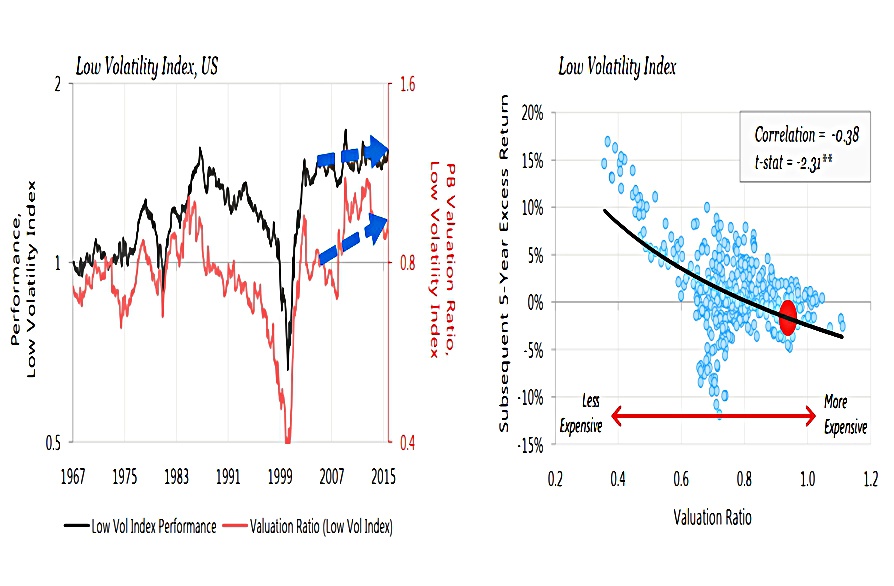
- Low volatility’s story is similar to the one told by the low beta factor: changing valuations explain much of the past performance.
Return decomposition
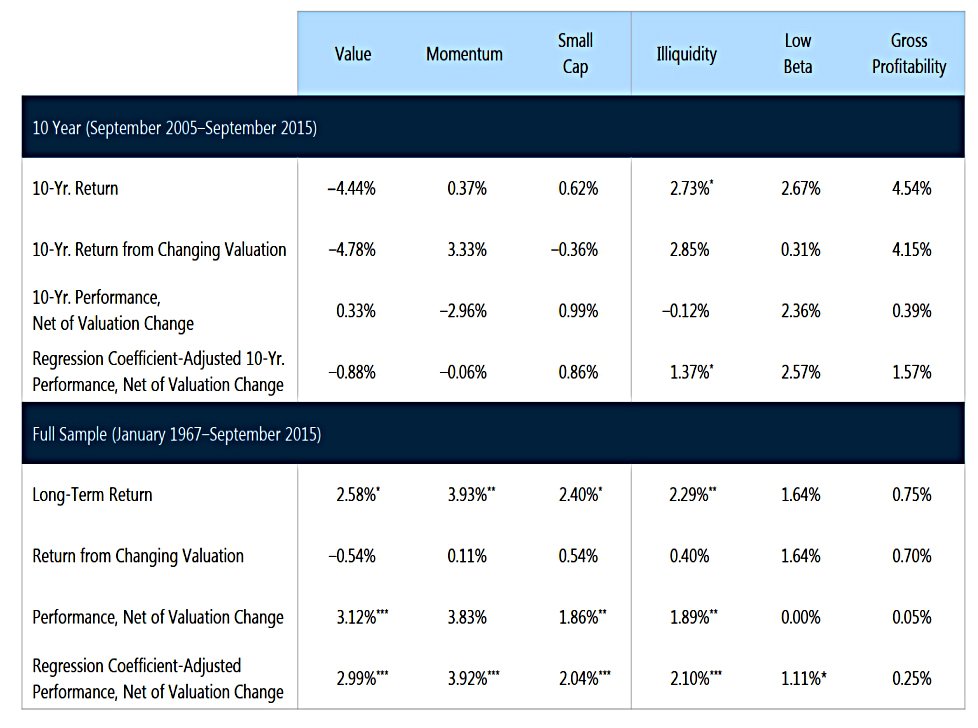
RA break down the returns from both sets of factors and provide two estimates of valuation-adjusted performance:
- performance net of valuation change, and
- adjusted performance net of valuation change, which we calculate by subtracting only a regression-based fraction of the changes in valuation
Over the last 10 years:
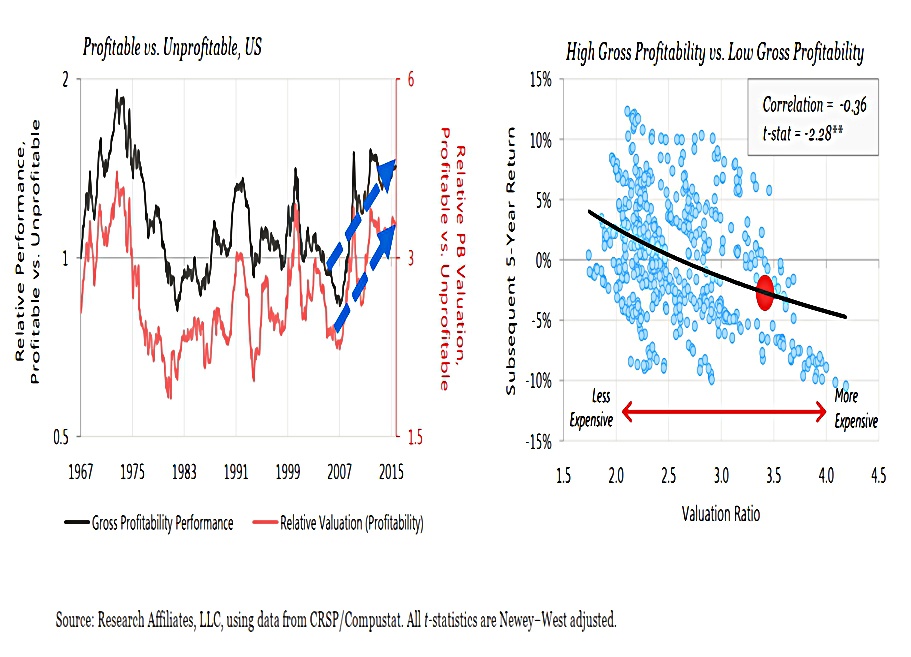
Gross profitability had the best performance, while value had the worst. Essentially all of the outperformance for profitability is due to rising valuations. Rising valuations also provided a substantial tailwind for momentum and illiquidity. Value has floundered
because it was out of favor and becoming ever cheaper!
Over the long term, all factors had a positive performance.
This should not be surprising as the popular factors were identified and published because they had high past performance. The two factors with the lowest overall full-sample performance are gross profitability and low beta, despite their brilliant performance record during the past decade.
But even over the long term, valuations are important:
Net of rising valuation, the value added by low beta disappears entirely or is reduced by a third, considering the more conservative regression-adjusted estimate; the same holds true for gross profitability.
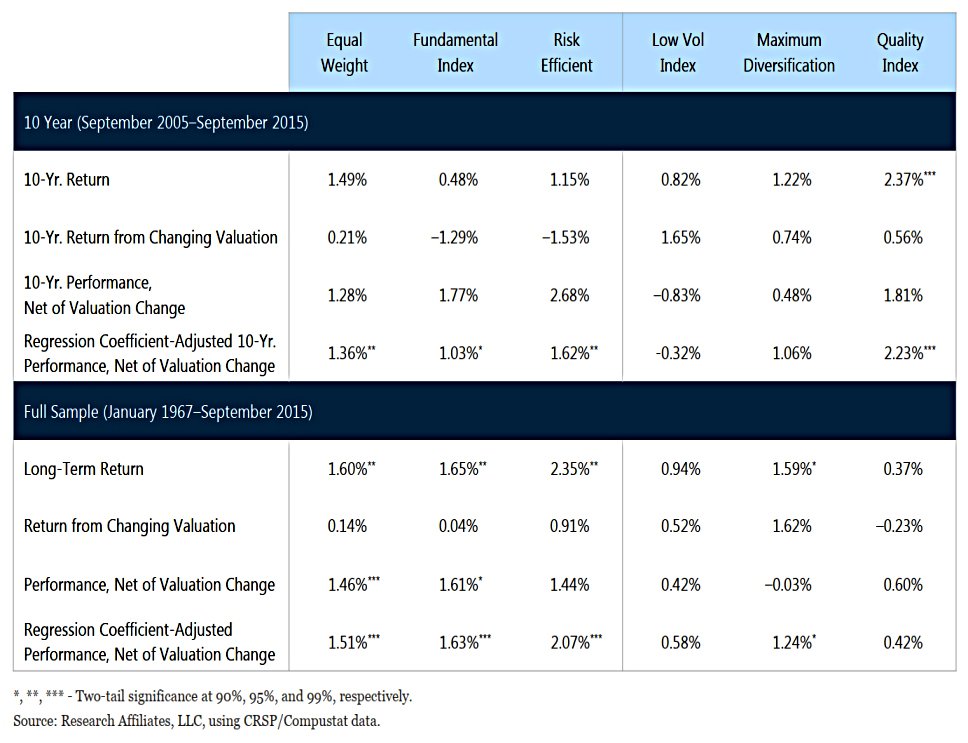
The RA smart beta strategies did well over the short and long term.
Strategies hurt most by the declining valuations over the last decade are risk efficient and Fundamental Index. But despite valuations moving in an adverse direction, both strategies were able to outperform. Low vol, maximum diversification, and quality strategies all experienced a large performance tailwind from rising relative valuations.
Takeaways
All of the popular factors and strategies exhibited a historical pattern of mean reversion in relative valuation, with no exceptions. They tended to perform best when their valuation multiples (relative to the market) were abnormally cheap; this typically occurred after a period of lousy performance. They performed worst when they were abnormally expensive, often after a period of outstanding performance.
RA stress that it is important to remove the effect of changing valuations on past returns from factors and smart beta.
- We also need to allow for the possibility of future mean reversion to historical levels of valuation.
Today, only the value category shows some degree of relative cheapness, precisely because its recent performance has been weak! Normal factor returns, net of changes in valuation levels, are much lower than recent returns suggest.
That Was Then, This Is Now
In January 2023, RA went back to their 2016 paper to see what happened.
- The new paper is called “Revisiting Our ‘Horribly Wrong’ Paper: That Was Then, This Is
Now”
Did smart beta go horribly wrong? Yes and no. Almost all variants of smart beta fell far short of artificially inflated expectations. Many failed outright, delivering negative alpha.
But they have better news for current investors:
Today, we are bullish for the mirror image of the reasons we were cautious in 2016. With 11 factors trading in the cheapest quintile of their historical relative valuation, the return
prospects of multi-factor investing appear promising over the next several years.
Current valuations
The 2023 review looks at five factors:
- Quality – gross profitability, defined as revenues minus cost of goods sold, divided by assets
- Low beta
- Momentum
- Size (small versus large market-cap)
- Value (price to book value)
And across four market sectors:
- US Large cap
- US Small cap
- developed ex-US, and
- emerging markets
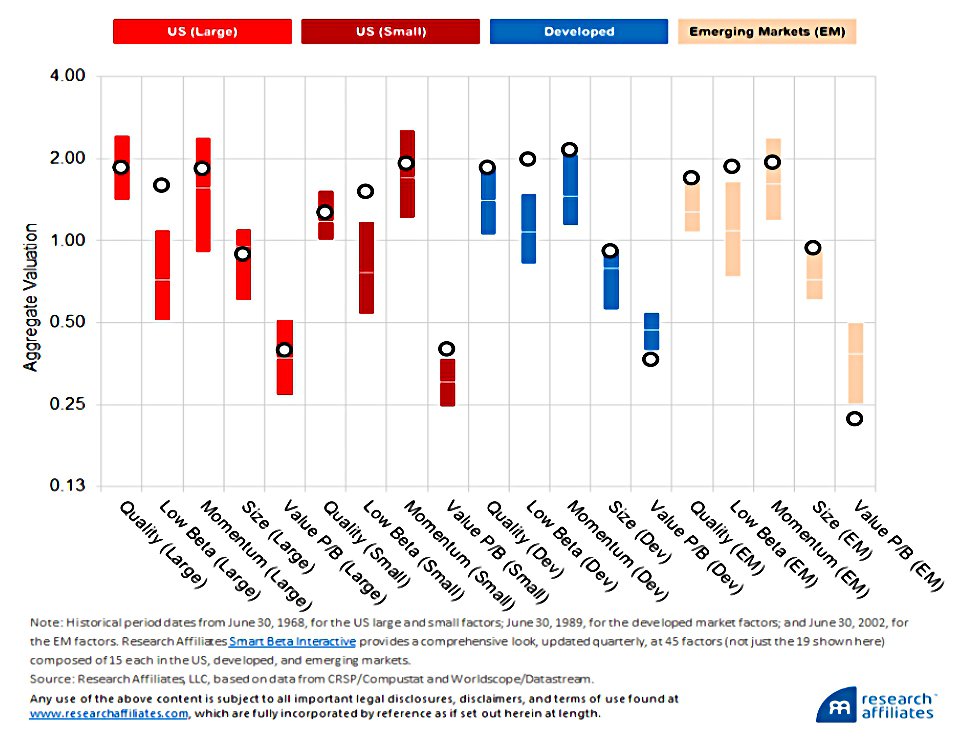
The bars show the 10th and 90th percentiles of historic valuation.
- The white line is the median valuation, and the circle is where we are now.
In 2016, most factors were expensive, so it is no surprise that they later fell short of expectations.
By September 2022, things look cheaper.
Low beta has swung from very expensive to very cheap for US large-cap stocks, as has momentum. Over the last six and-a-half years, value fell far short of expectations, in part because value stocks got much cheaper relative to growth stocks.
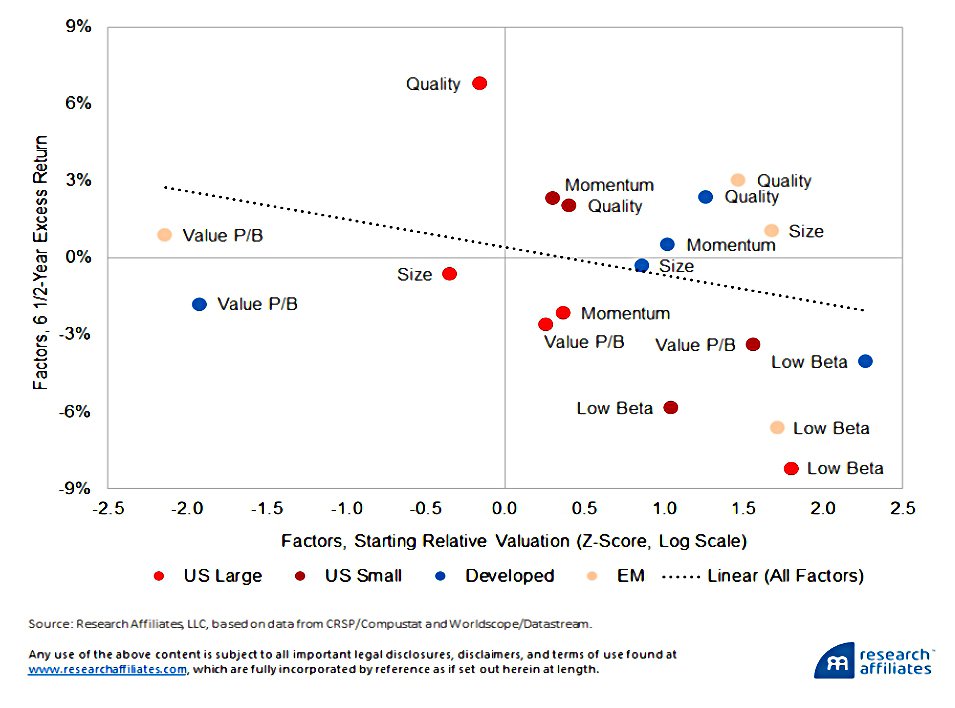
If the relationship between relative valuation and performance is as powerful over the next few years as it was since 2016-17, the 11 factors trading in the cheapest quintile of historical relative valuation should beat the five that are trading rich by perhaps 1000 basis points over the next five years—a worthy margin of victory. Now appears to be a particularly promising time to embrace multi-factor investing.
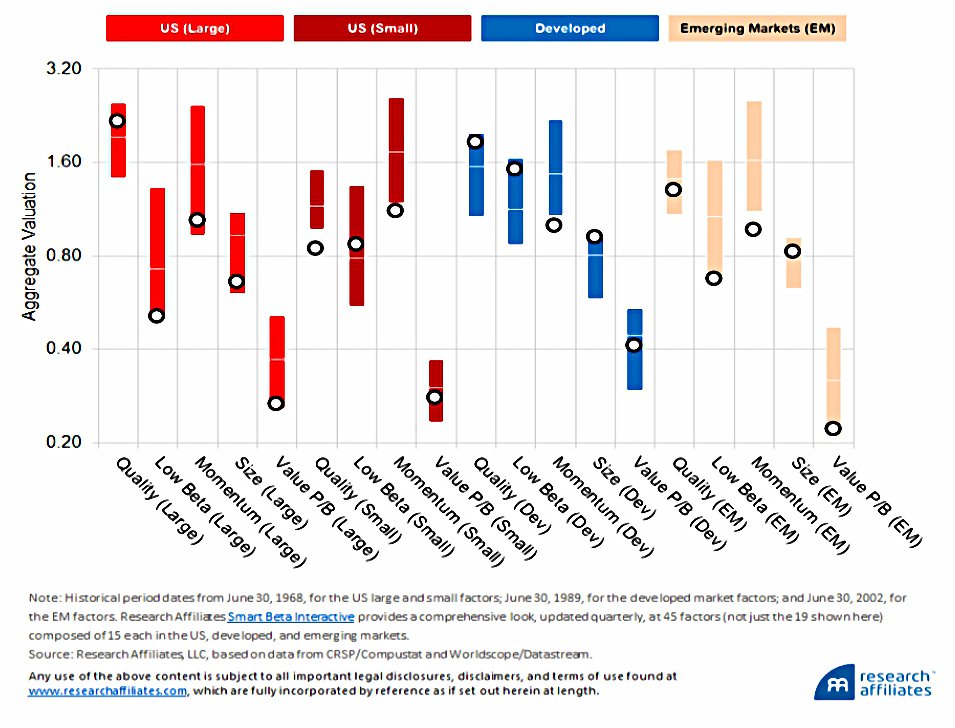
Covid
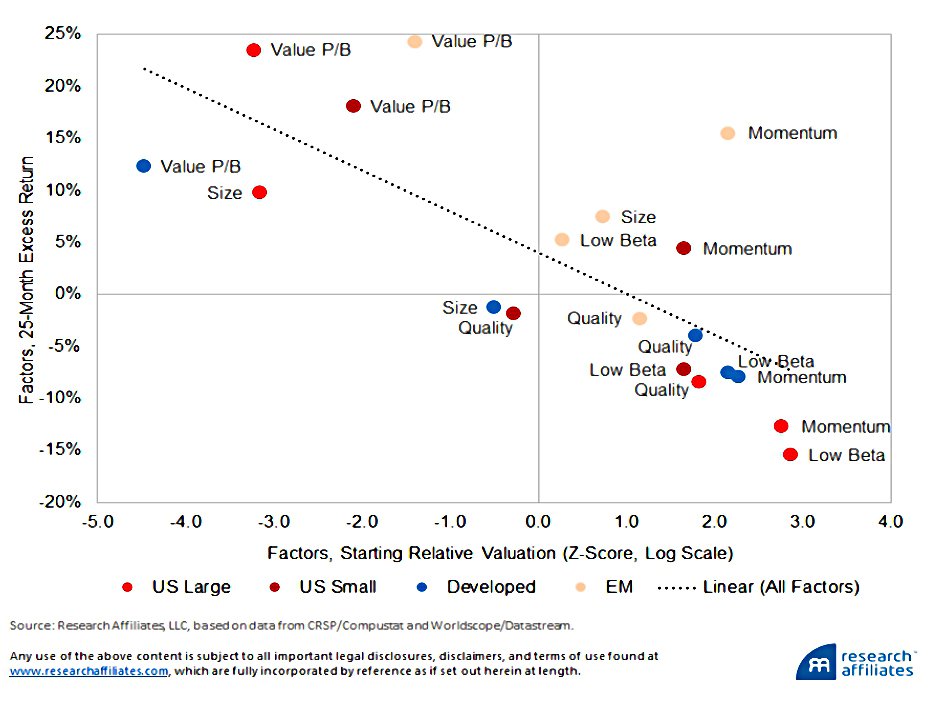
RA back up their valuation thesis by looking at the performance of factors since their post-Covid nadir of valuation, in August 2020.
No one knew how long lockdowns would last. Nor could we know how much of the economy was headed for bankruptcy or how long the wait would be for an effective vaccine. 15 of the 19 factors were in either their richest or cheapest decile in history, with 6 (US large low beta, US large momentum, US large value, Developed value, EM momentum, and EM value) in their most extreme percentile ever.
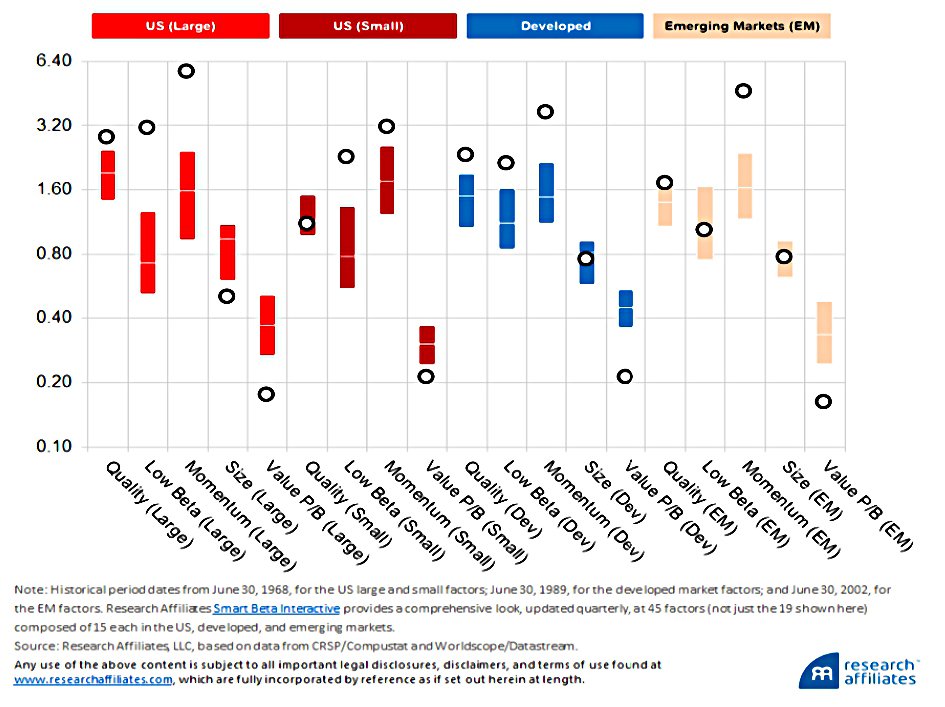
The 10 factors in their richest decile in history as of August 31, 2020, lost an average of 8% over the subsequent 25 months. The 5 factors in their cheapest decile ever earned an average of 41% in the same brief time span.
That’s it for today.
- I find the two papers taken together pretty compelling on the idea of using valuation to time entry to factor strategies.
Until next time.
Mike Rawson
Mike is the owner of 7 Circles, and a private investor living in London. He has been managing his own money for 40 years, with some success.