How many stocks?

Today’s post looks at a recent paper from NDVR called How Many Stocks Should You Own?
NDVR
I hadn’t come across NDVR before.
- They are a Boston-based high net-worth advisor with a high-tech approach to the investment process.
They have a couple of trade-marked products called Portfolio Lab and Construction Alpha.

The report has two authors, the first of whom is Yin Chen, a research director at NDVR.

The second author is Roni Israelov, who is Chief Investment Officer and President at NDVR.
- Roni used to work at the quant firm AQR and has written quite a few papers.
How many stocks?
Before we get started, I should declare that I have a dog in this fight.
- I am a huge believer in diversification, and I usually have close to 400 open positions at any one time (though often less than 100 of these will be in individual stocks).
The industry consensus, however, is that 20 to 30 stocks are plenty (though as the paper points out, a few people suggest 60-80 stocks).
The basic model used in the paper is that the market has annual volatility of 15% and each stock has a volatility of 45%.
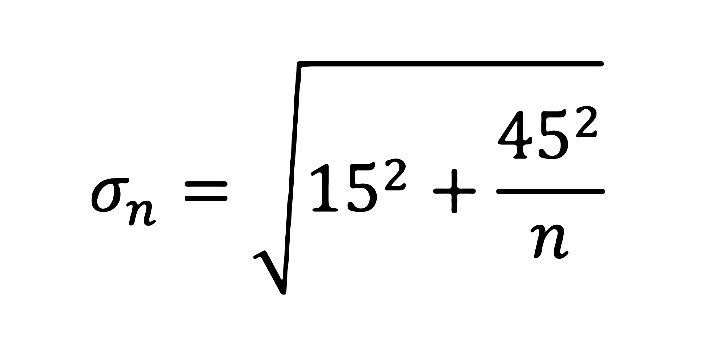
The formula for the volatility of a portfolio of n stocks is given above.
- Plotting this for n from 0 to 100 gives the following:
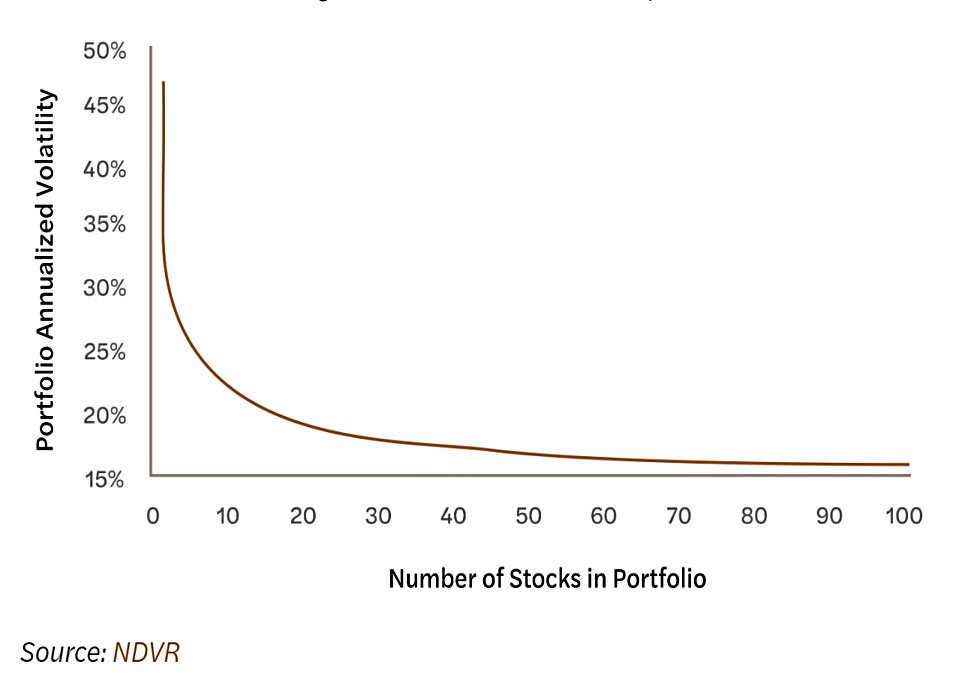
This is where the idea of 20 to 30 stocks being enough comes from.
- Volatility falls as the portfolio size increases, but it never stops falling, and the investor has to decide when it is lower enough.
There are diminishing returns to adding each additional stock, and most people would give up before they hit 30.
- Even at 100 stocks, the volatility is higher than that of the market.
The study
NDVR looked at an investor with a 25-year time horizon who rebalances his portfolio of n randomly-selected stocks each month.
- They looked at 5,000 simulated portfolios for each value of n, using data from 1995 through 2019. (( Delisted stocks were replaced by another randomly-selected stock the following month ))
They measured three things:
- ROCI (returns) after 25 years
- The distribution of annual volatilities
- The distribution of annual returns
Luck
NDVR see the function of diversification as the reduction of luck in portfolio outcomes. (( So do I ))
- To investigate this they look at some unlucky outcomes, specifically the 10th and 25% percentile outcomes:
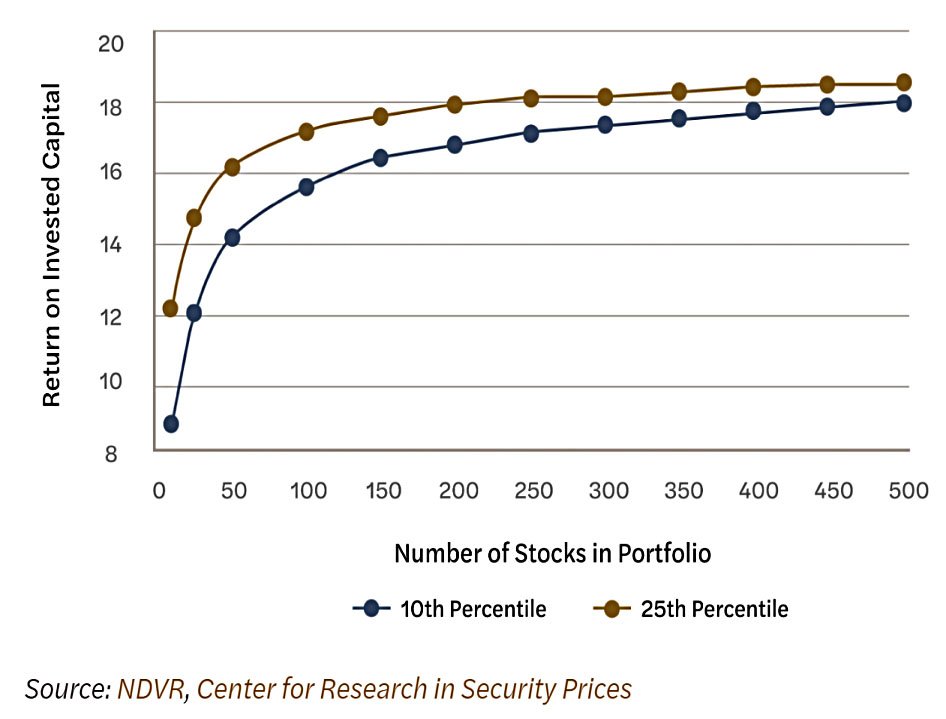
Since the period in question was great for stocks, even the “unlucky” investors did well – with n=500, they returned 18 times their original investment.
- Unlucky investors with only 10 stocks still returned 9 times their investment.
The more important point is that the curve remains steep until you reach around 250 stocks.
There is still a lot of room for improvement at 20-30 stocks. While on average these portfolios have delivered 19x ROIC over 25 years, an investor with just 25 stocks had a 1-in-10 chance of receiving less than a 12x ROIC. This represents forfeiting 36% of their expected end wealth!
The 1-in10 hit for a portfolio of 250 stocks was only 10%. More importantly:
The unlucky 250-stock investor ended up with about 40% greater end wealth than the unlucky 25-stock investor.
Yet most would argue that these two portfolios have “similar” risk profiles.
Reasons
There are three reasons why people get this wrong.
The first is misinterpreting the original portfolio volatility chart:
If individual stocks have 45% of idiosyncratic volatility, then a portfolio of 25 stocks has 9% of idiosyncratic volatility. That’s still a ton of stock-specific risk. Aggregate 9% annualized idiosyncratic volatility over 25 years and you’re right back to having 45% of total accumulated idiosyncratic volatility.
A long-term investor needs to hold more stocks than a one-period analysis would suggest.
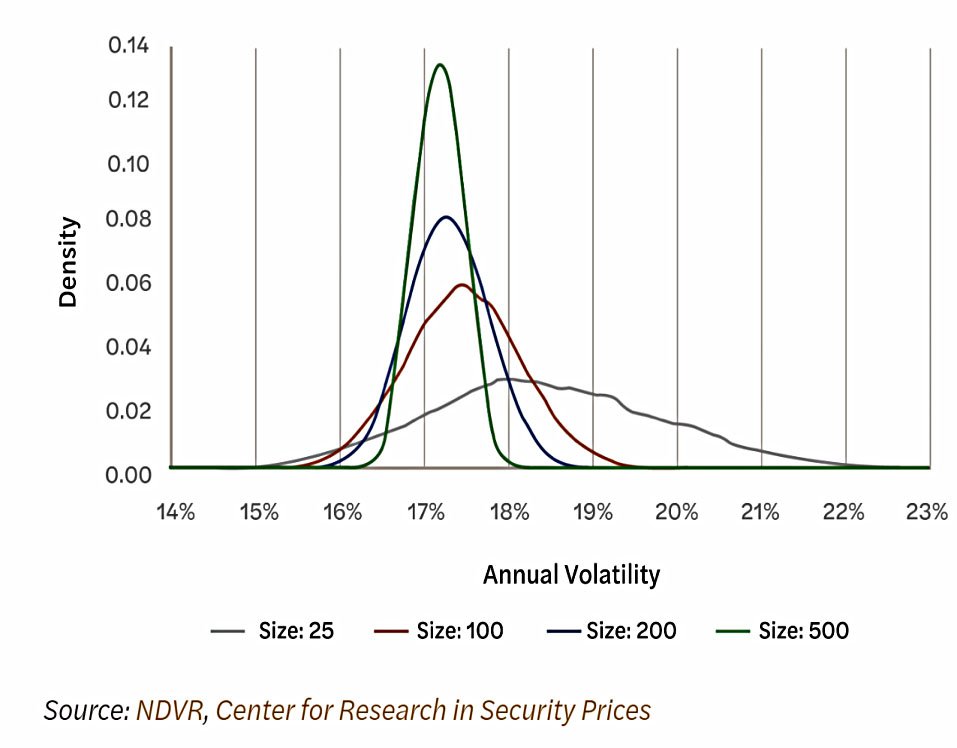
The second reason is that the chart plots average volatility rather than its distribution.
- The average volatilities (the peaks of the curves) converge as portfolio size increases.
But smaller portfolios have much fatter right tails (high volatility outcomes) to their distributions.
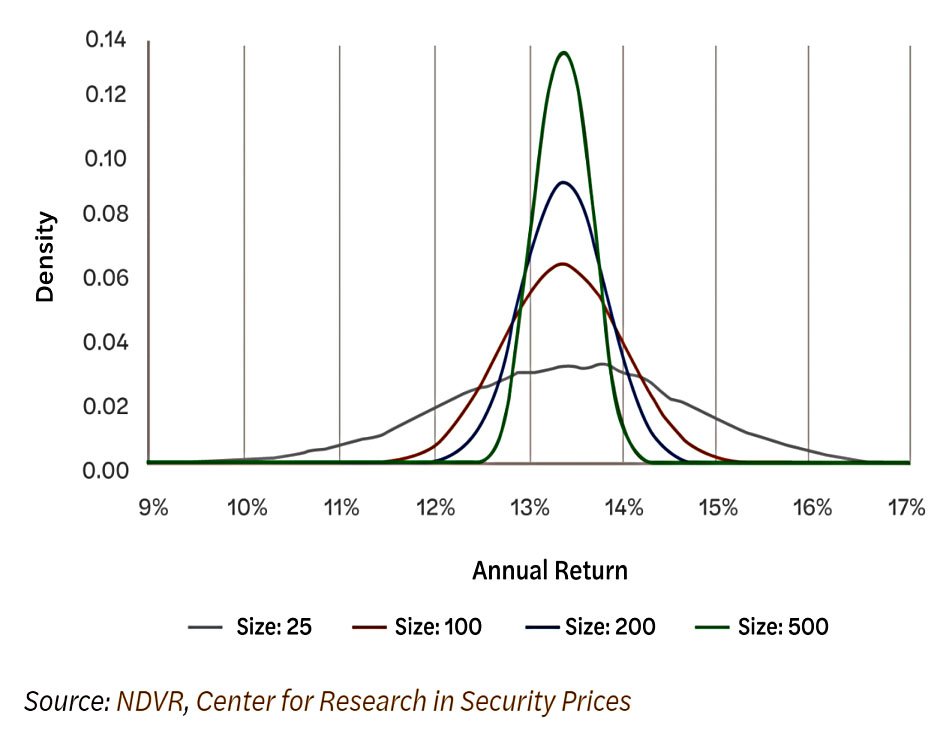
The third reason is that the original chart ignores returns.
- All the portfolios have the same average returns, but again, the smaller portfolios have fatter tails, so have more chance of lower (and/or higher) returns.
If the expected returns themselves differ so much among the portfolios, the final wealth of long-term investors will diverge even further due to compounding.
Conclusions
From my personal experience, many investors prefer concentrated portfolios because they believe that their stock picks will outperform, and they don’t want to dilute this alpha.
- That’s not a bet I want to take, other than at the margins (in satellite portfolios).
The conclusion from the paper is that more stocks are better, up to whatever practical limit you hit (usually portfolio size divided by optimum trade size).
- But that’s only the case if your target is the market return.
Until next time.
Mike Rawson
Mike is the owner of 7 Circles, and a private investor living in London. He has been managing his own money for 40 years, with some success.