The Risk Parity Gorilla

Today’s post looks at an article by Mike Rulle of MSR Indices called The RIsk Parity Gorilla.
Contents
The Risk Parity Gorilla
I came across Mike via the Risk Parity Radio podcast, which I highly recommend.
- He works at MSR Indices who create Risk Parity Indices in partnership with S&P Dow Jones.
The name of the paper comes from the famous psychological experiment where subjects are shown a film of a basketball game and asked to count passes.
- Almost nobody notices a man in a gorilla suit walking through the match, because they are concentrating on something else.
I saw the film in a psychology MOOC around a decade ago, but Mike was lucky enough to see it at a talk given by Maths Professor and billionaire founder of Renaissance Technologies, Jim Simons.
- You can find the film on YouTube, but now that you know, you will of course spot the gorilla.
Mike’s point is that the 50/50 stock-bond portfolio (a more conservative spin on the industry favourite 60/40 portfolio) can be seen as the man in the gorilla suit.
- He describes the 50/50 as the two-asset class risk parity portfolio, but this needs some explanation.
The sweet spot on the stock-bond curve is closer to 40/60 – 37/63 if I remember correctly (in favour of bonds).
- And because such a portfolio would naturally have lower returns along with its optimum risk/return profile, you would also need to use leverage to juice your returns back up to your target level.
Also, real RP portfolios include more than two assets (such as gold and commodities, amongst others).
The Tangency Portfolio
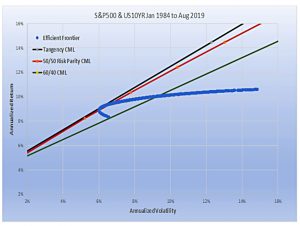
As Mike points out, the 50/50 portfolio is closer to the hypothetical “market portfolio” than is the 60/40 (( The 40/60 cash-weighted portfolio would be a closer proxy than 50/50 cash, but Mike is using RP weightings )) and has also outperformed it over the last century.
- Mike is actually proposing RP weightings rather than cash weightings, but this isn’t made clear at the start of the paper.
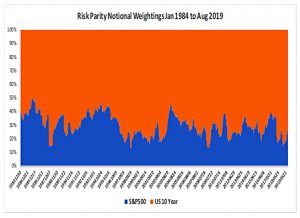
The 50/50 RP equates to 35/65 cash over the last 50 years.
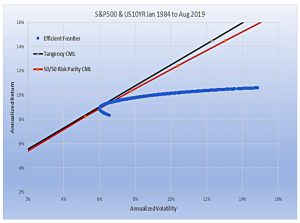
It [50/50 RP] provides a return that is much closer to MPT’s Tangency Portfolio – a portfolio that MPT [Modern Portfolio Theory] tells us cannot be beaten in the long-run.
The next chart shows the cash weightings of the 50/50 RP portfolio, from 1984 to 2019:
Volatility skew
Mike use volatility to explain why RP works:
There is a negative correlation between realized volatility in Equity markets and Equity returns. The highest quartile volatility has an expected monthly loss of 70 basis points versus a 1.7% gain in the lowest volatility quartile.
This benefits Risk Parity as it adjusts weightings according to contemporaneous measures of volatility. It weights Equity less when returns are expected to be lower, and weights Equity more when returns are expected to be higher.
Pension funds
US pension funds average a 70/30 stock-bond split, but they also use around 30% of alternative assets (this allocation has trended up from 10% in 2006).
- Which would work out to 50/20/30 across stock-bonds-alternatives.
Is interesting to note that back in the 1950s, pensions were almost 100% bonds, and even in the 1980s they were at 80% bonds.
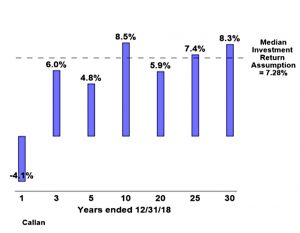
Yet pension fund returns have been close to the stylised 60/40 returns over all time frames.
Pension Fund investors, who seek to improve returns, are inadvertently framing their perception to find better returns in non-diversifying alternatives.
They have been seeking to outperform by investing in relatively illiquid and opaque investments by replacing fixed income during one of the best fixed income periods in history and by moving away from the portfolio weighting which has the highest expected Sharpe ratio.
They have moved consistently into private equities and other alternatives, which underneath it all, are correlated primarily to equities but with higher fee structures.
Performance
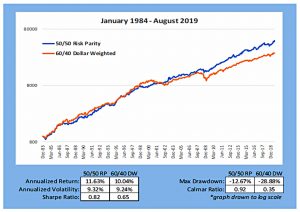
The last section of Mike’s paper compares the performance of the 60/40, the 50/50 RP and the Tangency portfolio over the previous 36 years.
As expected, 50/50 RP beats 60/40.
The highest possible Sharpe ratio portfolio (the non-investable Tangency Portfolio), is very close to the Sharpe ratio and notional weighting of the Risk Parity portfolio.
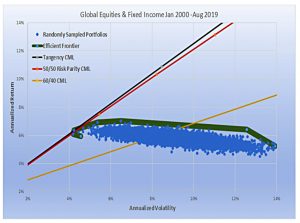
The final chart uses more realistic data (which only goes back 20 years) and adds 50,000 randomly sampled portfolios to construct an efficient frontier.
- They don’t come close to the 50/50 RP portfolio, and the gap to the 60/40 portfolio is even bigger.
The important thing to recognize is how close RP was to the Tangency Portfolio and not how much it outperformed 60/40. One method (the ex-post Tangency Portfolio) simply curve fits the best result when all information is known. The other method uses a walk forward risk weighting approach.
This seemingly non-intuitive relationship really is the expected outcome.
Benchmarks
Mike wants the 50/50 RP to be adopted as a benchmark:
There is no basis at all for using 60/40 or the S&P 500 for a benchmark as these have little to do with Capital Market weightings, and do not incorporate any coherent framework regarding portfolio theory.
50/50 Risk Parity comes closest to tracking the Tangency Portfolio over the long run and is therefore ideal as a Benchmark. Institutional investors should be judged by how they perform relative to a Risk Parity portfolio.
I tend to agree, but even after 30 years, RP remains a niche topic outside the quant investing world.
As long as Sharpe ratios for equities and fixed income remain similar to each other
(as they have for at least the last 100 years), Risk Parity will always be the optimal way to allocate between the two asset classes. We hope to persuade investors to focus on this approach before digging deeper into more opaque approaches to improve performance.
Conclusions
Unfortunately, this article doesn’t quite live up to its memorable title.
- It’s quite a difficult read and doesn’t add much to the papers from Ray Dalio on the same topic – through the call for benchmarking is interesting.
But it’s always good to have another person’s perspective.
- If you are still wavering on RP after reading Ray’s content, give Mike’s a whirl.
Until next time.


