Irregular Roundup, 31st July 2023

We begin today’s Weekly Roundup with Bitcoin.
Bitcoin

John Authers (and Isabelle Lee) looked at Bitcoin’s rally in 2023.
- It’s up 90% after crashing 64% in 2022.
That’s more than double the Nasdaq, which is up 42%.
- The recent optimism is related to filings for various spot-Bitcoin ETFs, including one from BlackRock.
BlackRock has a near-pristine record of filing for and receiving approval for all manner of ETFs. It’s filed for roughly 550 funds and been rejected for just one.

More interestingly for those of us who hoped that crypto might become a new diversifying asset class along the lines of gold, the correlation between Bitcoin and Nasdaq has fallen to pre-pandemic levels.

The correlation flipped negative in June when Bitcoin stalled and the Nasdaq kept on rising.
- Despite the ETF enthusiasm, BTC has been range-bound.

In previous low-correlation episodes, BTC has outperformed, but now the hype is around the potential of AI.
The real test will come if/when tech crashes again.
- Will the low correlations hold, or will BTC come crashing down, too?
Nasdaq

John and Isabelle also looked at the consequences of the Nasdaq rally, which is an index rebalance.
Megacap tech shares have powered six fantastic months for the stock market, fueled in large part by the frenzy over artificial intelligence. The advance in the S&P 500 has been
more concentrated among its largest stocks than in any six-month time frame since the turn of the millennium.
It’s actually the best-ever first half to a year for the Nasdaq, better even than the dot com boom of the late 1990s.
- The boom has led to greater concentration.
Six of the index’s largest members alone now comprise more than 50%. Tracking the Nasdaq-100 now unavoidably means placing a big bet on a handful of giant tech names.

So these six (Microsoft, Apple, Alphabet, Nvidia, Amazon and Tesla) will be capped in the index.
- Meta didn’t make the cut.
The trigger for the rebalance appears to be the total contribution from those firms which individually exceed 4.5% of the index exceeding 48%.
- The big six have hit 51%, and according to Nasdaq methodology papers, their weight now needs to be cut to 40%.
- The contribution from the remaining 94 stocks will obviously increase correspondingly.
The last famous rebalance was the capping of Apple (from 20% to 12%) in 2011.
- Prior to that, the index shifted from market cap to adjusted in 1998, in order to qualify under ETF regulations.
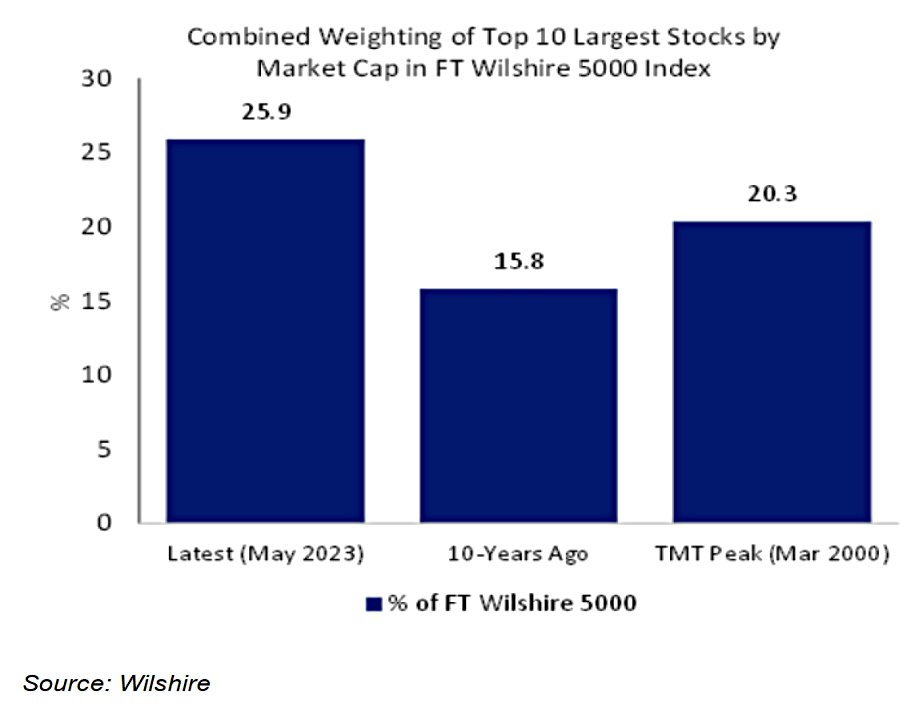
Even pulling back to the Wilshire 5000 – the broadest US index – shows that the domination of the top 10 firms is now even greater than during the dot com bubble.
John also discusses the problems this illuminates with index investing:
As money flows into indexed funds, more will go to companies that are already overvalued. That eventually leads to accepting the market’s judgment that a few big companies deserve to be big, and making them even bigger.
This makes fundamental indexing (weighting on anything other than the market cap) more attractive.
There’s also the issue that the Nasdaq index rebalancing will itself move markets.
The QQQ [index ETF] fund itself will have to sell stocks of the Big Six and buy a lot of others, inevitably shaking up prices. And this will also affect those who were just benchmarked against the Nasdaq-100.
After the short-term issues, we should end up with a better index.
- For a while at least, until some other constituents blow up.
Gold
Buttonwood looked at why gold hasn’t behaved as most people would have expected.
A fear-and-inflation hedge has failed to hedge against fear or inflation.
If you had seen inflation coming in 2021, driven by money printing and war in Europe, you might have bought gold.
- But the price is only up by 3% in two and a half years.
It’s hard to price gold:
- It used to be the asset backing money, but now it has only jewellery and limited industrial uses
- It’s physically durable and easy to transport (and hide) and has a limited supply
- But it has no cash flows (income)
Buttonwood focuses on the last point – no income means an inverse correlation to real interest rates.
- When you can make a high income on T-bonds, gold should be less attractive.
The 10-year Treasury real yield has coped well with rising inflation, moving from -0.25% at the start of 2021 to 1.4% now.
Research from the Chicago Fed backs interest rates as the key driver.
- The impact of inflation sometimes dominates the gold price during high inflation periods, but there are not so many of these.
The metal will increase in price in inflationary periods if central banks are asleep at the wheel, and real rates fall, or if investors lose their faith in the ability of policymakers to get it back under control. So far neither has happened during this inflationary cycle.
Good Investors

Maynard Paton asked a good question in his half-year review of his portfolio: Are You A Good Investor?
- Maynard has had a mediocre first half, up 1.3% against 3.2% for his FTSE-100 benchmark (I wasn’t much better myself, up 2% against 2.7% for my own benchmark).
He also lost 23% in 2022 (I was down 6.3%) so he has some ground to make up before any new high.

He’s still ahead of the index since he started his blog back in 2015, though.
- He’s up 68% compared to 60% for the index.
But does that make him a good investor?
Maynard’s use of the FTSE-100 as a benchmark dates back to his time writing for a stock tipsheet.
The FTSE 100 was chosen because it was main UK index and would therefore prevent regulatory trouble whenever I trumpeted my tips had ‘trounced the market’.
But is it still a good idea when his portfolio is mostly full of small caps? He has three reasons:
- I can’t shake off years of share-tipping FTSE 100 comparisons;
- I really ought to beat the ‘dinosaur’ FTSE 100, and;
- I’d probably invest in the FTSE 100 if I were to give up stock picking.
The last reason is key, though Maynard admits that he wouldn’t invest entirely in the FTSE-100 (and I doubt he would have more than 20% in UK stocks.
As well as the FTSE, real-life hands-off alternatives to individual shares may include a global tracker, a favoured sector ETF, a reliable fund, something like the Vanguard 60:40, or plain cash in the bank.
That’s why I use my own benchmark, made from UK stocks, international stocks, UK property and cash.
- It’s designed to reflect what a passive (or “lazy”, if you prefer) UK person might typically do with their money.
That way I can see whether the deviations I have chosen from that neutral path have added any value.
- It’s also worth noting that the benchmark doesn’t pay taxes and has no fees to fund, so even getting close to it is an achievement.

Maynard notes that comparison is the thief of joy:
A frustratingly simple alternative will always be doing better than your portfolio.
While the FTSE 100 has been hard to beat during the last 18 months, ‘US tech/quality growth’ was leading the charge for the previous decade or so. How many times have you asked yourself why you did not put all of your money in Fundsmith or the Nasdaq?
But this is cherry-picking – nobody is trying to be the best investor out there (over whatever time frame you have chosen).
- And very few people stay on top all the time.

The fund managers running the likes of Castlefield Buffettology, Scottish Mortgage and Finsbury Growth & Income were all once touted as ‘good investors’ … but the last five years have seen their performances converge with the FTSE 100.
Survivorship bias is the issue:
We only hear about market winners. We always compare ourselves to who and what has succeeded in the past, and easily forget who and what has sunk without trace.
Good investors prove themselves through both bull markets and bear markets. A 20-year record at 5% per annum may not sound great, but to me it signals a better result than five years at 20%.
It’s important to remember this when economic regimes are changing.
- What worked under low inflation when interest rates were falling might not do so well when interest rates and inflation are higher.
UK inflation
UK inflation for June fell by more than expected, with CPI down to 7.9% from 8.7% in May, against forecasts from economists of 8.2%.
- CPI-H was down to 7.3% (from 7.9%).
This is the lowest CPI figure for more than a year and ends a round of four months of the actual numbers beating expectations.
- It also matched the Bank of England’s own forecast.
The biggest downward contribution came from petrol prices, but the rate of increase in food prices also slowed.
- There were no large upward contributions.
Core CPIH (excluding energy, food, alcohol and tobacco) was a bit stickier – it rose by 6.4%, down from 6.5% in May.
- Core CPI rose by 6.9%, down from 7.1% in May (the highest level for 30 years).
Services inflation fell to 7.2% from a 31-year high in May of 7.4%.
UK inflation is still the highest amongst the G7 group of advanced economies, and it remains to be seen how many more interest rate rises the Bank of England will decide are required to get inflation closer to the 2% target.
- But perhaps the June figures are a turning point.
Quick Links
I have just one for you this week:
- The Economist said that Investors are seized by optimism. Can the bull market last?
Until next time.
Mike Rawson
Mike is the owner of 7 Circles, and a private investor living in London. He has been managing his own money for 40 years, with some success.