Risk and Time

Today’s post looks at an old blog post from John Norstad on the subject of risk and time.
Contents
Risk and Time
I came across this article when I was researching the use of leverage in portfolios.
- I think it was a detour away from the HFEA series of posts into the Lifecycle Investing strategy (which also uses leverage).
Anyway, I couldn’t find out too much about its author, John Norstad.
- He seems to have been an old-school techie who was responsible for the first anti-virus software on the Apple Mac.
He also maintained a “Finance Page” of articles on a variety of topics that interested him.
- His page is gone now, and I found this article on archive.is
The version I’m looking at was scraped in July 2014, but the article is dated December 22, 2012 (and the original version of the post dates back to April 2000).
The article was written after a dispute on the Vanguard Diehards forum on the Morningstar website: (( It appears at the time of writing that the forum still exists ))
I questioned the popular opinion that the risk of investing in volatile assets like stocks decreases as one’s time horizon increases. Taylor Larimore asked me to explain. Hence this note.
John offers four arguments against the popular opinion and one in favour.
Before reading the paper, my own opinion is that it might come down to how we define the term “risk”.
- I think that the chances of my regretting an investment in stocks are lower in the long run than in the short run, though starting valuations do of course matter.
It’s this potential for regret that I’m interested in, not some arbitrary probability of a future event.
- But there are other ways to look at risk and I’m sure that some of them do not decrease with time.
Time Diversification
If there is one thing I would like people to learn from this paper, it is to disabuse them of the popular notion that stock investing over long periods of time is safe because good and bad returns will somehow “even out over time.”
Which leads to the oft-stated advice:
At your young age, you have enough time to recover from any dips in the market, so you can safely ignore bonds and go with an all stock retirement portfolio.”
This is a form of mean reversion and is usually expressed as a decline in the standard deviation of annual returns as time increases.
I most frequently see this illustrated as a bar chart displaying a decreasing range of historical minimum to maximum annualized returns over increasing time periods.
The issue is that most investors will be concerned with the terminal value of their portfolio, and the standard deviation of this will increase with time (because of compounding and the snowball effect).
The standard deviation of the total continuously compounded returns increases in proportion to the square root of the time horizon. Thus, for example, a 16-year investment is 4 times as uncertain as a 1-year investment.
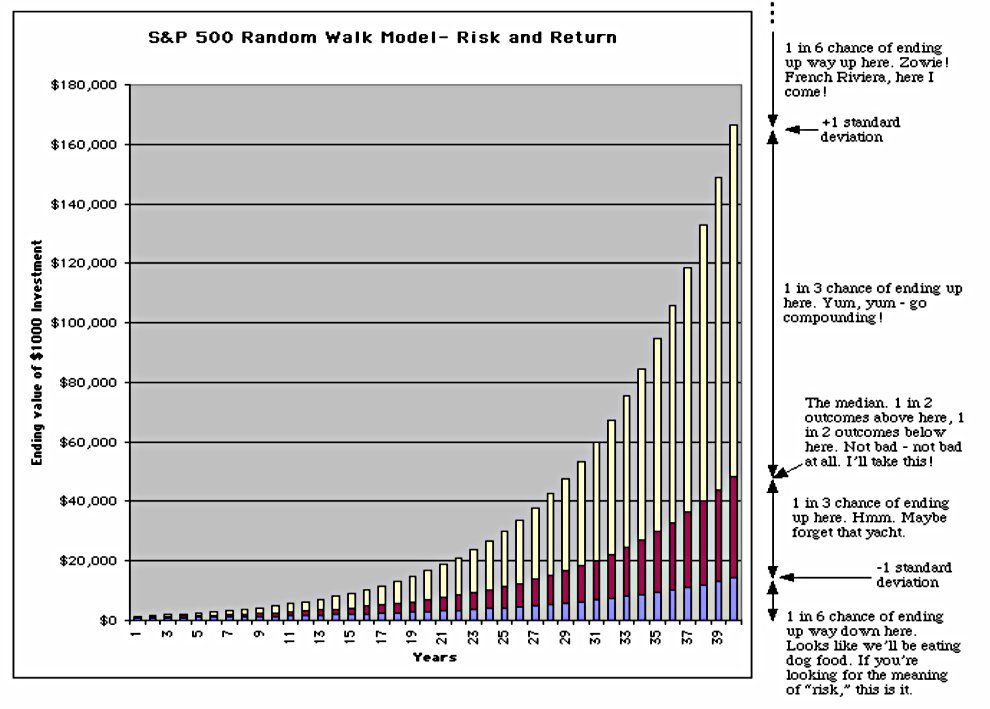
John plots his own chart of long-term S&P returns, using data from 1926 through 1994.
At 40 years, the chart gives only a 2 in 3 chance that the ending value will be somewhere between $14,000 and $166,000. This is an enormous range of possible outcomes.
The uncertainty of the final value increases over time, but the real comparison is with not investing in stocks.
- What is the likelihood that you would have done better to hold cash for 50 years? (( I chose 50 years as the typical investing lifetime, from 25 to 75, when it is probably safe to start running down your pot ))
If instead of investing our $1000 in the S&P 500, we put it in a bank earning 6% interest, after 40 years we’d have $10,286. This is 1.26 standard deviations below the median ending value of the S&P 500 investment.
The probability of ending up below this point is 10%. In other words, even over a very long 40 year time horizon, we still have about a 1 in 10 chance of ending up with less money than if we had put it in the bank!
For a globally diversified multi-asset portfolio, the probabilities would come down significantly, I would argue.
- It may be frustrating to have only 10 times your original cash rather than the 50 times that some luckier fellow has, but it doesn’t mean that your investment was too risky.
Utility Theory
Most investors are “risk-averse.” [They] would refuse to play a “fair game” where [They have] an equal chance of losing or winning the same amount of money, for an expected return of 0%.
In other words, we demand a premium (return) in order to take on risk.
- This will be higher than the risk-free return (usually that on government bonds, or for retail investors perhaps an instant-access savings account).
In general, investors demand higher risk premiums for more volatile investments.
A utility function maps an investor’s willingness to take on various levels of risk for various returns.
- Iso-elastic utility functions describe investors who wouldn’t change their attitude to risk as their wealth changes.
If they hold a 50/50 stock bond portfolio when they have $10K, they will have the same allocation when they are worth $100K (or $10 M).
- This constant relative risk aversion is usually defined over a given time period (say 1 year).
Although this attitude seems unlikely to me (I would expect risk aversion to increase with wealth, as the absolute changes in wealth increase in size), it is often used as a “neutral benchmark” for comparison with other utility curves.
- John notes that my own curve makes me a conservative investor with “increasing relative risk aversion.”
A different equally reasonable investor might have the opposite attitude. She is more aggressive when she is rich, perhaps because she feels that she already has more than enough money, so she can afford to take on more risk with the excess.
Which seems fair – I just haven’t reached that level of wealth.
- So really I have increasing aversion up to some unknown point, then perhaps decreasing risk aversion.
Coming back to the point of the paper, if time reduces risk, then utility curves for longer periods should be more aggressive.
This is not at all what happens. For iso-elastic utility functions, relative attitudes towards risk are also necessarily independent of time horizon.
If a 50/50 stock/bond asset allocation is optimal for a 1 year time horizon for an investor with iso- elastic utility, it is also optimal for a 20 year time horizon and all other time horizons!
This assumes a random walk model of stock prices.
If a rational investor’s relative attitudes towards risk are independent of wealth, they are also necessarily independent of time horizon.
This is all very well for this hypothetical rational investor, but my attitude to risk is not independent of wealth and nor is it of time.
- I would not put money that I need in a year or two into the stock market, yet I might allocate 50% or more of the money I can put away for 20+ years to stocks.
So while John has demonstrated that time will not reduce risk for all possible investors, it does for me.
Probability of Shortfall
As the time horizon increases, the probability of losing money in a risky investment decreases.
This assumes this risky investment has a higher return than the risk-free rate and includes earning less than the risk-free rate as a loss.
- It works for actual historical market returns as well as the random walk model.
The problem with this argument is that it treats all shortfalls equally.
It also treats all gains equally.
Consider two investments A and B which both cost $1000. With A, there’s a 50% chance of making $500 and a 50% chance of losing $1. With B, there’s a 50% chance of making $1 and a 50% chance of losing $500. A and B have exactly the same probability of loss: 50%. Therefore A and B have exactly the same “risk.”
We need to take account of the impact of the loss, and of the investor’s wealth.
The probability of shortfall measure is much too oversimplified to be a reliable measure of the “risk” of an investment.
A more realistic example is investing in the S&P 500:
The probability of losing money in the S&P 500 random walk model is 31% over 1 year but drops to 19% after 3 years. [But] the probability of losing 20% or more of our money in the S&P 500 is 5.0% after 1 year. The probability is 6.4% after 3 years.
The worse the outcome, the more its odds incerase with time:
Losing 30% or more of our money is 2.8 times more likely after 3 years than it is after 1 year. Losing 40% or more of our money is 9.7 times more likely after 3 years than it is after 1 year. Losing 50% or more of our money is a whopping 71 times more likely after 3 years than it is after 1 year!
It should be noted that the absolute probabilities of these larger declines are falling, just more quickly for the 1-year term.
- 1930-1932 is the outlier here, but John sees no reason why this couldn’t happen again.
The Fed’s response to crises since 2007 suggests otherwise to me.
- John also mentions the 1968 to 1982 period, which looks more relevant.
And he cites the total collapse of the German markets between the wars, and Japan since 1991.
If we’re going to take this notion of “risk” seriously, don’t we have to deal with these possibilities, even if they have low probabilities? While we cannot let these disastrous possible outcomes dominate our decision making, we also cannot dismiss them just because they’re unlikely and they frighten us.
Getting back to utility theory:
Gains and losses of equal magnitude do not just cancel out. A loss of $x is more of a “bad thing” than a gain of $x is a “good thing.” This is called “decreasing marginal utility of wealth,” and it’s equivalent to the notion of “risk aversion.”
Large losses with tiny probabilities can have large weightings.
For iso-elastic utility functions with constant relative risk aversion, risk is independent of time, in the sense that the optimal asset allocation is the same at all time horizons. For other kinds of utility functions, risk may increase or decrease with time horizon, depending on the investor.
Which matches our real-world experience.
Option Pricing
In the next section, John imagines a zero-coupon US Treasury bond, where all our gains come at maturity.
- The risk of a stock investment can be considered as the possibility of not making as much money as this bond.
It then makes sense to measure the magnitude of the risk as being the cost of an insurance policy against a possible shortfall.
This is a European-style put option on the stock portfolio. (( European options can only be exercised at maturity ))
- Put options are often used in this way as portfolio insurance.
We can price this insurance using the Black-Scholes model, and the cost will increase with the time to expiry.
- That’s because the longer the volatility of the stocks has to operate (in a negative fashion) the greater the chance it will do so.
This feels like an alternative way of expressing the shortfall argument to me.
- The maths that the chances of a shortfall increase with time are fine, but there are so many other positive potential scenarios that investing in the risky asset still makes sense.
Human Capital
We now come to John’s only argument in favour of the idea that young people should have more aggressive portfolios.
- “Human capital” is defined here as the money you will earn in the rest of your working life, discounted to present value. (( Good luck choosing the appropriate discount rate ))
The basic argument is that retired people who obtain living expenses from the earnings of their investment portfolios cannot afford as much risk as younger people with long working lives ahead of them.
Real life is slightly more complicated, as retirees have state and DB pensions to rely on as well as dividends.
- These are more similar to the regular paychecks of young people
John also raises complications like workers who have stock in their employer, or who work in the finance industry.
These people have a higher-than-average correlation between their human capital and their portfolios and should be more conservative than a human capital analysis would suggest.
This is the section that touches on the LifeCycle investing approach, and John doesn’t attempt a mathematical model.
- We’ll look at LifeCycle Investing in more detail in a future post.
Conclusions
My intuition that the answer would depend on how we define risk was accurate.
John has demonstrated that for some investors under some definitions of risk, stock risk does increase with time in the market.
- But that doesn’t mean that a 50% allocation to stocks isn’t a good idea for everyone with a long-term investment horizon.
And for my own part, I will be sticking with stocks.
- Until next time.
Mike Rawson
Mike is the owner of 7 Circles, and a private investor living in London. He has been managing his own money for 40 years, with some success.