Peak Passive – Man

Today’s post looks at a couple of papers (written more than five years apart) from the Man group on the rise of passive investments.
Contents
Authers
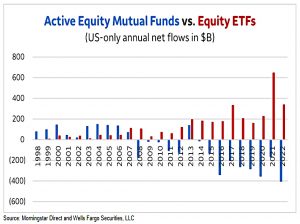
The papers were brought to my attention by John Authers, who noted the flow of funds from active to passive in the US.
- The reasoning is obvious – passive funds are cheaper and outperform in aggregate.
The low costs are both explicit (management fees) and implicit (transaction costs).
But:
Logic dictates that not all assets could be run passively. The market would stop functioning and cease to have any use in pricing and allocating capital. The opportunity would be there for hyperactive managers to leap in and exploit all the anomalies that passive funds had produced.
We don’t know the point at which the amount of passive makes the market inefficient.
- But Man thinks that point is now near.
2017
Before we get to the recent paper, let’s look at what Man thought back in 2017, when they released a paper called “Active vs. Smart Beta vs. Passive”.
- From the Man website, it looks as though Daniel Taylor is the author of both papers, but it could be that they were both released under the Man Numeric label, and Daniel is the current CIO of that group. (( I’ll assume for the rest of the article that Daniel is the author of both pieces ))
The original paper looked to answer four questions:
- How much of the shift [from active to passive] has occurred? How much may be left?
- What is the source of passive flows?
- How can publicly available data be used to analyze individual managers?
- How should society think about the appropriate balance between active and passive approaches?
The paper tries to answer these questions by looking at 13F filings from US equity managers.
There are lots of issues around what constitutes active rather than passive.
- They centre around the question of where smart beta (essentially, tracking an index designed to access an outperformance factor) sits.
Smart beta strategies are active in that they deviate from market capitalization weighted indices by design. But many are implemented in a passive fashion, following relatively static rules for portfolio inclusion, weighting, and rebalancing.
Man uses active share – the proportion of a portfolio’s holdings that differ from the benchmark – as their measure.
- Fully passive will score close to zero, but to score 100% an active fund would need to hold no components from the benchmark.
Using the 13F data, Man makes the simplifying assumption that all US managers are benchmarked to the Russell 1000 and Russell 2000 indices.
It allows us to get ‘full’ coverage of the US equity universe [and] it simplifies the analysis in a world where many managers may be more value or growth tilted.
There was (in 2017) a tendency for the largest holders of stocks in each of the indices to be fairly passive.
The next step is to look at these numbers through time.
- Man approached this at the manager level, classifying those with less than 20% active share as passive managers.
There has been a clear and substantial shift towards indexing, with passive investing in large caps roughly tripling (from 8% to 24%) and in small caps rising even further (from 4% to 25%).
As of 2017, the trend appeared to be accelerating, particularly in small caps.
Man makes the point that 50% to 70% passive might be the end game, and in 2017 we were not close to that.
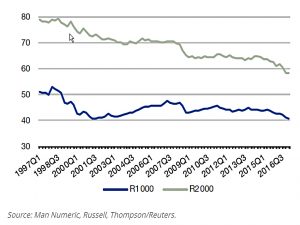
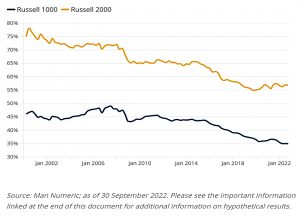
The chart above switches to aggregating the active share from each manager (rather than classifying each manager as active or not).
- The active share of the Russell 1000 is now just 40% (rather than the 75% implied by the first chart).
How much of this is down to “closet trackers” is not calculated.
That’s it for the 2017 paper.
- I got the impression that Man wasn’t thrilled by the trend to passive, calling it a “contemporaneous risk to active performance” that “increases the odds and risks of crowding and bubbles within passive strategies.”
2023
The new paper is called “US Equities: Approaching Peak Passive and the Implications for Active”.
- It’s clear from the title that Man has changed their view on how far we have travelled.
The new paper also asks four questions:
- Why does passive investing “work”? And how passive is the market today?
- What has changed such that active investing may recover?
- What are the broader implications for global equity investing?
- Where is the equilibrium between active and passive strategies?
Their analysis remains confined to the US, as data for the rest of the world is hard to find.
How passive is the market?
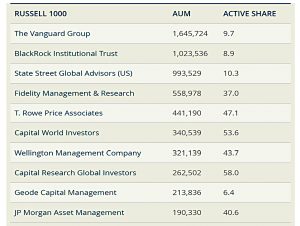
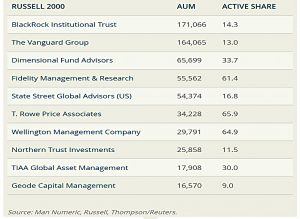
The chart below shows the 13F filings of the largest managers of Russell 1000 stocks:
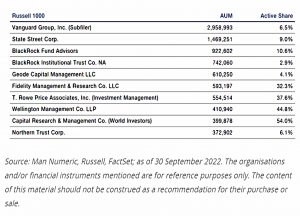
Only four of the top nine (if we aggregate BlackRock) are “active” managers. Three of those have a lower active share today than they did in 2017.
The chart below shows the rising share of passive (where a manager is classified as passive if their active share is below 20%):
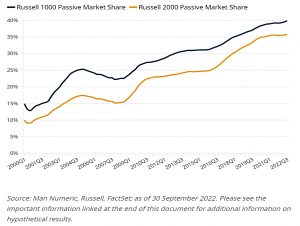
Passive is now at 40% for the Russell 1000.
- The chart below adds Man’s estimate of retail ownership, which reduces passive institutional ownership to 30%.
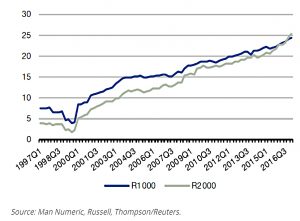
The next chart shows estimates of bottom-up asset-weighted active share (( Where managers are not classified simply as active or passive )) across time.
- Active share in the Russel 1000 has fallen from 50% to 35%, with a significant drop over the past five years.
On this basis – which attempts to capture the impact of the many closet-trackers in the active space, the US market is already two-thirds passive.
Can active investing recover?
Passive fees are now close to zero, and while active fees have fallen, there isn’t a good source for active institutional prices.
Let us suppose, for the sake of discussion, that 20 years ago active management fees for US equities were 0.5% to 1%, and today are closer to 0.2% to 0.4%.
So the gap to passive has closed a bit, eroding one of passive’s key advantages.
Transaction costs are driven by turnover, and while passive strategies might have an annual turnover of 10%, active strategies could turnover 50% or 100%.
- Higher fees in, say, small caps and emerging markets could exacerbate this difference.
But liquidity is improving in general, so this advantage has probably also eroded slightly.
Next up is fund flows.
Morningstar estimates that in 2021, active US equity mutual funds had net outflows of $195 billion, while passive funds had net inflows of $346 billion.5 This would indicate that on a typical day, there was a net flow advantage of $2 billion for passive funds.
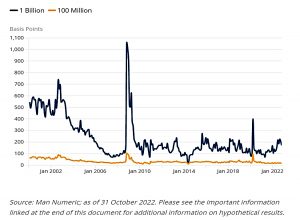
These flows will have a price impact, and that will favour passive.
Over the past decade the rough range of estimated impact has been 15 to 20 bps and 100 to 200 bps for $100 million and $1 billion, respectively. If we assume the impact is on the lower end (at 15 bps), and that 90% of it reverts, that still implies 1.5 bps per day of (semi) permanent impact – which equates to ~370 bps per year.
Man does not expect this tailwind to continue. One reason is cyclicality:
Good performance tends to lead to positive flows, which can then lead to too many assets in a particular strategy, which can then lead to underperformance.
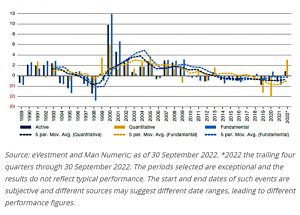
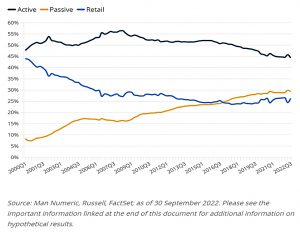
The chart above shows active manager returns, with a split between fundamentally-driven and quantitatively-driven groups.
It does appear there is some cyclicality in active performance, as the periods from 1990 to 1993 and 2000 to 2008 appear quite productive for active managers, while the periods from 1994 to 1999 and 2010 to 2021 are more challenging.
We can also see that 2019 and 2020 were extraordinarily challenging for quantitative managers. The annual autocorrelation of active manager performance is 40% over this period.
Man thinks that conditions may now be better for active managers.
Global equity investing
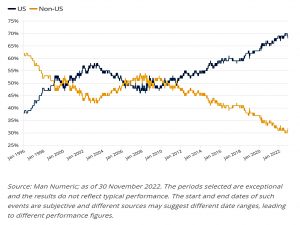
The last 15 years have been great for US stocks, which now make up 70% of the World index.
- This has overlapped – perhaps not coincidentally – with the move to passive and with increased concentration in the US market.
Man thinks it’s time for a change:
We believe a regional framework might afford allocators a much greater sense of diversification than global equity indices now provide.
I’ve never used a global top-down approach, and as Man points out, this has been painful in recent years – but perhaps it won’t be looking forward.
Conclusions
Man offers three reasons to revisit active investment strategies:
- The cost gap (fees and transaction costs) has shrunk
- The tailwind to passive from fund flows may be about to end (assuming we are close to a passive/active equilibrium)
- Active performance is cyclical and active is due a good spell
- The end of QE and falling interest rates might contribute to this
Man are obviously interested in promoting active investing since that is what they offer, but the arguments make sense.
I always have a significant allocation to active (30/70 with passive at the time of writing), but my definition of active is quite broad, including factor funds and strategies like trend following.
- My goal is to lower the volatility from my passive allocation without too much impact on returns.
Perhaps this is a good time to add a little more stock-picking back into the mix.
- Until next time.
Mike Rawson
Mike is the owner of 7 Circles, and a private investor living in London. He has been managing his own money for 40 years, with some success.