The Death of Duration

Today’s post looks at a paper from Calderwood Capital called The Death of Duration.
Contents
Dylan Grice

Dylan previously worked at Dresdner Kleinwort Benson before moving to SG’s global strategy team, where people like Albert Edwards and James Montier have worked/still do work.
Calderwood’s papers are usually behind a paywall, but Dylan was on Meb Faber’s podcast and released a few that were relevant to their discussion.
The Death of Duration
This paper dates back to November 2019, just before the Covid pandemic, and begins with a look at a Golden Age for duration assets.
[Since 1980], US equities returned an annualised 12% return compared to 8% in the hundred years before that, while government bonds returned 8.3% since 1980 versus 3.5% in the previous century.
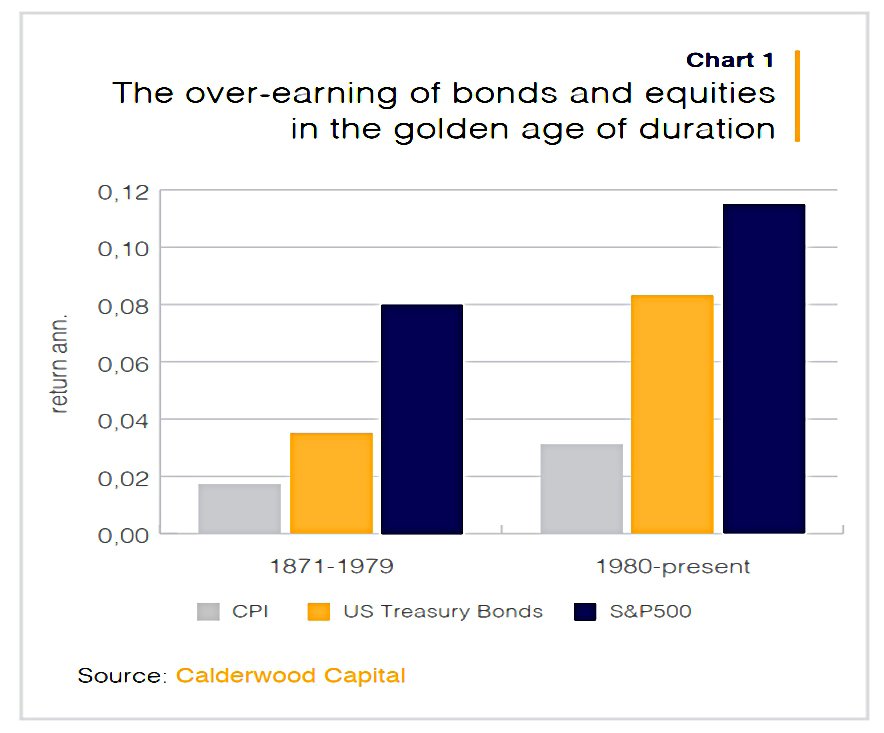
Dylan decomposes equity returns into compensation for inflation, duration risk and then equity risk.
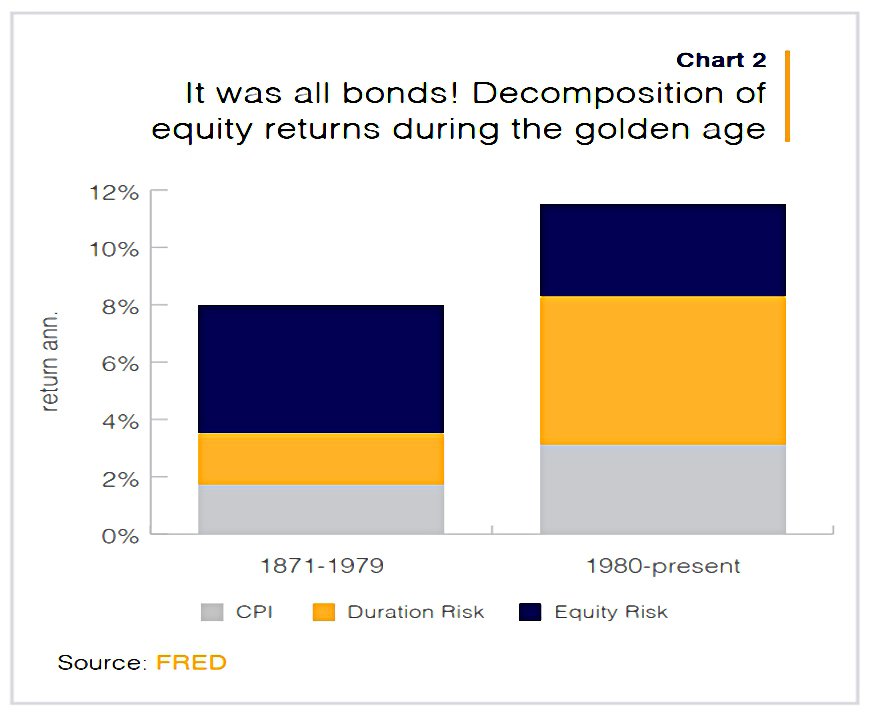
Equity risk wasn’t especially well rewarded in the golden age. The big payoff was from duration risk. The “bull market in everything” over the last four decades has really just been a bull market in duration.
Since (at the time) so much global debt now had negative yields, the duration bull market would seem to be over.
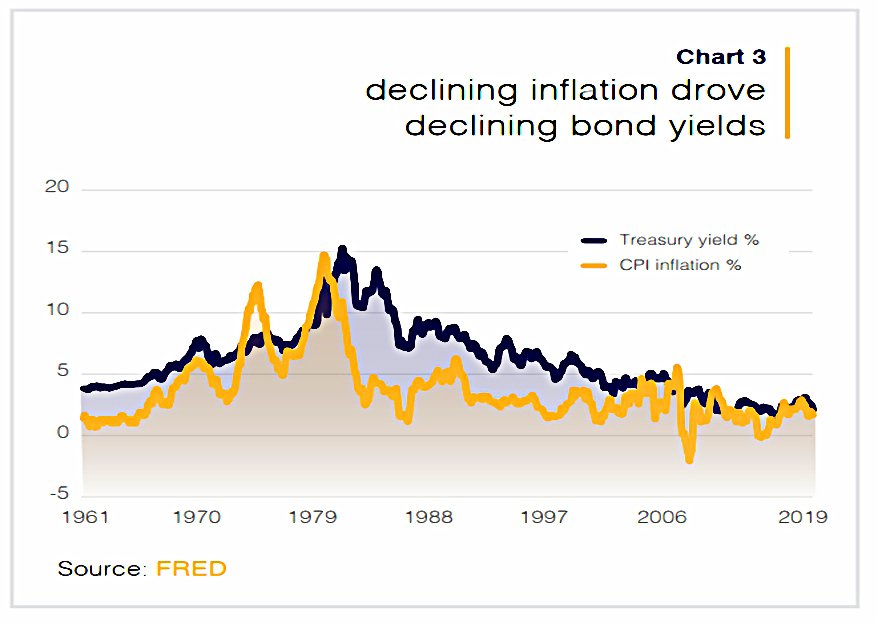
Falling inflation has been the key driver, so Dylan waste to understand what might make higher inflation return. (( We now know that a pandemic and an over-reaction to it will do the trick ))
- This means he needs to work out why inflation fell in the first place.
Globalisation
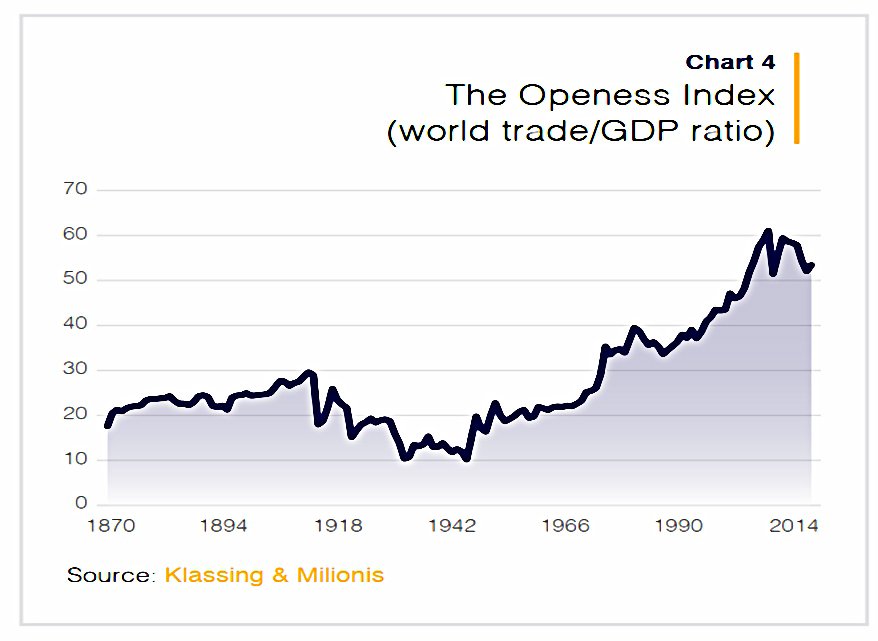
There has been a long trend toward globalisation, though Dylan notes the setbacks after World War 1 and the 1970s oil price shocks.
But how disinflationary has it been?
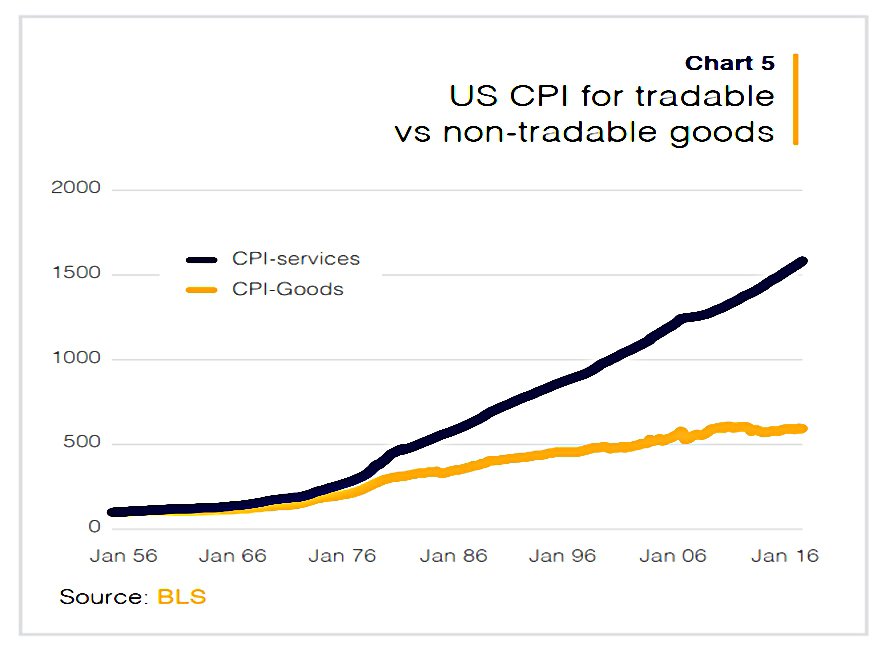
Proponents that the faster price inflation of non-tradables [services] relative to tradables [goods] is evidence of trade keeping a lid on the overall rise in prices.
Dylan puts this difference down to the Baumol effect – the rise of wages in jobs that have experienced little increase in labour productivity (services) compared to those that have experienced higher productivity growth (manufacturing).
Demographics
The second hypothesis comes from the example of Japan, which has experienced both deflation and deteriorating demographics.
But it wasn’t actually that long ago that economists thought rising dependency ratios would be inflationary because when retirees spent from their savings, they would be contributing to demand without contributing to supply.
Dylan thinks there’s a simple explanation.
In 1981 Japan’s inflation rate was 4% while the US’s was 8%, Britain’s was 12%, France’s was 14%, and Italy’s was 18%. So one entirely plausible argument is to suggest that the reason Japan’s inflation is the lowest in the world today is that it started out as the lowest in the world.
Falling populations (or low population growth) mean that GDP struggles, but not necessarily per capita GDP.
- And the effect on inflation is unclear.
The internet

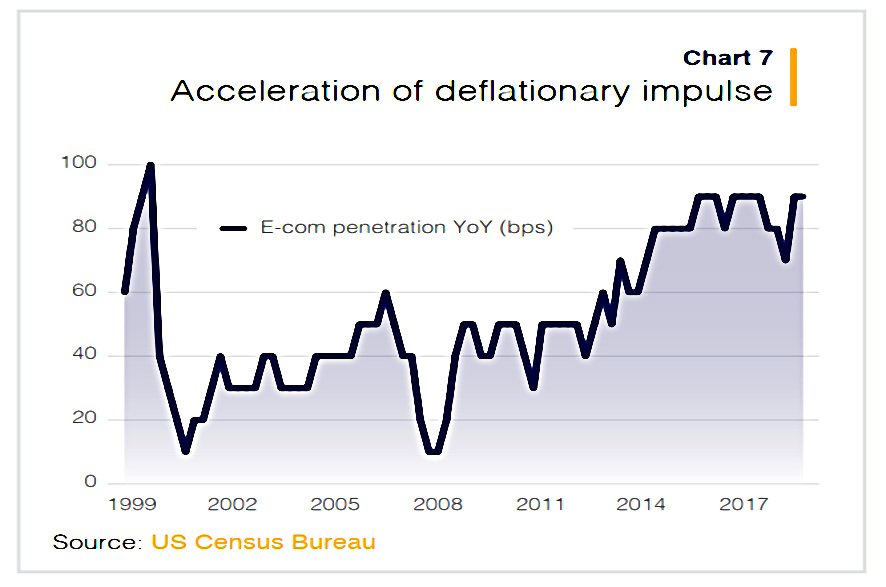
The e-commerce share of US retail sales has risen from nothing twenty years ago to 10% today.
And the rate of internet penetration has been increasing, even before the pandemic.
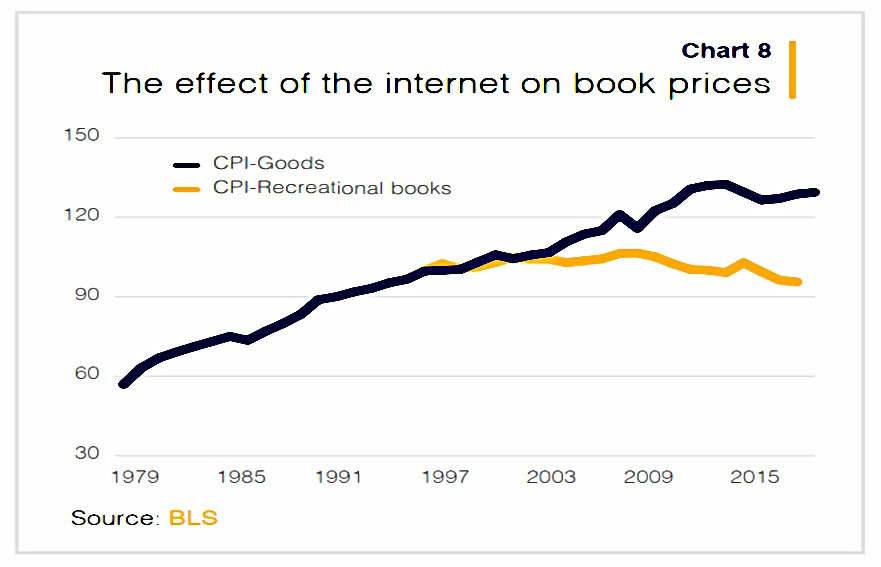
This has impacted book prices.
And has also led to a divergence between goods and services inflation.

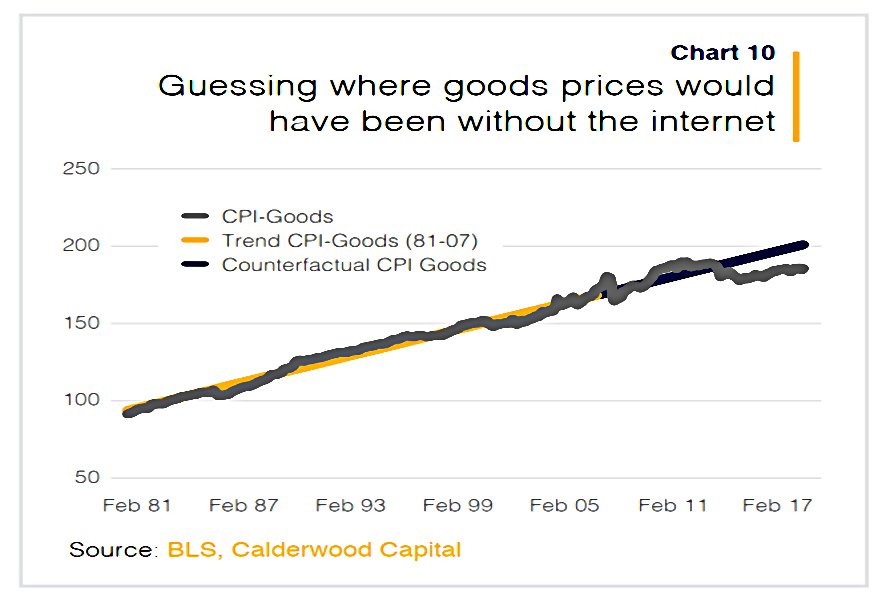
The difference between where the goods CPI is and where it would have been had it not been for the internet, translates into around 90bps per year. Since the goods CPI is around 37% of the overall CPI, this translates into around 33bps per year of lower CPI since 2007.
Central banks
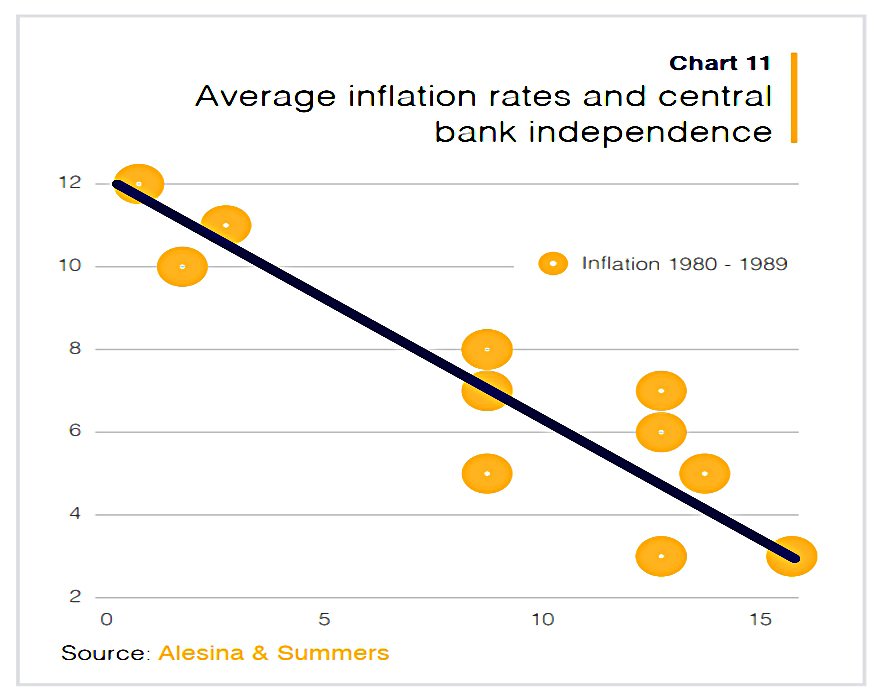
During the inflation crisis of the 1970s, a handful of economists noticed that the few countries that had central banks which were largely independent of political influence, also had the lowest levels of inflation.
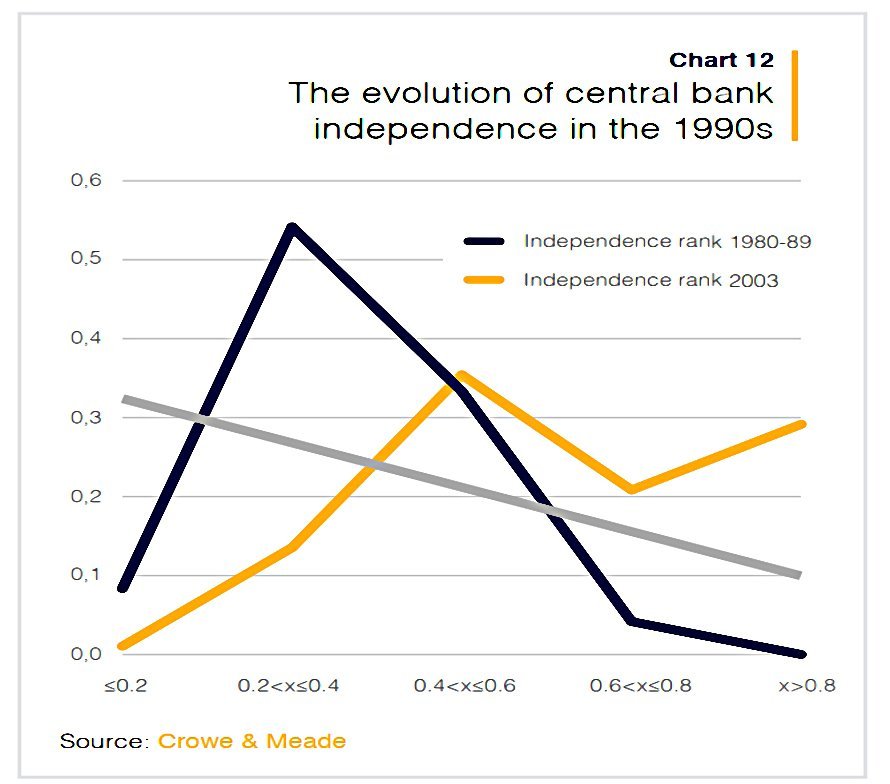
Since then, more central banks have become independent.
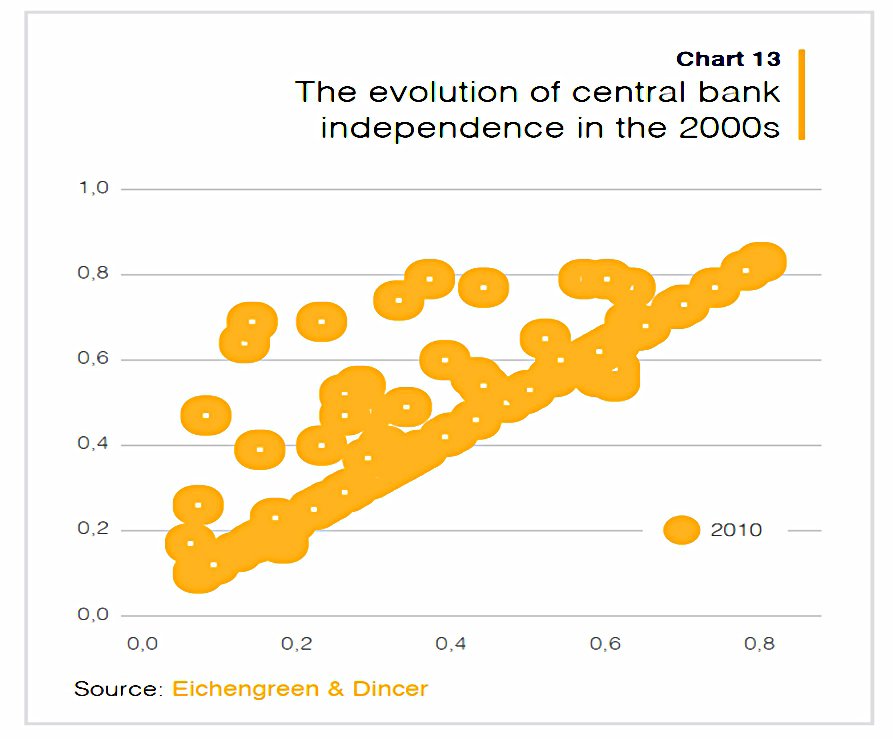
And inflation has continued to fall.
Regressing inflation on some of these CBI indices cross-sectionally you can easily explain a decline in ‘trend’ inflation of about 5%, which is highly meaningful.
Dylan is not surprised that removing incompetent politicians from monetary policy would have an effect.
Economies are naturally deflationary, with a tendency to produce more with less over time. Inflation isn’t a feature, it’s a bug.
Asset price inflation
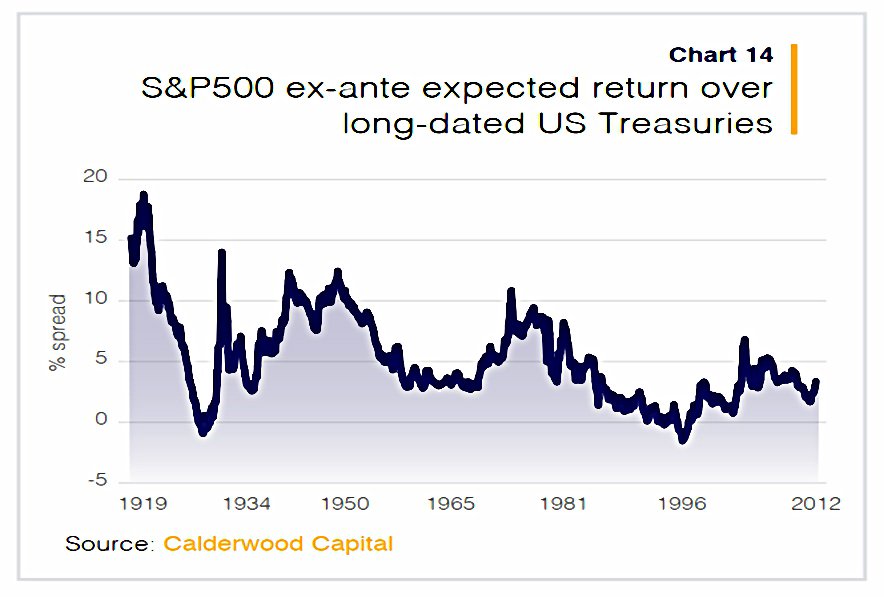
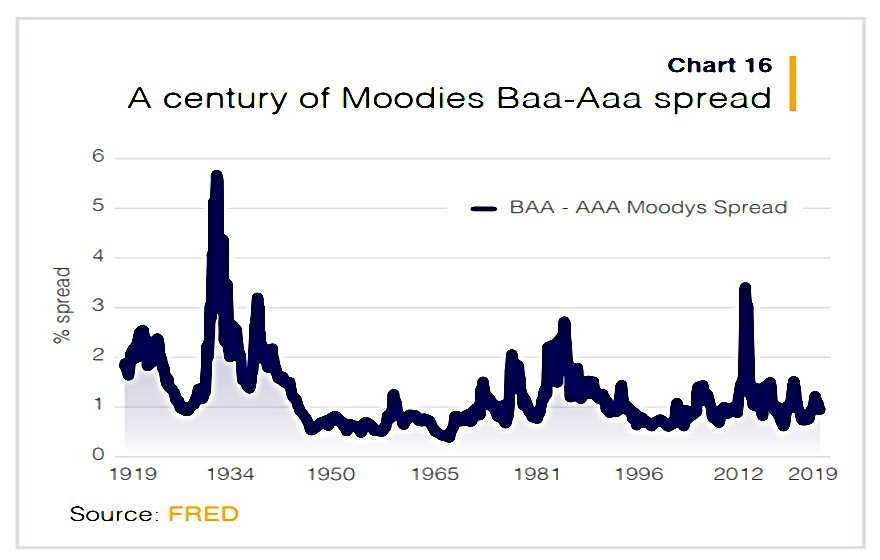
Equity risk and credit risk are cyclically tight and not particularly attractive, but within historical ranges. Inflation has categorically not shown up in the market pricing of risk premia.
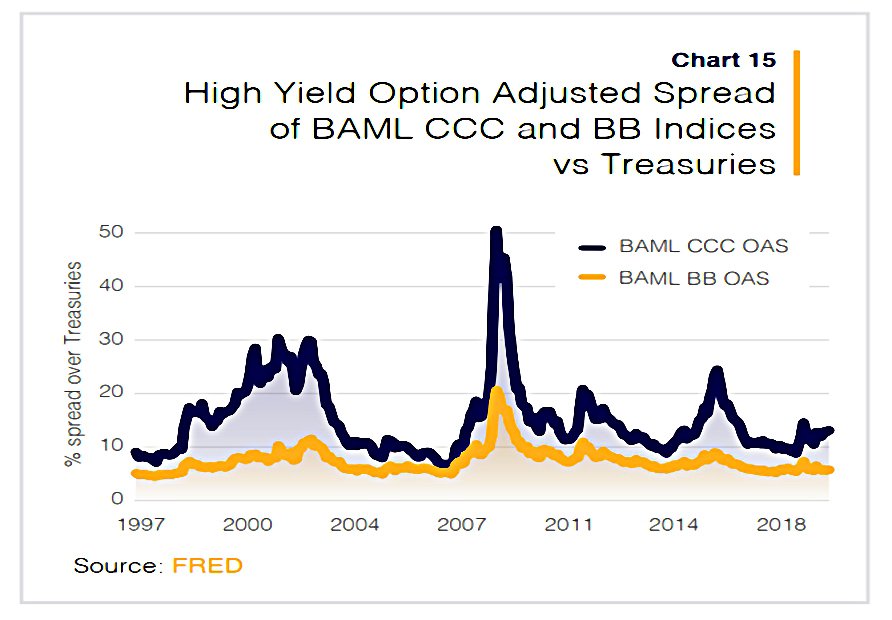
The US equity market is at an all time high and corporate bond yields at an all time low because they are priced off government bonds.
So we need to work out what bond yields should be.
The average yield on benchmark bonds should be roughly equal to the growth rate of the economy.
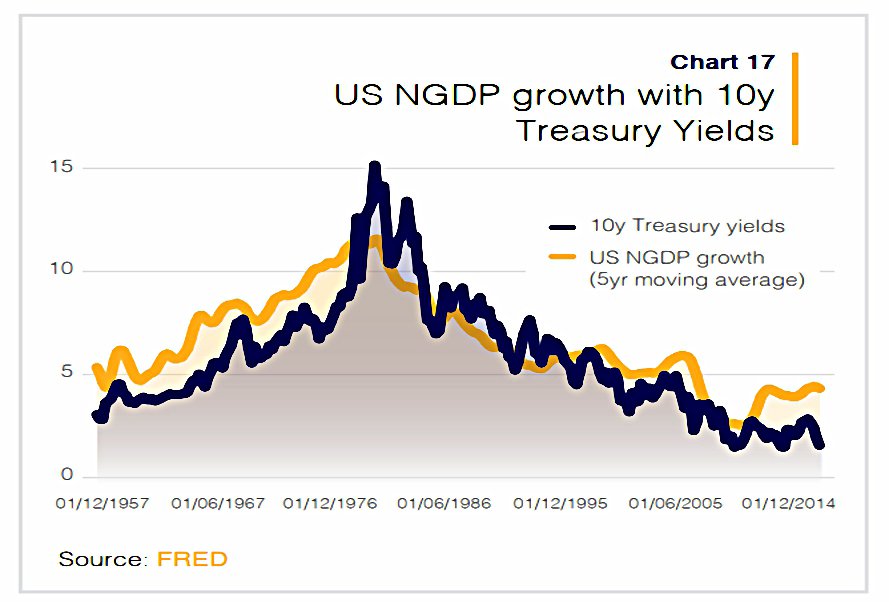
The interesting part of this chart is that in the 60s and the 70s, growth was higher than bond yields.
- This was because inflation kept surprising on the upside.
Since the 80s, bond yields have been higher than GDP growth because inflation has been surprising on the downside.
Central banks are clearly over stimulating. But past episodes of over stimulation of the economy (eg the late 1990s or the mid 2000s) didn’t see such a ‘wedge’ open up between bond yields and NGDP like that of today.
The situation is identical to that of Japan and Germany and very similar in magnitude. 10y yields seem to be around 200bps lower than they should be.
200 bps means a 15-20% fall in bond prices, and a 2% increase in the S&P 500 earnings yield (from 4% to 6%) would imply a fall in the index of 33%.
As interest rates get smaller, the sensitivity of prices to yield movements gets bigger.
The last hurrah
Writing in 2019 (pre-pandemic), Dylan saw all this coming to an end.
The next ten years will see credit, public equity, private equity and venture return 0% in real annualised terms. The risk to this prediction is that yields remain suppressed while risk premia tighten further; equity (public and private) performance remains in the 3/4% range.

Ten years ago, you’d have expected to get about 6% gross total return [from a 60/40 portfolio]. But the actual realised return of the portfolio has been over 10%, which is nearly two standard deviations away, and the largest upside error since the tech bubble of the late 1990s.
Holders of this portfolio are 50% richer than they expected to be.
Conclusions
So the markets were vulnerable to the return of inflation.
- The rate of increase in internet penetration looked likely to slow, and there were calls for a rethink of central bank independence.
As it happened, the pandemic lead to a giant leap forward in the penetration of online services, but it also led to supply chain issues and a retreat from globalisation.
- It also produced a “QE on steroids” response to prop up economies, which led to even more asset price inflation.
We now have plenty of regular inflation and we don’t know how long it will last or how bad the impact on markets will be.
Dylan warns us away from the traditional 60/40 portfolio:
What rose furthest in duration’s golden age – government and corporate bonds, public equities, private equity, venture, real estate – will fall furthest with its passing.
We’ll look at what he recommends instead in a future article.
- Until next time.
Mike Rawson
Mike is the owner of 7 Circles, and a private investor living in London. He has been managing his own money for 40 years, with some success.