The Cockroach Portfolio

Today’s post looks at a paper from Calderwood Capital on the Cockroach Portfolio.
Calderwood
The face of Calderwood Capital is Dylan Grice, who previously worked at SG.
- Dylan was recently interviewed on the Meb Faber podcast, and as a result, he released several papers from behind the paywall.
We’ve already looked at The Death of Duration, and today we’ll be looking at a note from October 2020 (post-Covid crash but pre-vaccine) which looks at the Cockroach Portfolio.
- Dylan first mentioned this portfolio when he was working at SG, but we’ll start with the more recent paper.
The Cockroach Portfolio
What fascinated me wasn’t the challenge of trying to know more about the future than the rest of the market, but of figuring out how to build a portfolio given that you didn’t. That of building a portfolio which is robust to ignorance.
The Cockroach Portfolio (CP) gets its name from the pest that is seen as the ultimate survivor – one that outlasted the dinosaurs, is resistant to radiation, can’t drown and can eat almost anything.
Portfolio construction typically blends assets together based on their expected returns, their volatility and their correlations. The problem is that none of these variables are stable let alone predictable.
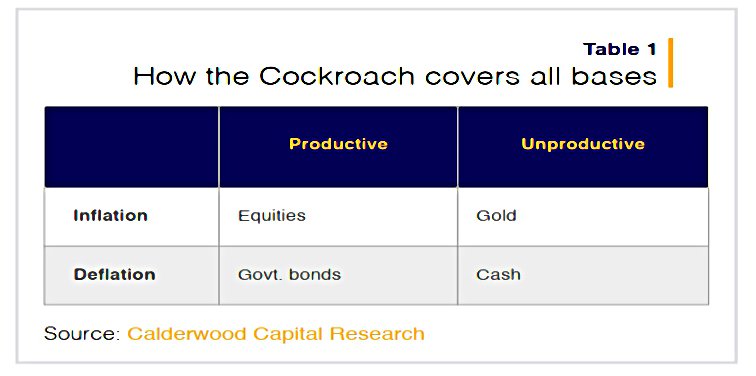
The CP is a simple 2×2 matrix portfolio that assumes that the economy (GDP/growth) will either improve or get worse and that inflation will either rise or fall.
For each box in the matrix, we have a corresponding asset class and the CP simply allocates between them equally:
- 25% stocks
- 25% government bonds
- 25% cash
- 25% gold
The eagle-eyed amongst you will have noticed that this is the Permanent Portfolio made famous by Harry Browne.
- Dylan says that he came to the same conclusion as Harry completely independently, so he continues to use his name for the strategy.
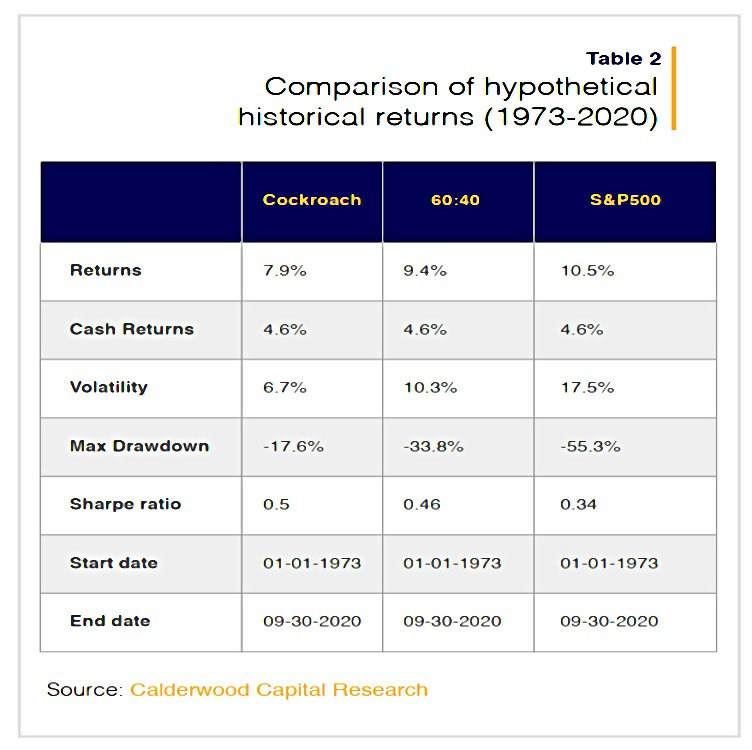
The catch is that this is a lower return portfolio that trades returns for less volatility and smaller drawdowns (and a higher Sharpe than the S&P 500 or the 60/40 portfolio).
- So it would not suit most investors over the entire accumulation phase of their investing journey.
But it makes a lot more sense as a wealth preservation strategy.

And it also did really well in the 1970s, so if you think we are heading for similar conditions to that decade, it might be of interest.
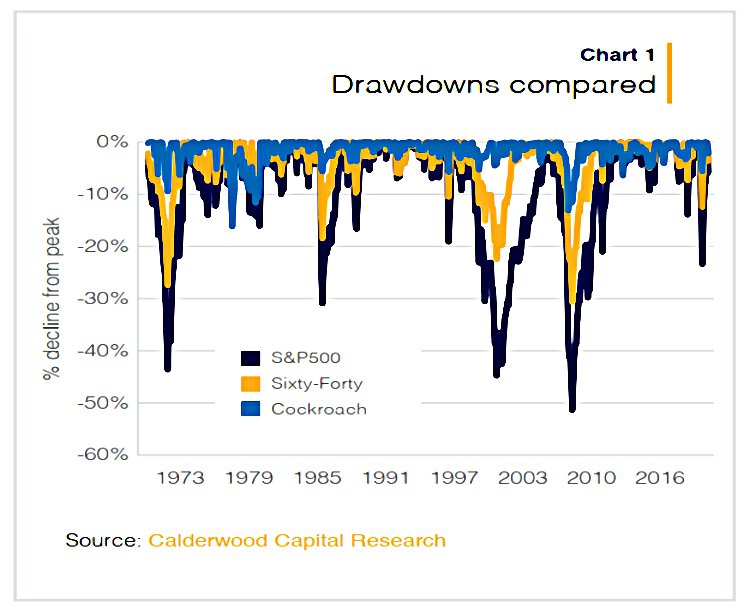
This chart shows how much better the drawdowns have been for the CP.
The CP is not entirely without risk – it lost money in 2008, though less than stocks and the 60/40.
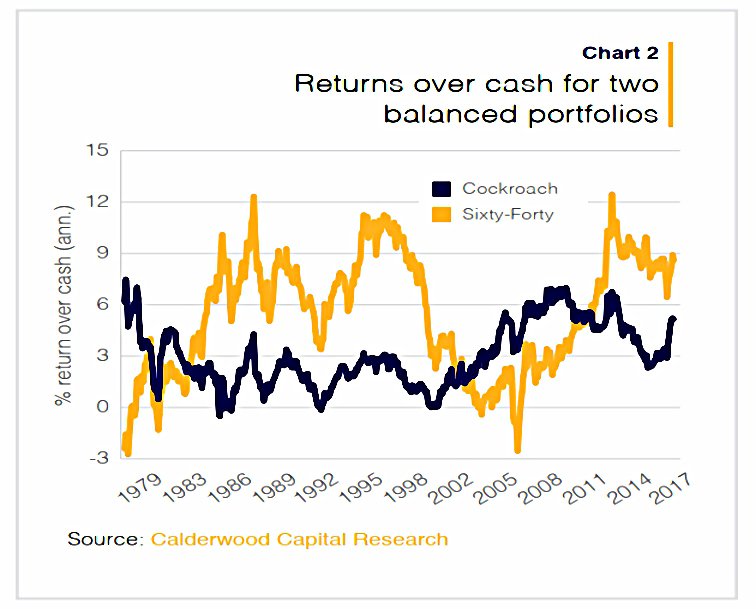
- Dylan chooses to focus on the rolling seven-year returns over cash, a period that shows the CP to be remarkably reliable.
Generic financial risk premia have averaged about 3% per annum. It’s been significantly more stable than that of the 60:40 (standard deviation of 1.61 vs 2.64).
The returns from the CP have also increased.
In the four decades prior to the crash of 2008 its excess return was around 2% per year. But since 2010 it has been 4%.
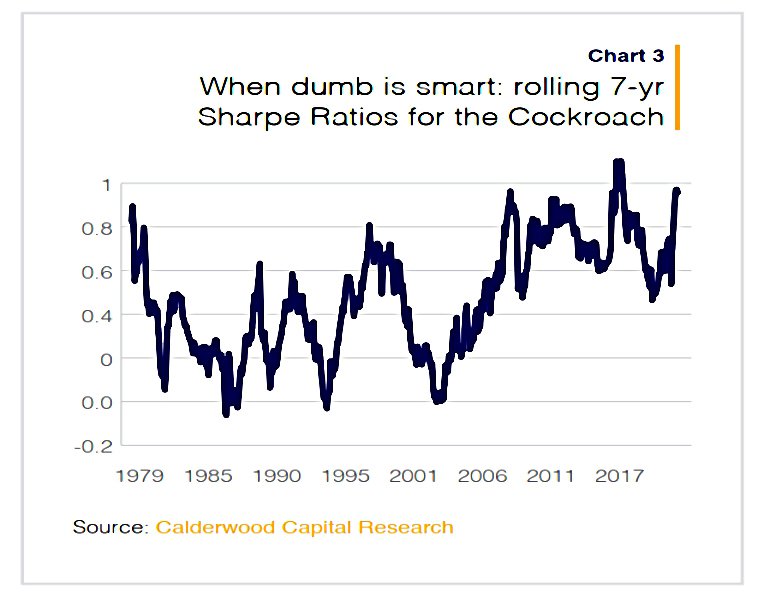
The rolling 7-year Sharpe for the CP is over 1 (pretty good).
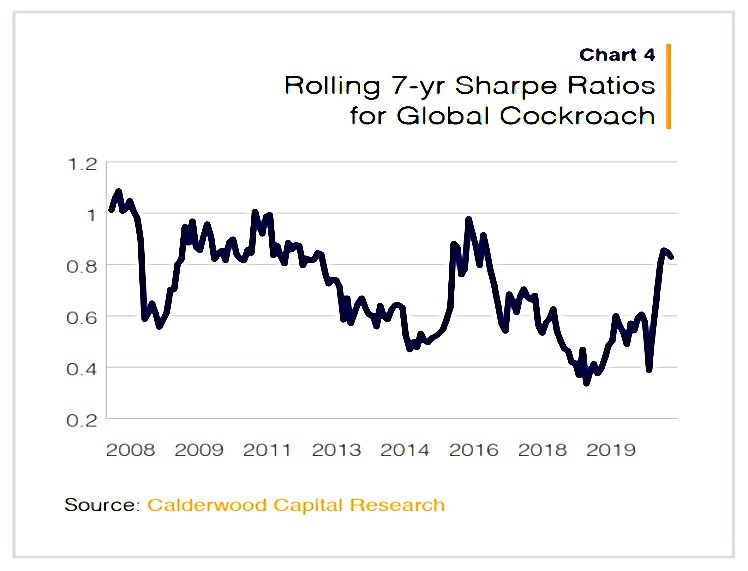
And the global (as opposed to US) CP also has a decent Sharpe.
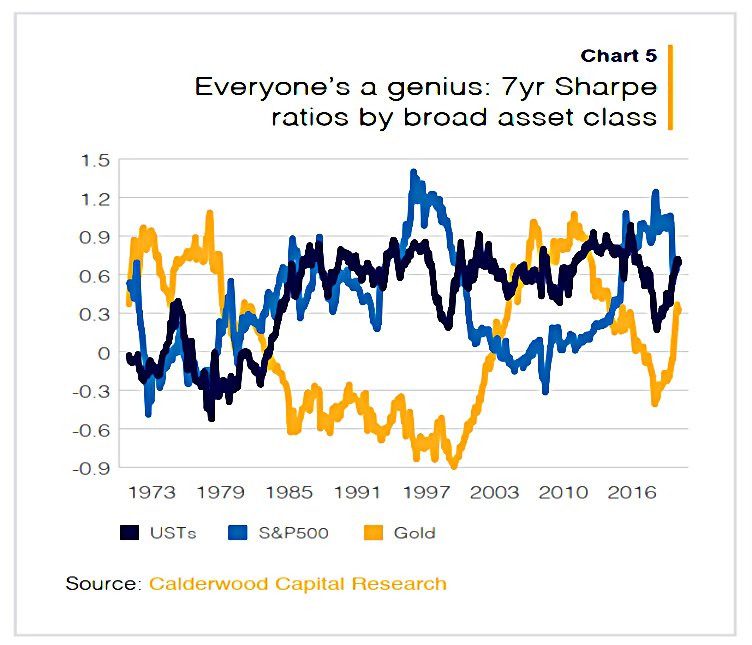
All of the asset classes have been doing well in terms of Sharpe.
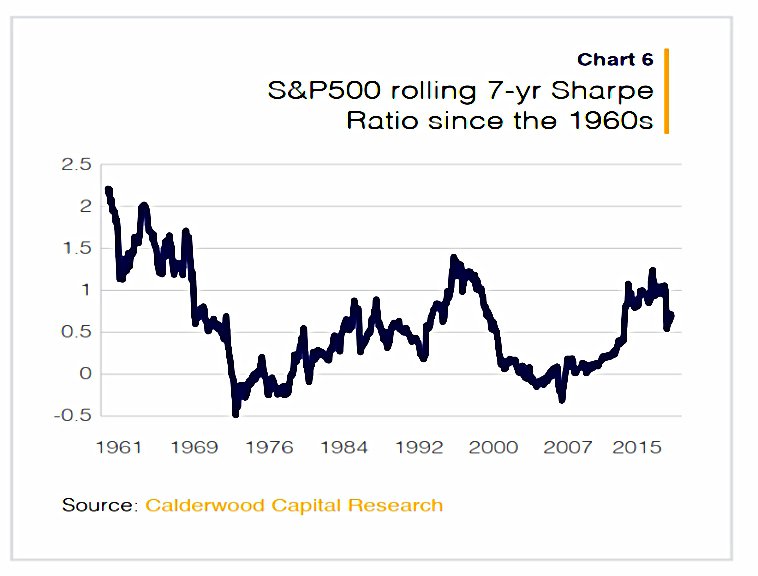
Dylan also notes that despite the good recent returns from the S&P, it’s Sharpe in the 1960s and early 1970s (the Nifty Fifty era) was even better than both post-2008 and the dot com era.
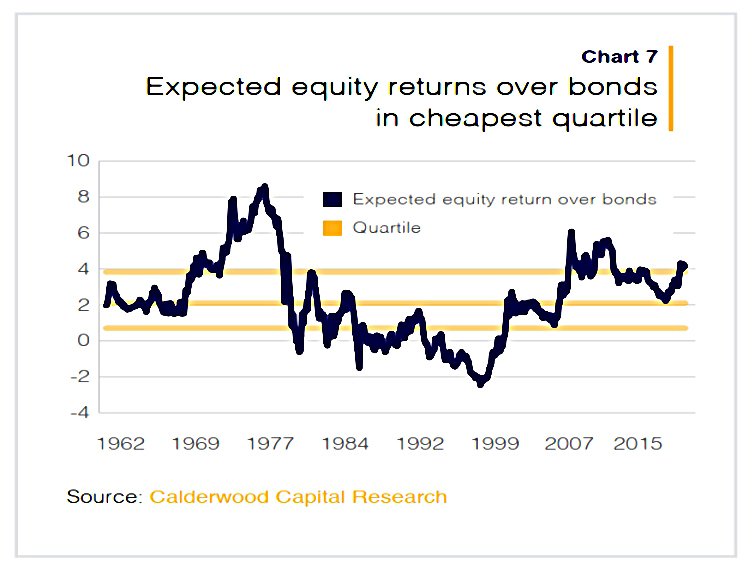
When we compare the expected return of the S&P500 (earnings_yld + inflation_breakevens) relative to those for Treasuries (yld_to_mat + roll_yield) we find them to be in the cheapest quartile relative to bonds.
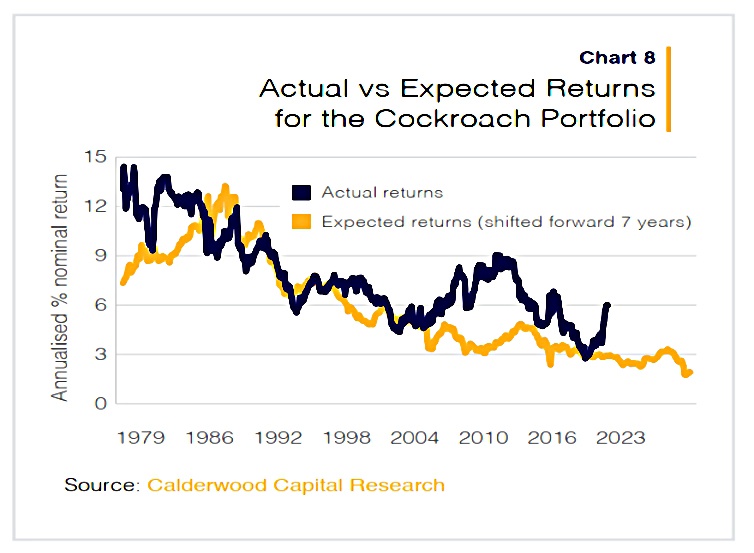
In contrast, expected future returns for the CP are much lower.
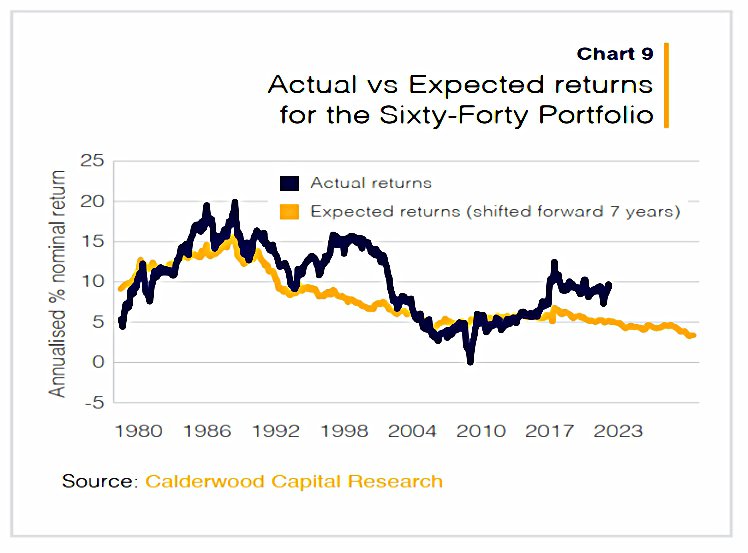
And the same is true for the sixty-forty portfolio.
Conclusions
Dylan concludes that good recent returns suggest a flight from cash.
- Because stocks are still (after a very good run) cheap relative to bonds, the driver is monetary policy (QE and low interest rates).
As future returns fall, the sustainability of the situation in 2020 seems less likely.
- Dylan predicted a market melt-up (which came to pass, driven by the vaccine discovery), followed by inflation (which has now arrived).
That’s it for today.
- In the next article, we’ll take a look at the Cockroach Portfolio from the perspective of a different investment manager.
Until next time.
Mike Rawson
Mike is the owner of 7 Circles, and a private investor living in London. He has been managing his own money for 40 years, with some success.