Trend Following with Options

Today’s post looks at the use of options for trend following.
Contents
Convexity and Premium

We begin our investigation with three papers from NewFound Research.
- The first – from February 2019 – is by Corey Hoffstein and is called Trend: Convexity and Premium.
Corey’s goal in the paper is to show that some of the trend’s properties arise from the trading strategy and are not due to investor behaviour.
- But he uses an analogy with options to do this.
Convexity
Trend has a convex payoff profile with a positive skew.
- This means there are lots of small losses (from reversals) and a few big winners (from long-running trends).
Most risk and style premia have the opposite profile – concave payoffs with a negative skew.
- Which makes trend useful for diversification.
Trend is like buying insurance and “normal” styles are like selling it.
The mental model of selling insurance makes quite a bit of sense, as we can think of expected excess returns as being the reward earned for being willing to bear the risk others wish to transfer away.
Which makes trend unusual.
Corey wants to separate the anomalous (positive) returns of trend from its payoff profile.
- To do that he uses an analogy with an options straddle.
Law of one price

The Law of One Price (( Which I will cover in more detail in a future post )) states that two securities with identical payoffs should have the same price (otherwise it would be possible to arbitrage between them).
- Thus options can be priced by replicating their (complicated, non-linear) pay-offs.
You can’t replicate the call option payoff above using a static (passive) portfolio – you need a dynamic trading strategy.
A call option with a strike of $90 on a stock worth $80 will pay out $10 if the stock ends the year at $100 and nothing if the stock ends up at $60.
- If we borrow $15 (( at an assumed zero interest rate, but the calculation works for any interested rate, only with more complicated numbers )) and buy 0.25 shares for $20 (net outlay of $5), we have the same payoff.
If the stock rises to $100 we sell for $25 and have $10 after repaying the loan.
- If the stock falls to $60 we have $15 and nothing left after paying the loan.
Since this structure has the same payoff as the option and costs $5, the option must be worth $5.
Long gamma
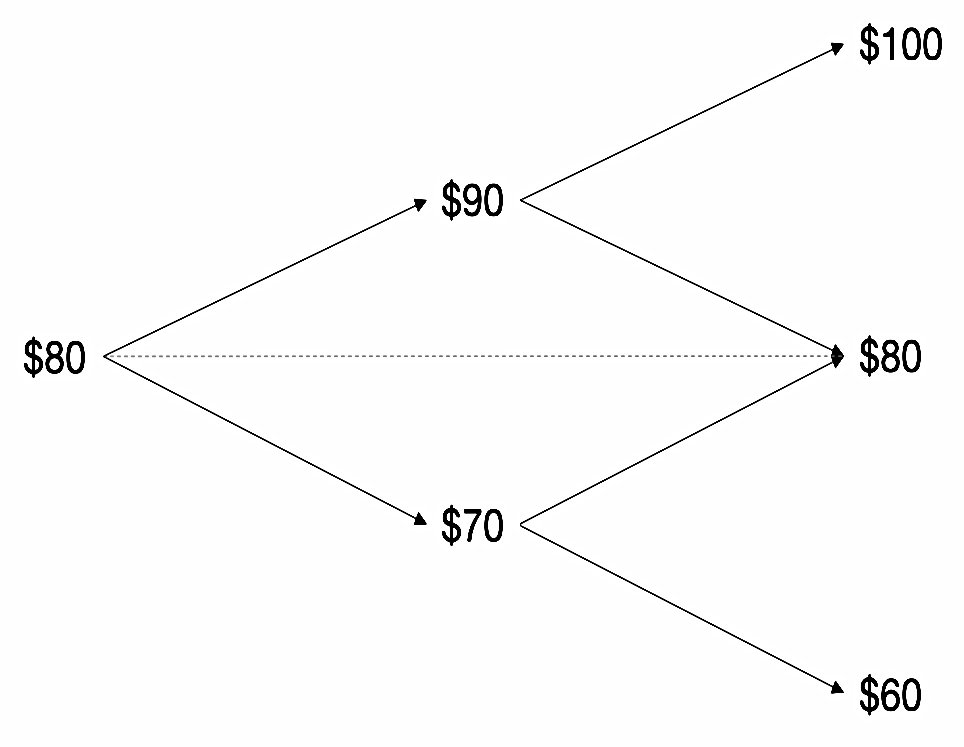
Next, Corey splits the price moves across two equal time periods.
- Using simultaneous equations for both periods, he shows once again that the value of the option is $5.
The number of shares held in the replicating portfolio informs how sensitive the option price is to movement in the underlying stock. The more shares held, the more sensitive the option price is to the stock price change. This is known as the option’s “delta.”
The number of shares required by the replicating portfolio also changed based upon changes in the underlying stock price. This is known as an option’s “gamma.” This measures how the options delta changes with changes in the stock price.
As the stock price increased, the number of shares required to replicate the option increased. A call option has positive gamma.
Put options also have positive gamma: the more price falls below the strike, the more shares we need to short to replicate the option.
- This means that these options can replicate a trend-following strategy.
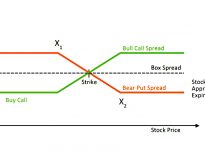
Straddles
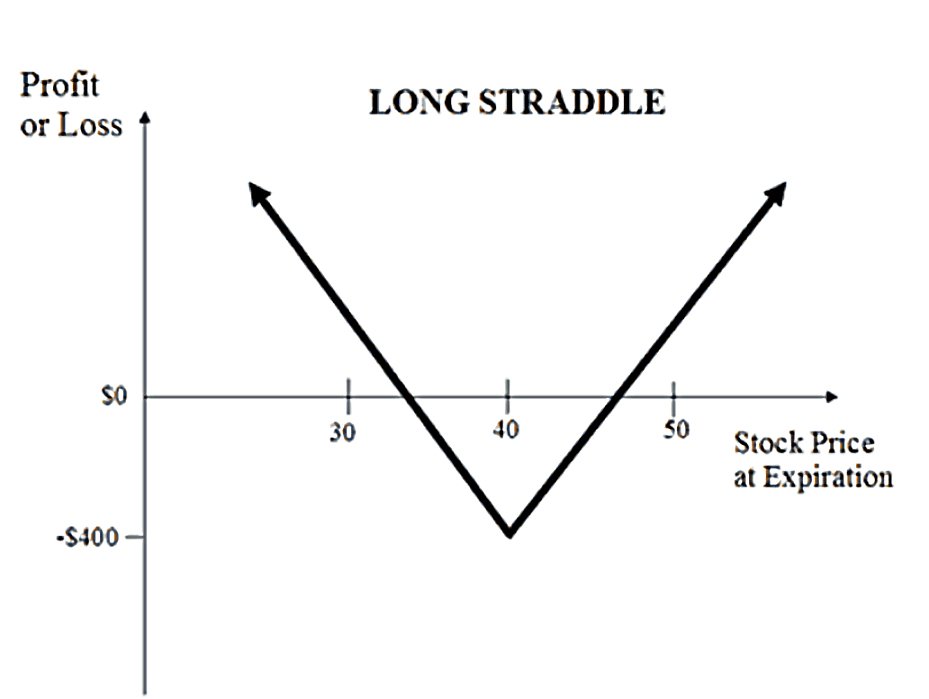
Buying a put and a call at the same maturity and strike is known as a straddle.
- This replicates trend-following and has the same convex payoff profile.
You need to subtract the cost of the options from the return of the straddle, and these costs will depend on implied volatility.
- With trend, trading costs need to be subtracted – these are path-dependent on returns, and hence on realised volatility.
Trend is also continuous rather than having a defined expiry date as options do.
Straddle-ish
A simple trend model might go long the S&P 500 when the 12-month return is positive, and short it when it is negative, with monthly rebalancing.
- To model this with straddles, Corey uses the price from 12-months ago to give the strike point of the straddle.
The model uses a 1-month expiry and recent realised volatility as implied volatility.
- The Delta (from the Black-Scholes equation) will be between 1 and -1, and Corey uses this as the percentage allocation to the S&P 500. (( The rest is invested in cash or zero-return bonds).
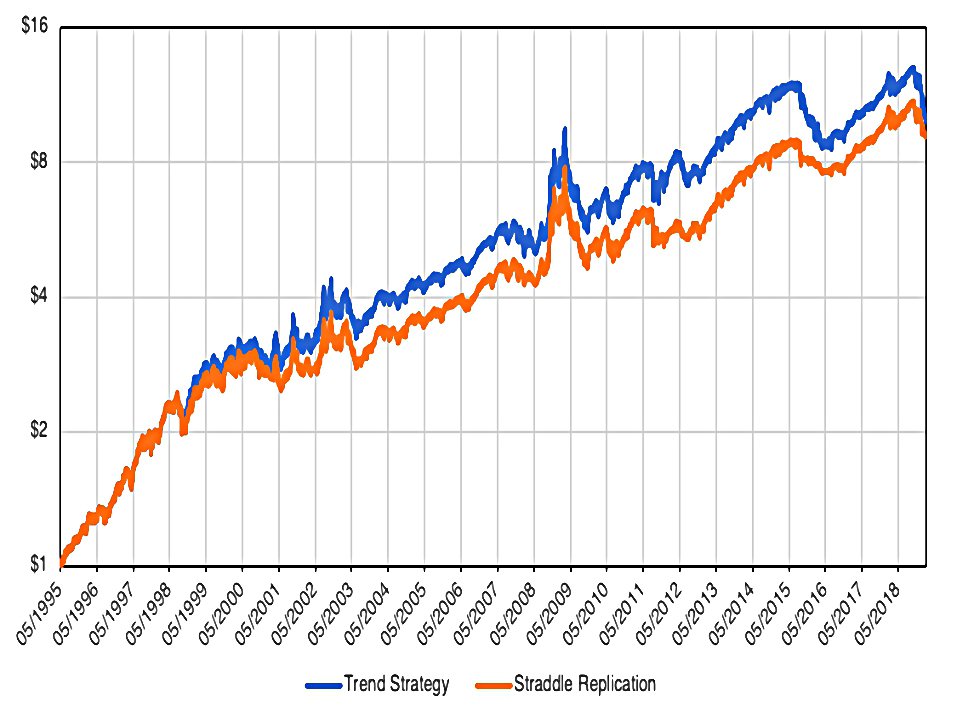
The correlation between the two approaches (using monthly log returns) is 95.8%
- Note however that the options strategy is slightly behind the pure trend approach.

The binary trend signal and the straddle delta are nearly identical when price is greater than 0.6 standard deviations from the strike in either direction. In this model, this can be interpreted as a strong trend where the trend strategy allocation and delta straddle allocation will coincide.
Within that range, however, we can see that the trend signal over-estimates the delta. Therefore, in cases where price continues away from the strike, the binary signal will out-perform and in cases where price reverts back towards the strike, the binary signal will under-perform.
Corey uses this property to explore why trend-following strategies need to be rebalanced frequently.
- When the straddles have quarterly expiry, the “one of confusion” extends to 1.2 standard deviations.
Corey digs into the maths to reach the following conclusion/dilemma:
For a simple binary long/short trend strategy to reflect the delta of a straddle, it needs to be close to expiration when the delta function looks more like a step change. However, for the changes in delta from rolling the straddle position to reflect changes in delta from replication, the roll must occur near inception!
He sticks with monthly rebalancing.
Returns drivers
Corey next returns to the question of why trend (or straddles) should show positive returns:
Why would we expect the replication of a straddle to have a positive return? Positive convexity, sure. But a positive return?

Using some more complicated maths, he separates the option payoff and trading impact of trend following the S&P 500.

The option is similar to a straddle struck on the trend of the underlying asset. This component has a short memory and provides much of the convexity often associated with trend-following returns.
The second component is the trading impact. This component is low frequency and the driving factor is the realized Sharpe ratio. It even resembles the gamma gain minus gamma loss of a traditional straddle delta-hedging strategy.
The long-term driver or trend returns is the trading impact rather than the convexity.
Given that trend following has positive gamma, we would expect the trading impact to be positive for returns that exhibit autocorrelation (i.e. trending returns).
It turns out that autocorrelation might not even be necessary – a positive Sharpe may be all that is needed.
Conclusions
Today’s post is a bit of a warm-up – we’re moving towards a model of how best to mimic trend following using options.
- It looks like straddles are the way to go, and in the next post, we’ll dig into them in more detail.
Cory was more interested in separating convexity from returns, which is interesting, but of less practical use.
- Until next time.
Mike Rawson
Mike is the owner of 7 Circles, and a private investor living in London. He has been managing his own money for 40 years, with some success.