Vanguard Diversification

Today’s post is about a report from Vanguard on global diversification.
Contents
Deja vu
We first came across the 2012 version of the Vanguard paper a couple of years ago, when we looked at Home Bias.
- It’s possible that the more recent paper has little to add, but as a minimum we should expect some updated charts.
Before we find out, let’s take a quick look at what I said last time.
What is passive?
The default setting for passive investing today is a global market cap-weighted equity portfolio.
- This is a change from the home bias (see below) of a few decades ago.
Some people might call the new orthodoxy the “own the world” approach.
- Others who use that term would mean that all available financial assets should be included.
I’m in the latter camp on own the world, but “the global portfolio” is not readily available for investment.
- So in one sense we are all active investors.
I also question the idea that the market cap is a passive or neutral weighting.
- Market caps are not stable, and they include the market’s current view of an asset prospects.
There’s also the question of active vs passive management.
- Passive is cheaper, so it must come out on top in aggregate.
The more developed the market, the more likely you are to plump for a passive fund (an ETF or a passive OEIC) than an active fund (an investment trust or active OEIC).
- But in your home market – particularly in a liquid, internationally-focused market like the UK – you might prefer to hold stocks directly, either in a buy and hold strategy, or by active trading.
The final question is where do systematic strategies – like smart beta or factor funds and trend following – fit in?
Hand-crafting
As we saw a couple of years ago – when I used Rob Carver’s version of hand-crafting to tweak my asset allocations into what I called The Perfect Portfolio – the key drivers of asset weights are:
- Future returns
- The volatility of future returns
- Correlations with other assets, particularly with those showing the highest returns or having the largest weights in your portfolio.
Returns and volatilities are difficult to forecast, but since they are linked, we can assume constant Sharpe ratios to simplify the allocation.
- That leaves correlations (necessarily historic) as the key driver.
We want a portfolio of many moving parts – each moving in isolation in so far as that is possible.
- This militates against a market cap portfolio, which will be dominated by the US allocation.
I call this “away bias”.
Home bias
Home bias is the tendency of investors to put a large proportion of their money into domestic equities, despite the mathematical benefits of diversifying into foreign stocks.
- Home bias works within a country, too – US investment managers prefer firms with local HQs, for example.
The historical basis for home bias was the extra difficulty involved in investing abroad (legal restrictions, extra transaction costs).
- These difficulties have reduced over time, and ETFs have made investing abroad much easier.
Domestic equities can also be seen as a hedge against domestic inflation.
- Foreign equities could do the same, but with extra currency risk.
People are also much more familiar with the companies in their home market and tend to trust them more (and therefore to see them as safer).
- They are also more likely to be optimistic about the prospects for the domestic market, and to be pessimistic or indifferent about foreign markets.
Home bias is okay
Here are a few reasons for sticking with your home team:
- (Lack of) currency risk, as mentioned above.
- FX risk should even out over the long term, but it can be comforting to minimise it in the short term.
- FX risk is more complicated if you intend to retire abroad.
- Information – we best understand the companies, governments and legal systems closest to us.
- This is particularly true of smaller stocks.
- UK corporate governance (reporting, transparency, shareholder rights) is stronger than is most other markets.
- Cost – it is usually cheaper to trade in local stocks (and there are no FX charges).
- Taxes – there can be tax implications of holding foreign assets.
- It’s easy to avoid this in the UK by holding ETFs within ISAs and SIPPs.
I also need to make room for the active part of my portfolio, which is strongly biased to the UK (perhaps 50%).
Vanguard
The Vanguard take on international diversification is interesting for several reasons:
- Vanguard are the poster company for passive investing, though they do offer active funds.
- The debate around home bias forces us to evaluate what we mean by passive and active (see above).
- The recently deceased founder of the firm, Jack Bogle, argued for years that (US) investors didn’t need to diversify internationally, on the basis that the US was the strongest market.
- This suggests that Jack either had the mental strength to cope with the effects of a severe downturn on a concentrated portfolio, or that he didn’t understand the relevant maths.
- Vanguard’s funds have been very widely adopted by younger investors, and the implementation of this adoption has centred around very simple portfolios (often one to three funds)
- Thus the options on offer from Vanguard have serious implications for the portfolios such investors will hold.
- The funds available in the tend to be biased towards the UK (compared with market cap weightings, which are not the best) or to contain a very high US weighting (away bias).
Some numbers
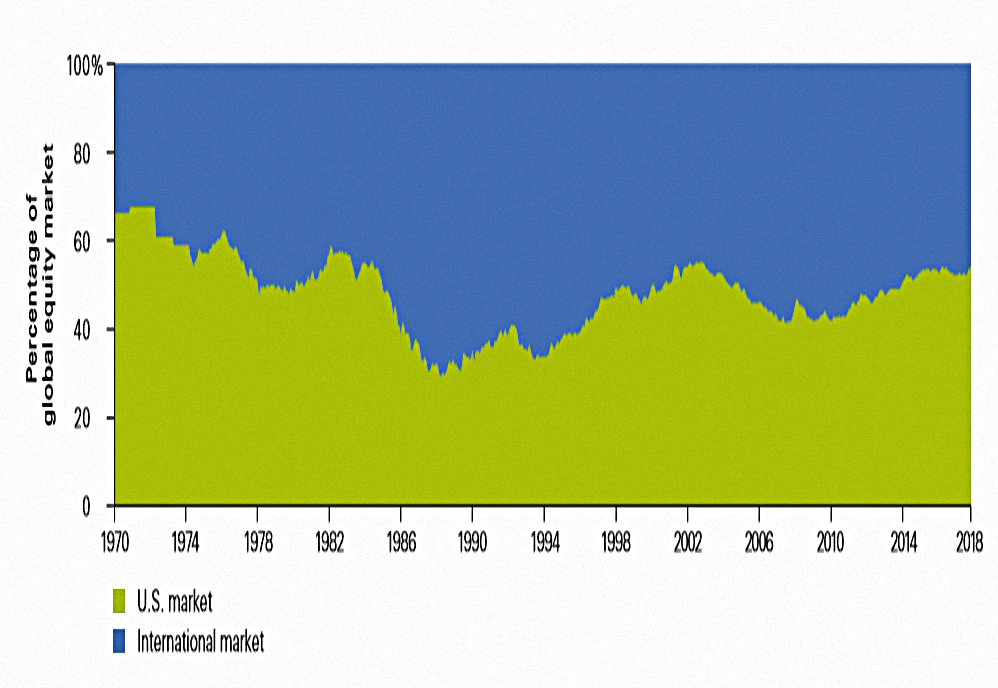
Let’s look at UK and UK weightings to get a feel for the landscape.
Market weightings fluctuate, but in recent years, the UK has had a 6% to 7% share of global equity markets by value.
- The US tends to be in the 50% to 55% range.
I would argue that both these weights are wrong for a UK private investor (too low and too high respectively).
In simpler times, I used a 50/50 split between UK and international stocks.
- That led to a target US allocation of perhaps 12% (which I often fell short of).
The Perfect Portfolio -which is multi-asset – has a target allocation to the UK of 22.4%
- And a US allocation of 9.3%
Mostly for historical reasons, I am currently overweight the UK and underweight the US.
- But I’m working on it, and I should be much closer to my targets by the end of 2019.
The 2012 report
Vanguard’s 2012 report looked at the US, UK, Australia and Canada.
- It plotted returns against volatility (standard deviation) for portfolios ranging from 100% domestic to 100% international.
Their conclusions were:
U.S. investors may have some justification for marginal home bias, but investors in Australia and Canada might consider increasing their allocations to foreign securities.
The results for U.K. investors are mixed, with less overall concentration in domestic securities but still room to diversify.
The sweets spots for the portfolios were:
- US – 80% domestic
- UK – 65% domestic
- Australia – 50% domestic
- Canada – 35% domestic
That’s a higher UK allocation than I remembered.
The new paper
As in 2012, the revised paper looks at equity volatilities.
Here’s the baseline by country:
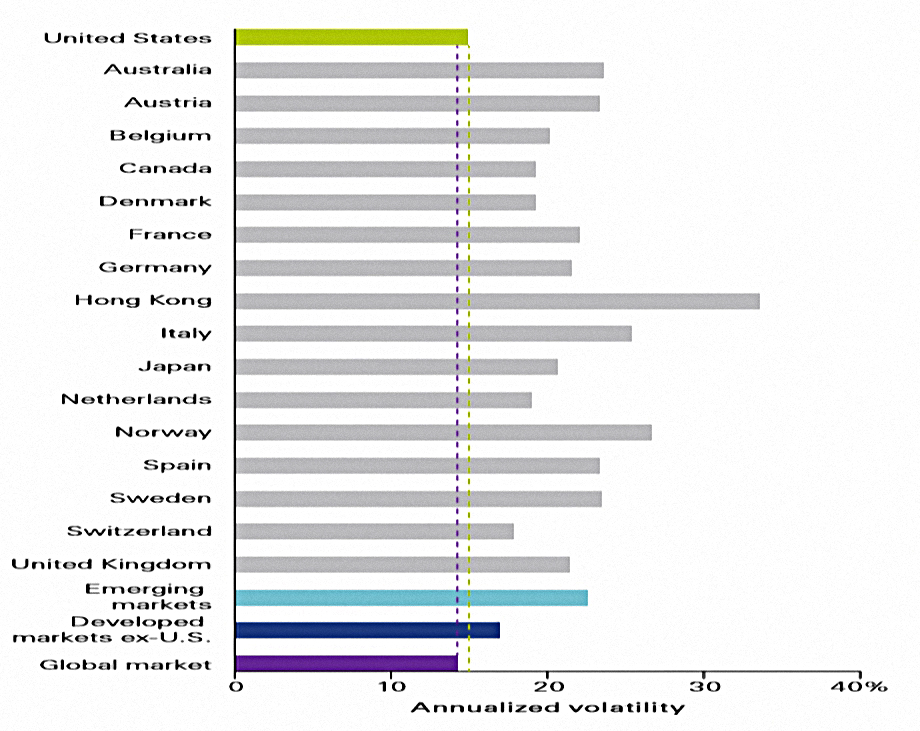
The UK is about average, which is to say very volatile (more than 20% pa).
- Note that the global market has the lowest volatility, but it’s still not very low.
Here’s the impact on volatility from going international:
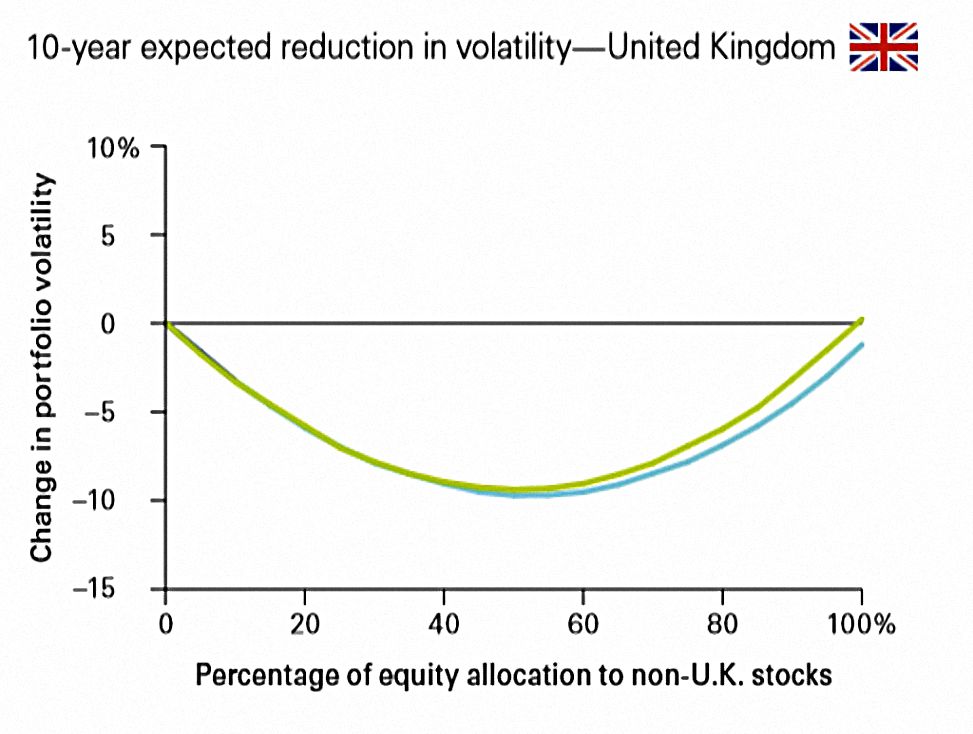
- The green line is 100% stocks, and the blue line is a 60/40 stock / bond portfolio.
- These are 10-year simulated returns, from 10K runs (Monte Carlo, perhaps).
The sweet spot is around 50%, but any international allocation between 505 and 70% seems fine.
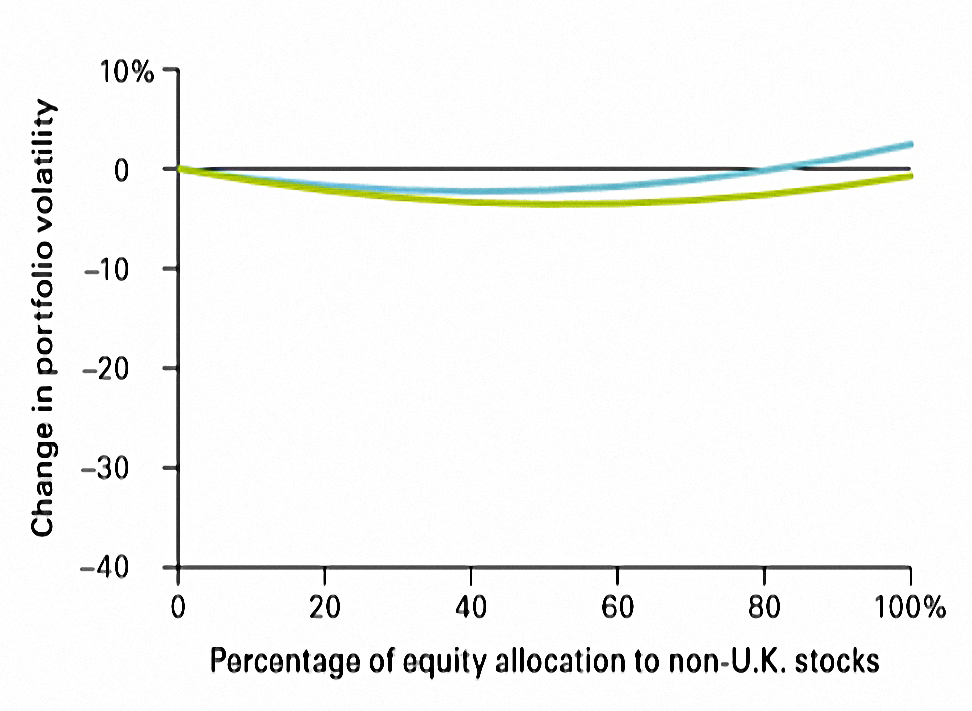
Here’s the same chart (but annoyingly with a different Y-axis) using real data from 1999 to 2018.
Vanguard notes that correlations have risen in the last decade.

There are two points here:
- The chart shows the US / international correlations, not UK / international ones.
- The last decade has seen an unprecedented level of central bank intervention in and influence over the markets.
- This has affected many mathematically based strategies (eg. value factor, trend following) and not just correlations.
- There’s no way to know how long this period will last.
Returns
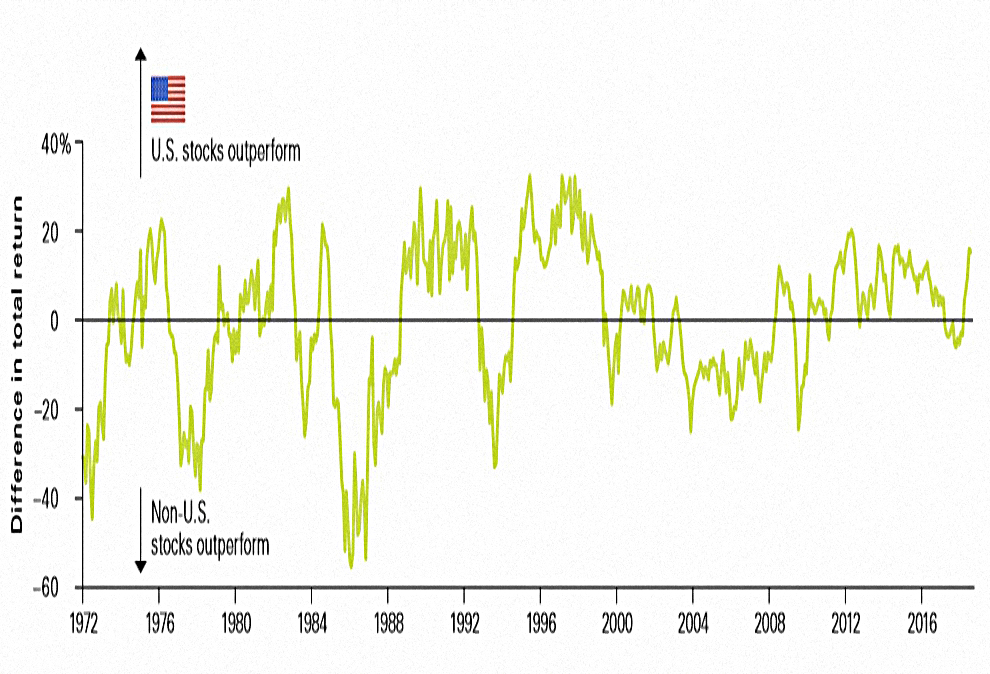
US stocks have also outperformed over the past decade, but this has not always been the case.
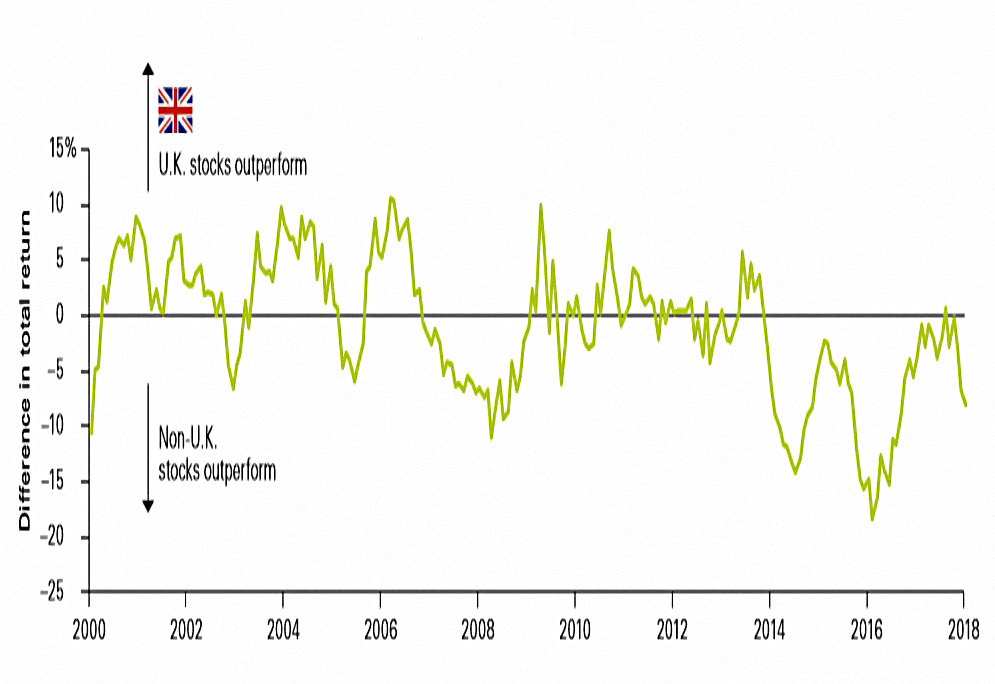
The opposite applies to UK returns.
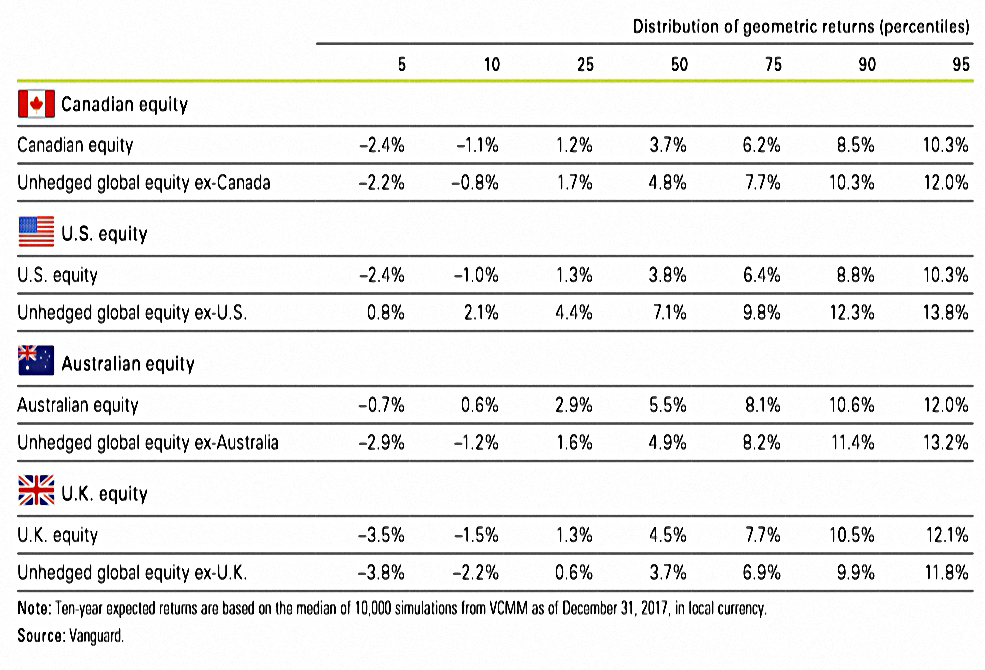
At the start of 2018, Vanguard were predicting higher 10-year returns from the UK than from the US (or international stocks).
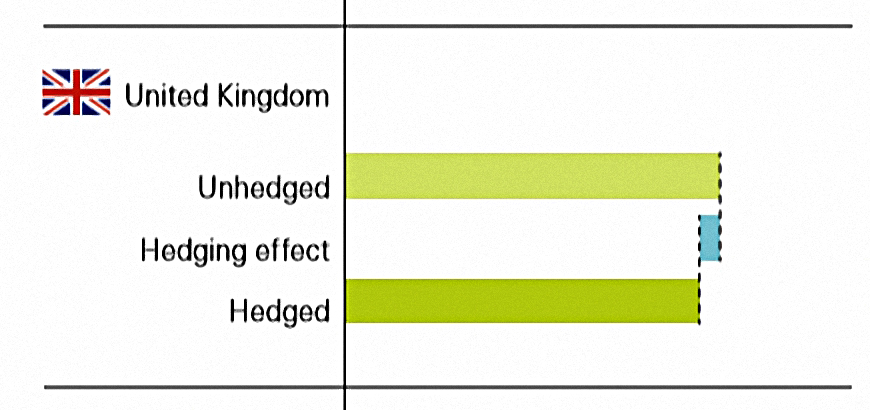
They also note that currency hedging has little impact on volatility of international returns to UK investors (and could be expensive to implement).
Conclusions
The new paper hasn’t change my mind about anything, but that’s not a bad thing.
- There’s no such thing as a passive investment.
- UK investors can probably safely use anything from 30% to 75% as an international (equity) allocation.
- I’m targeting the middle of this range (after allowing for non-equity constraints), and slowly moving towards it.
- Market cap weighting turns home bias into away bias (to the US).
- US returns are flattered by the last decade, and UK returns are misleadingly low.
- Central bank intervention since the 2008 financial crisis is leading to unusual market behaviour.
- Hedging isn’t worth it.
Until next time.
Mike Rawson
Mike is the owner of 7 Circles, and a private investor living in London. He has been managing his own money for 40 years, with some success.