Weekly Roundup, 26th April 2017

We start today’s Weekly Roundup in the FT, with the Chart That Tells A Story. This week it was about estimates of lifespans.
Contents
Lifespan estimates

Josephine Cumbo looked at a phenomenon that we picked up on Twitter last week.
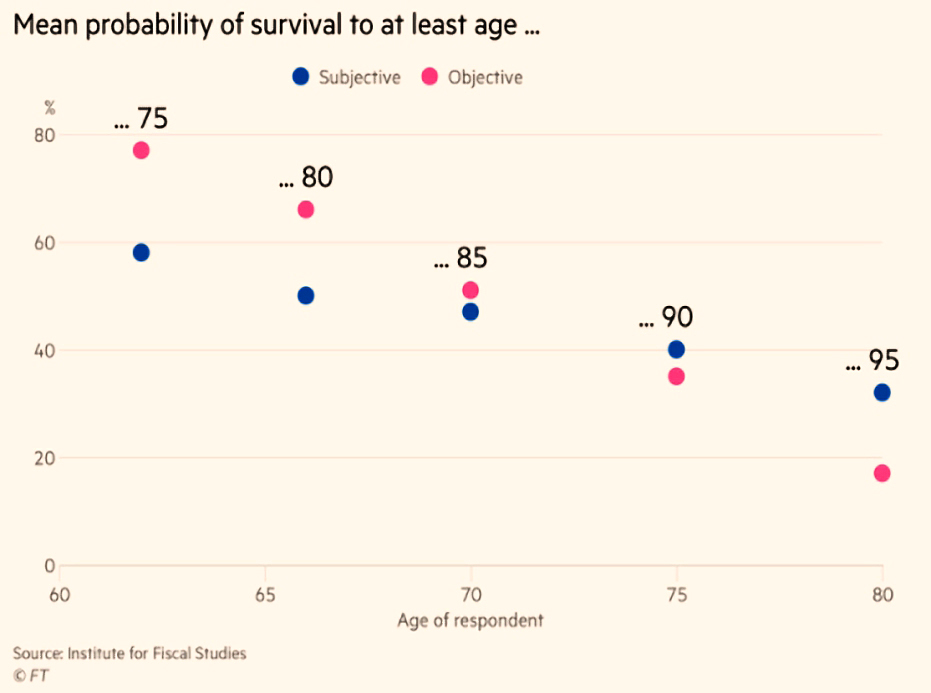
People in their sixties underestimate their chances of living to 75 or 80.
- Conversely, those over 70 overestimate their chances of living to 90 or more.
It’s the first part of the chart that’s the bigger problem.
- This lack of confidence in the future leads to under-saving for retirement.
People also often spend too much in the early years of retirement.
- Whereas those close to the end of their lives become reluctant to spend.
These miscalculations are more significant given the (rightful) decline in sales of annuities.
Payback for QE

Merryn warned that payback for QE is looming, and that it will be pricey.
- She began with the interesting fact that 70 years ago a Bic pen cost a week’s wages for a secretary.
- Now they are 50p each (0.3% of a week’s wages).
She moved on to a poll of the managers of central bank asset portfolios (which now total $8.5 trn).
- These guys are worried that asset prices will fall as loose monetary policy is finally reversed and interest rates go up.
There’s not much doubt that QE pushed up asset prices in the first place.
- Under QE, Central banks buy bonds, pushing up the prices of bonds.
- And the sellers of bonds buy other assets, pusing their prices up in turn.
The Bank of England estimates that UK house prices were 22% higher in 2014 that they would have been without QE.
- And equity prices were 25% higher.
Merryn points out that equities were very cheap in 2009 and it is difficult to untangle the effect of this low starting point from that of QE.
- But plotting the S&P against (US) QE phases suggests that it had some impact.

So we can expect short-term asset price falls when QE ends.
But Merryn quotes the Barclays Equity Gilt study as evidence that we should stick with the stock market:
- Over 118 years UK stocks have returned 5.1% pa real (after inflation).
- Gilts returned 1.3% pa and cash 0.7% pa.
US numbers are similar (6.7%, 2.6%, 0.4%).
- So stick with stocks.
Redwood and Trump
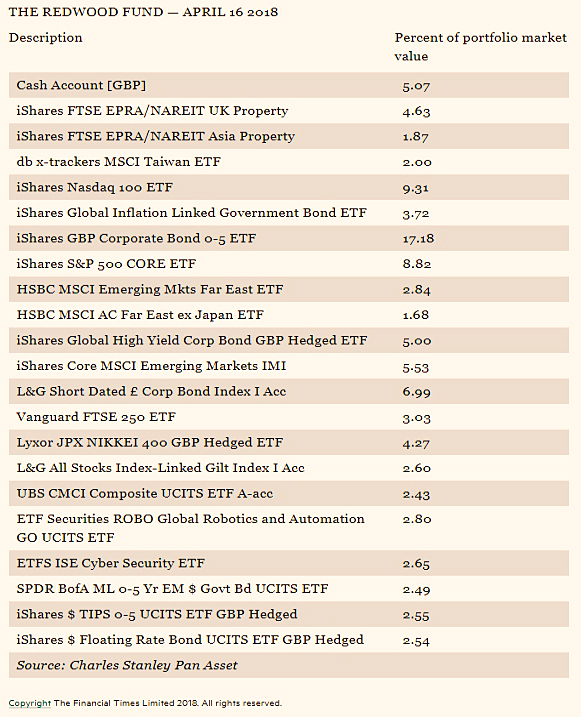
John Redwood had another update on the portfolio he runs for the FT.
- This time he looked at the impact of Trump on the markets.
John thinks that fears of a trade war and government hostility to tech firms are behind recent market falls.
- He doesn’t think that Trump will start an all-out trade war, so he’s comfortable hanging on to most of his stocks.
John has brought the equity allocation of the fund down from 51% to 42% and added more sort-dated bonds and cash.
- There’s also 9% in property and commodities.
The portfolio is down 2% YTD, compared with a fall of 5% for global equities.
Happiness
Tim Harford’s column was about perceptions of happiness.
- Despite that obvious progress that the world is making along multiple dimensions, many people don’t see things that way.
Two-thirds of US citizens believe that the proportion of people around the globe living in poverty has doubled over the past 20 years.
- In truth, it has halved.
Most people also overestimate the amount of crime and teenage pregnancy, and the size of the Muslim population in the country in which they live.
- Tim blames tabloid newspapers.
There’s also a tendency for people to be worried about their country as a whole, but not the bit of it in which they live (Max Roser calls this “local optimism and national pessimism”).
The same thing happens with personal happiness:
- 92% of UK citizens are “rather happy” or “very happy”,
- but we think that less than half of the total population are happy.
The only global issue where people are not too pessimistic is the one where the news is already bad – global warming.
- At the national level, people are too optimistic about obesity and income inequality.
- The UK is a notable exception here, as income inequality has not actually worsened.
And at the personal level, people are too optimistic that they will have a better life in the future (in five years time).
- Since satisfaction levels are already high, they are not likely to improve (unless you are already quite old).
Tim blames the media for all this, and wants people to take more of an interest in the world as it really is.
- Hear, hear to that, though as usual I won’t hold my breath
I also I suspect that Tim is motivated largely by some recent voting patterns (Brexit, Trump) that he doesn’t like.
The bond market
John Authers wrote about the message from the US bond market.
- Bond markets set the price of money (interest rates) for lenders and borrowers, and can famously “intimidate everybody”.
Usually they send clear signals about the economy, but as the US tries to end QE bond purchases, the signals have become contradictory.
- The 2-year US Treasury yield has increased from 1.26% in September 2017 to 2.44% now.
- This is the highest yield in a decade.
So the market expects more rate rises from the Fed.
- Fed rate rises usually mean that there are inflation worries, and indeed, US core inflation is now above 2%.
- The 10-year implied inflation rate (derived by comparing index-linked and fixed bonds) is now 2.2%.
This rising inflation expectation should make long (10-year) bonds worth less, pushing up their yields, too.
- But the 10-year yield has recently stalled below 3% pa (it actually broke through this week).
This means that the yield curve is very flat (returns from long bonds are more uncertain and so yields should normally be higher).
- A flat curve implies low growth and inflation, rather than the increasing inflation indicated by yield rises at the short end of the curve.
- Sub 3% on the 10-year with implied inflation at 2.2% gives growth of only 0.8%.
An inverted yield curve usually indicates a forthcoming recession.
Derivatives markets indicate that after rate rises this year, the Fed will stop, and then make cuts within three years.
It could be that higher US yields (the US was first to halt QE) mean that international buyers are pushing down 10-year yields.
- Or maybe this week’s move through 3% will be decisive.
Or perhaps QE has broken the yield curve indicator entirely.
Foreign and Colonial
In the Economist, Buttonwood noted the 150th birthday of the Foreign and Colonial investment trust.
- It’s returned 8.1% pa over that period, and now has more than £4 bn under management.
- It has also increased its dividend for 47 years in a row, and has an annual charge of 0.37%.
It was a bond fund initially, only adopting equities in the 1920s.
- More recently, private equity has been added.
It was the first trust to introduce a monthly savings scheme, and the first to advertise.
In a sign of the times, the trust has now had to drop “Colonial” (seen as offensive) from its name, and rebrand as F&C.
Coco bonds
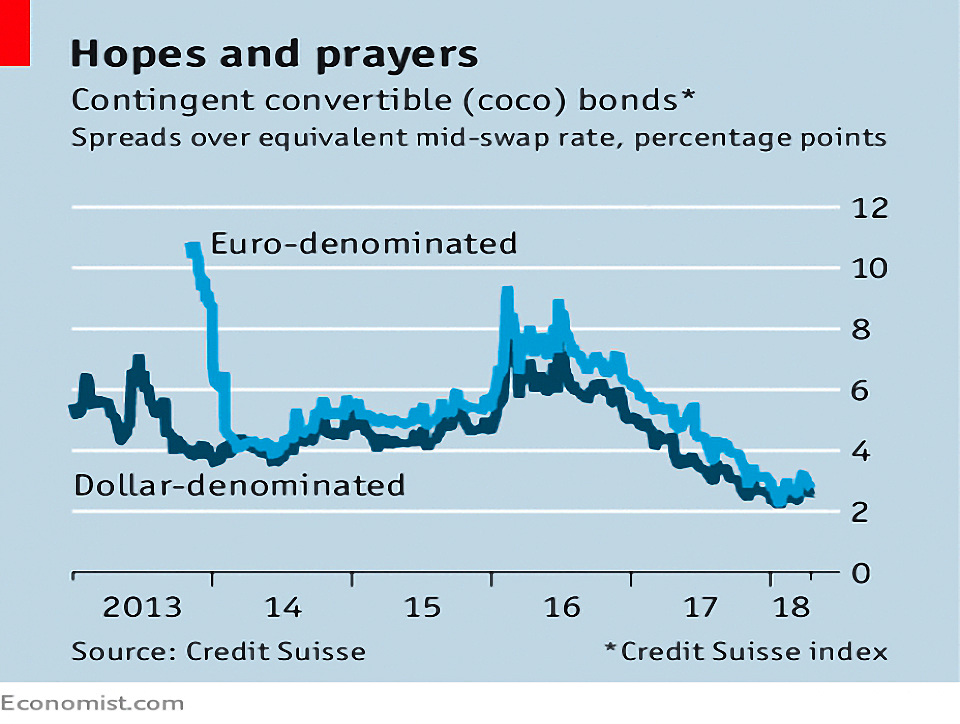
The Economist also reported that CoCo bonds haven’t caught on with banks as much as was hoped.
- Contingent Convertible bonds turn into equity when the bank has less than an agreed ratio of equity to risk-weighted assets.
- Originally 5.125% was seen as the danger point, but it can be up to 7%.
The idea was to avoid future bailouts of banks by taxpayers.
- Regulators – particularly in the UK and Switzerland – were understandably keen (at first).
But only $155 bn of CoCos were issued in 2017, out of more than $1 trn in bank debt.
- This is partly because US banks can’t issue them – they use preferred equity instead.
- It’s also because regulators won’t accept CoCos as part of the “surcharge” on the largest banks.
Without regulatory support, the banks who are most likely to need them are also the least likely to be able to issue (sell) them.
- What seemed like a good idea nine years ago has pretty much fizzled out.
Flat tax relief
A new report from the Royal Society of Arts (the RSA) called “Venturing to Retire” has proposed flat rate tax relief of 30%, instead of the marginal rate relief.
- I can see where they are coming from, but I’m not sure this would be enough to make 20% taxpayers contribute more.
I think that the young in particular are more worried about locking their money away for a long and uncertain (in the context of rising retirement ages) period.
- Increasing workplace auto-enrolment contribution levels – and perhaps making them compulsory – would be a better way to go.
Moving to 30% relief would not only dis-incentivise 40% taxpayers, it would also make pension contributions cash-flow negative for these individuals.
The report also called for auto-enrolment for the self-employed, and for CDC pensions (which I don’t like).
Falling figures
There were a couple of interesting figures published last week:
- Inflation (CPI) dropped from 2.7% pa in February to 2.5% in March.
- CPI-H is down to 2.3%.
- It looks like the post-Brexit inflation boost from the drop in sterling has worked its way through the figures.
- With wages now rising at 2.7% annualised, real wages are going up.
- But as we mentioned last week, rises in auto-enrolment pension contributions may mean that take home pay goes down for many.
- Lower inflation means that the predicted BoE rate rise in May might not happen.
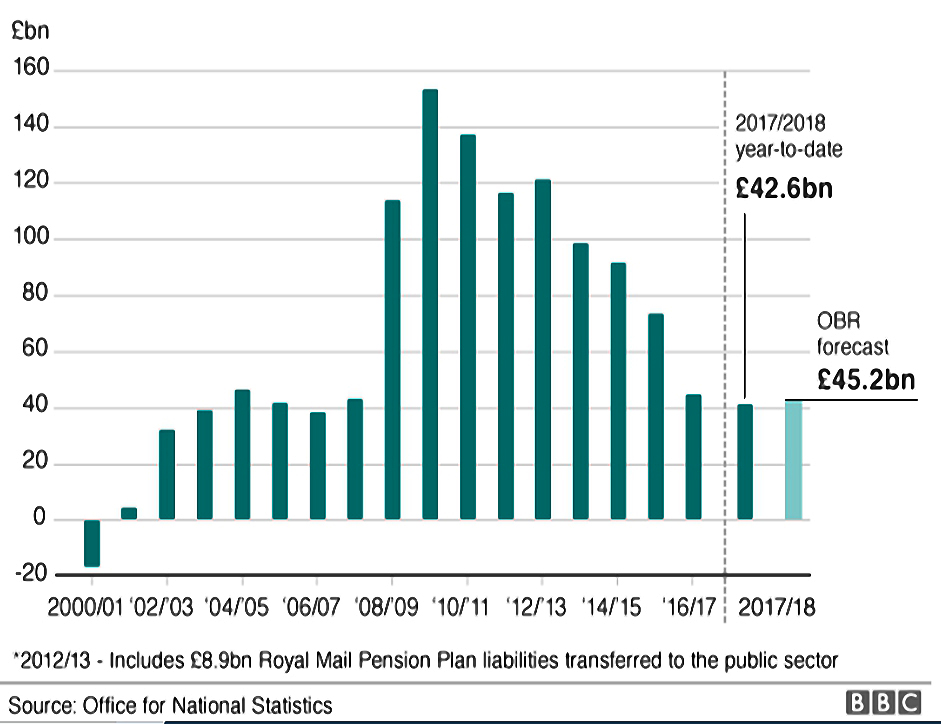
- Government borrowing has fallen to its lowest level for 11 years.
- Borrowing fell by £3.5 bn to £42.6 bn – lower than the OBR Budget forecast of £45.2 bn.
- Borrowing is now 2.1% of GDP, compared to more than 10% in 2010.
- This is good news, but spending cuts are responsible as much as growth.
- The debt continues to rise in percentage terms (now up to 86.3% of GDP, from 85.3%.
- The cash debt is £1.798 trn.
Twitter pics
I have four for you this week.
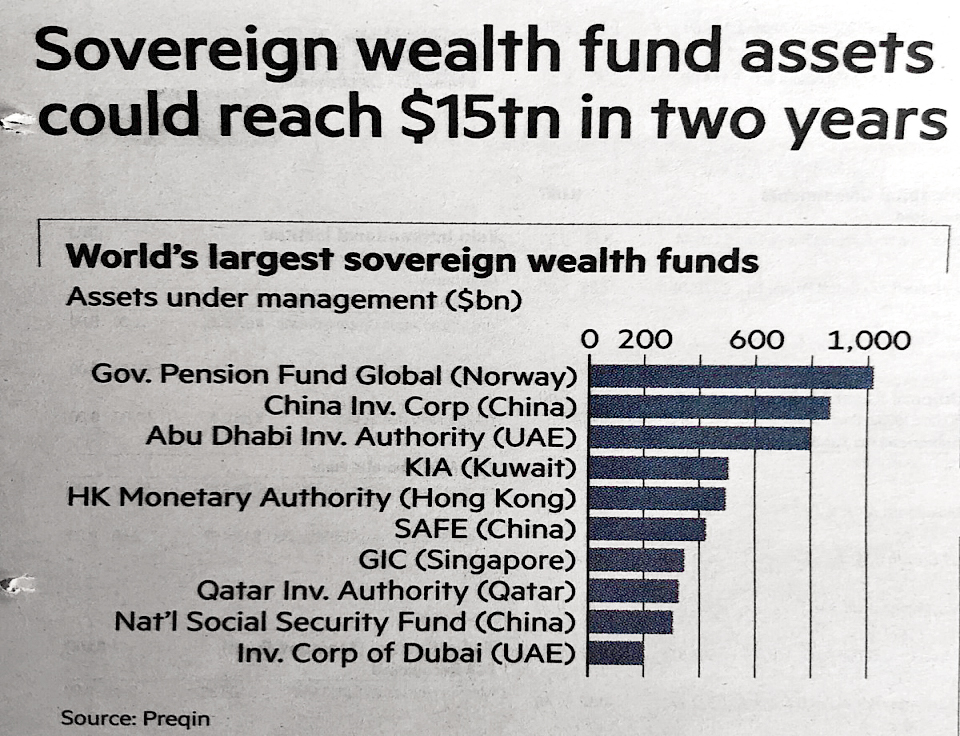
The first is a list of the largest sovereign wealth funds.
- Conspicuous by its absence is a UK fund.
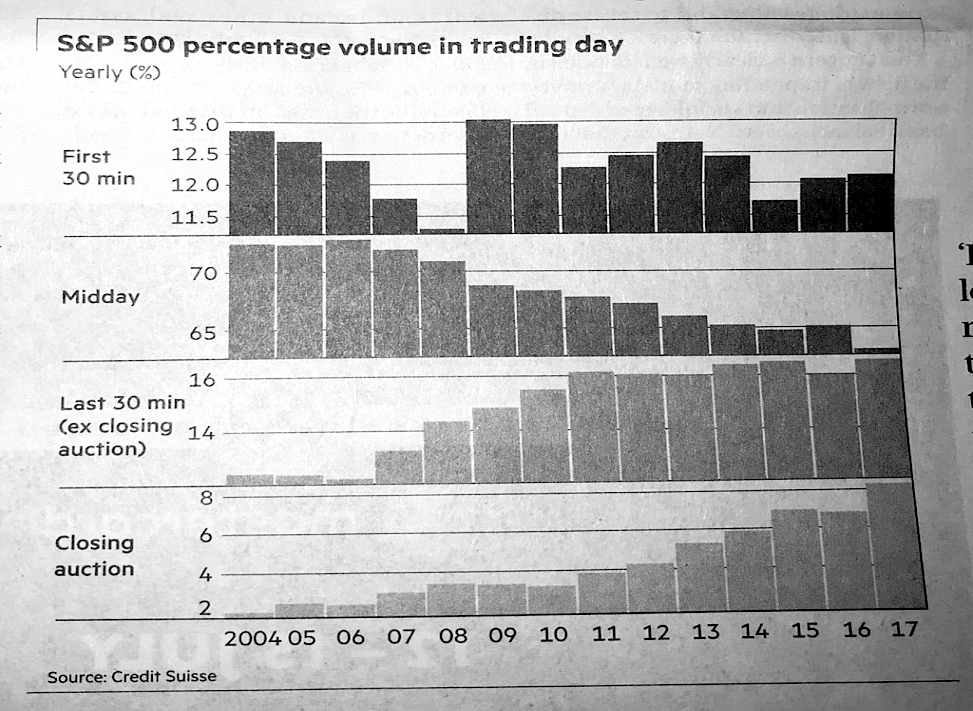
The second shows trading volumes in the S&P 500 by time of day.
- There’s not much going on in the middle of the day anymore.
The third and fourth are a matched pair that back up what Tim Harford said earlier about the world getting better.
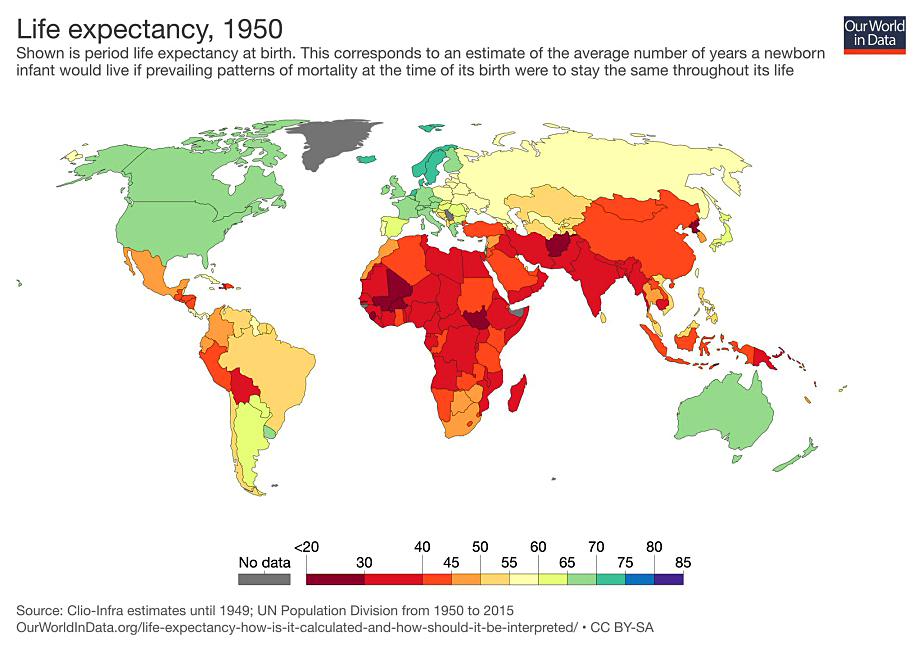
Here’s life expectancy by nation in 1950.
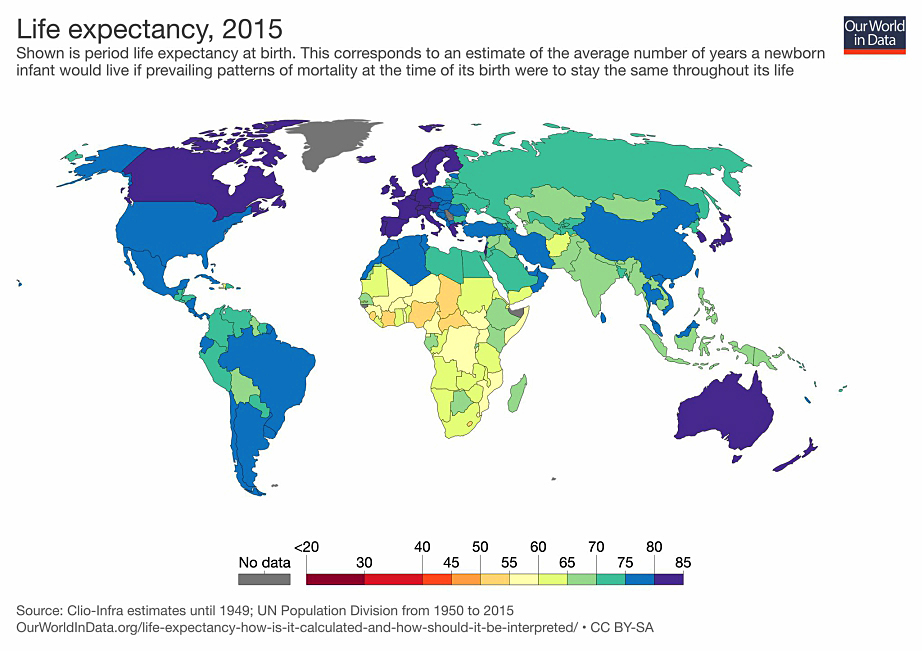
And here it is again in 2015, after some tremendous improvements.
Until next time.
Mike Rawson
Mike is the owner of 7 Circles, and a private investor living in London. He has been managing his own money for 40 years, with some success.