Weekly Roundup, 7th April 2015

We begin today’s Weekly Roundup in the FT, with the highlights page from the Investors Chronicle, a sister publication.
Contents
Election jitters or not?

After what seems like years, the official General Election campaign has begun. Chris Dillow was on hand to reassure us that elections have little effect on the FTSE 100 index. Chris looked at the six campaigns since the index was created and found that average volatility was lower than normal, both as standard deviation of returns or average price change. Overall returns were impacted, but largely because of a single negative campaign in 2010.
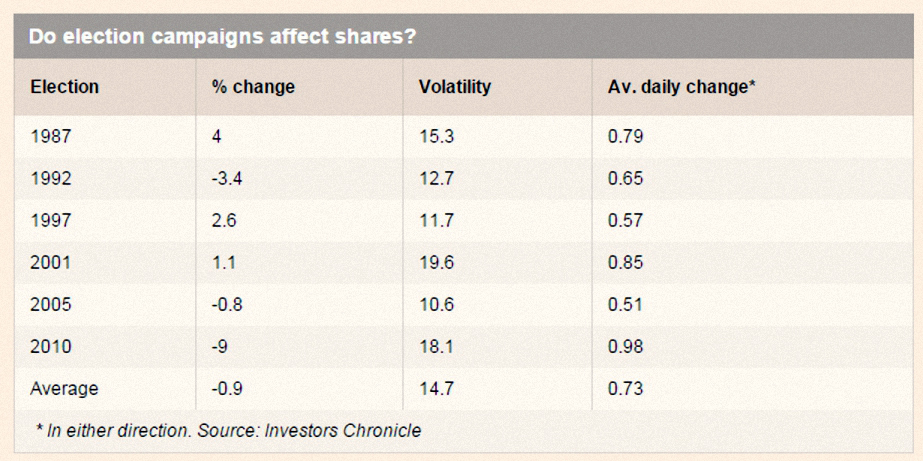
This may not be co-incidence – 2010 and 1992 were the only elections where the result was in doubt (as it is again this year). Chris found that the falls during those campaigns were larger than on the S&P 500. He also quoted US research which found that policy uncertainty in the UK was correlated with lower share prices. So this year we may well have to worry even before the result is in.
US corporate profits
![]()
Over in the Economist, Buttonwood fretted about the trend in US corporate profits.
First-quarter predictions of US GDP are down (as they were in 2014), hit by cold weather and a reduction in oil drilling. If growth does falter, with inflation already close to zero, the threatened interest rate rise planned for the summer would have to be delayed again. Against this the unemployment rate is now at 5.5% and any further reductions should lead to upward pressure on wages.
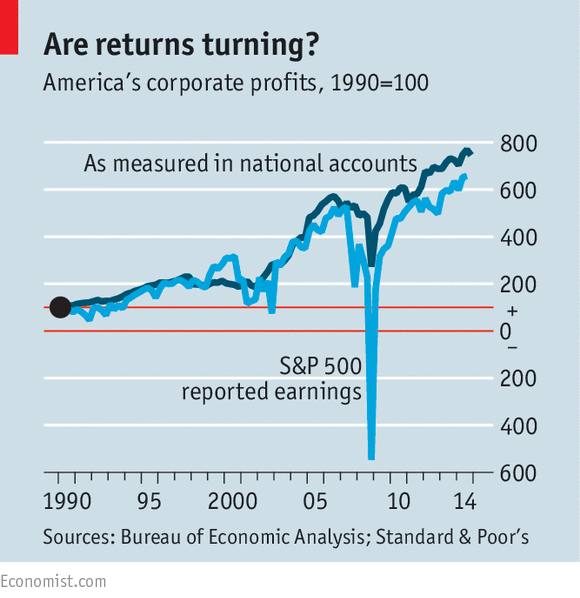
Investors could be relatively optimistic about either scenario, were it not for US corporate profits. These are running at a post-war high as a share of GDP, but fell in 4Q14. The multinationals of the S&P 500 fared much better, with profits growing at an annualised 7.8% (helped by share buy-backs). The outlook for 1Q15 is much worse. The strong dollar will reduce foreign earnings, the energy sector has been badly hit by the collapsing oil price, and most foreign and developing economies are also slowing. ((As evidenced by the continued monetary easing by central banks around the world))
The Schiller CAPE for the US market is now at 27.9, compared to the long-term average of 16.6. A collapse in corporate earnings could have consequences.
Booming art market

The art market is booming. A painting by Gauguin (pictured) recently sold for $300M, a new record. A few days later a painting by Richter broke the record for a living European artist (£30M) Total sales were $68bn in 2014, just above the 2007 peak.
But it’s a thin market: 0.5% of transactions were responsible for 50% of the value of the market. Works over €200K have been growing particularly quickly in recent years.
The attractions of art as an asset class are obvious: it’s portable, real and offers an inflation hedge. It should also correlate poorly with local equities, except for in times of global crisis. But it’s also expensive to store and maintain, produces no income and comes with high transaction costs (4%).
More importantly, for those of us with less than €200K to invest, there are no ETFs or index funds to buy.
Asset class returns
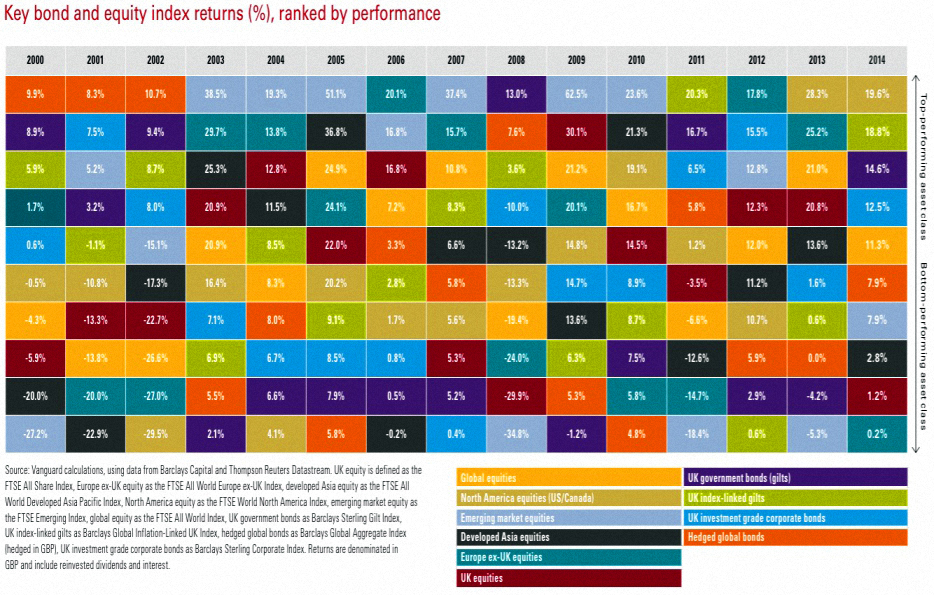
Monevator posted about the variability of asset class returns. The table above ranks asset classes from top to bottom each year based on their returns for the twelve months.
Ten asset classes are used and the data covers the past 15 years. The assets are colour-coded to highlight the variability of returns. ((More accurately the variability of ranks between assets from year to year)) It’s easy to see that an asset that comes top one year can be at the bottom a couple of years later.
The table is produced annually by Vanguard as part of their pitch against market timing and in favour of passive investing. I still think there’s a place for active investing, but the table is a convincing argument in favour of wide diversification.
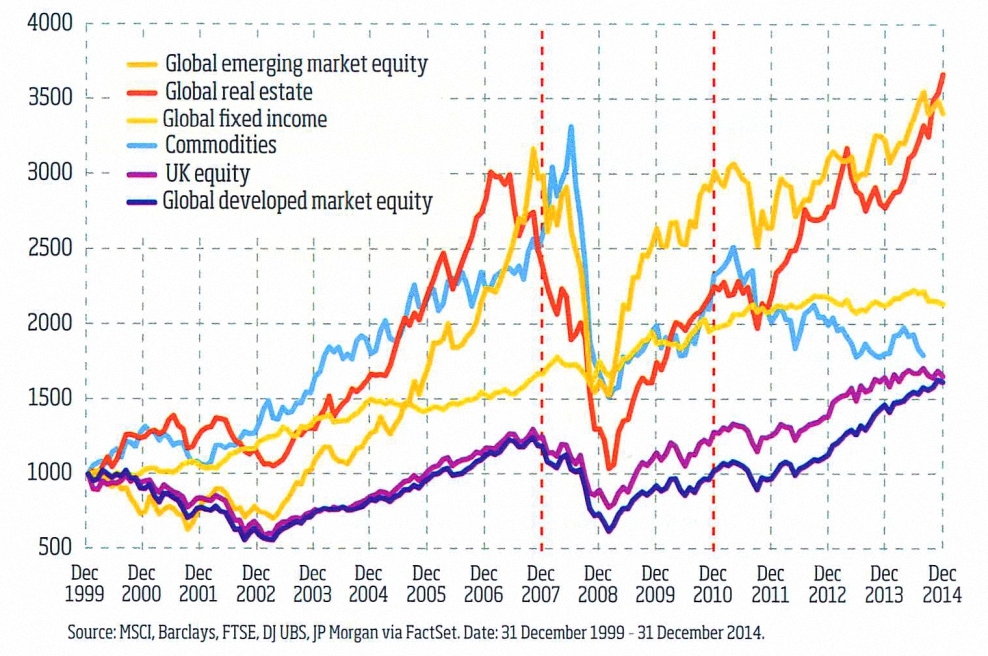
An alternative and probably more useful way of looking at the same data came through my letterbox this week as part of the marketing bumph for a multi-asset income fund from Franklin Templeton. This chart shows cumulative returns by asset class over the same time frame.
Emerging markets and property are the big winners over the past 15 years, with fixed income doing much better than usual. Investors who stuck only to UK or developed market equity would have ended up disappointed.
The other interesting point is how diversification fails just when it’s needed most – everything fell during the global crisis in 2008. In general, there is more correlation between assets than you might expect.
Sovereign wealth funds
It’s been another quiet week around Easter, with much of the focus in the financial media on the election. So there is room for one more piece which appeared on the MoneyWeek blog a couple of weeks ago.

John Stepek wrote about the wall of sovereign wealth money that has entered the equity markets since the 2008 crash. Sovereign wealth funds (SWFs) are national savings accounts built up usually by resource rich countries during the good times. ((The UK of course squandered the North Sea Oil revenues instead of following the course set by Norway))
John wondered if the oil price crash might be a turning point for SWFs, which currently have $7.1trn in assets. The biggest fund is Norway’s at $850bn (it owns more than 1% of the world’s equity markets and almost 1% of global bond markets). But of the $7.1trn total, about $4.3trn comes from oil and gas. This could be the first year that the Norway fund has money taken out of it. ((The fund was only founded in 1990))
It also sounds a little fanciful to me. These are long-term funds and a couple of years of low oil prices shouldn’t have much impact. Besides, as John points out, it’s the wall of money from central bank QE that has been propping up the market. When QE ends and interest rates finally rise, the impact on markets will be much more difficult to predict.
Until next time.
Mike Rawson
Mike is the owner of 7 Circles, and a private investor living in London.
He has been managing his own money for 40 years, with some success.