Weekly Roundup, 9th May 2017

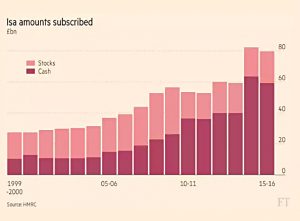
We begin today’s Weekly Roundup in the FT, with the The Chart That Tells A Story. This week it was about ISAs.
Contents
ISAs – cash vs stocks
Claer Barrett reported on data from HMRC that shows that Brits still prefer cash ISAs to stocks, even though this virtually guarantees that they will lose money in the long run.
- 80% of the 12.7M ISA savers during 2015-16 opted for cash
- £80 bn was invested in total, of which £21 bn went into stocks
With interest rates at record lows and inflation on the rise, this is surprising to say the least.
- Royal London reckons that cash ISA savers have lost out to the tune of £100 bn over the last ten years
The victims are mostly those on lower incomes and millennials, and particularly the under-25s.
Bank of Mum and Dad
The most popular story last week was the increasing influence of the Bank of Mum and Dad (Bomad), and I’m going to look at three articles on the subject.
Judith Evans covered the basic data:
- 34% of first-time buyers needed family help in 2013-14 (the most recent year for which a detailed breakdown is available).
- This allowed them to buy 2.6 years earlier (or 4.6years earlier in London).
- The helped buyers have lower incomes (£3.3K less) and buy houses that are £20K cheaper than average.
Seven years earlier the proportion helped was 20%.
- The projection for 2019 is 40% of first-timers.
- On top of this, another 9.6% of buyers had help from an inheritance.
On his NotAYesManEconomics blog, Shaun Richards explained how Bomad feeds house prices.
- Bomad explains the gap between house prices (up from £190K pre-credit crunch to £218K today) and real wages (still 3% lower than before the credit crunch).
The £6.5 bn loaned by Bomad in 2017 will make it the 9th biggest mortgage lender.
- The average loan is now £22K and 79% of the total goes to people under 30.
- 25% of property transactions now involve Bomad.
Shaun worries that this, coupled with a loosening of lending multiples once more, is leading to a ponzi scheme in UK property.
- Helped by parents, young people buy ever-more expensive houses, and because of stagnant real wages, they need ever more help.
Merryn made the sensible (and obvious) point that old people should be a lot richer than young ones.
- 50% of those between 55 and 65 (( My age group )) have £500K or more, compared to only 12% of those aged 25 to 35.
The is because we have had the time to:
- develop superior, high-earning skills
- pay off debts that were shrunk by inflation
- save, and have our investments grow and compound
- inherit money
Merryn points out that even a flat wage across the workforce would lead to the old being richer.
For Merryn, Bomad is part of the inevitable cascade of wealth down the generations, rather than a problem.
- But she would rather that house prices came down.
She thinks this would make no difference to old people, but she’s wrong about that.
Inequality
In the Guardian, Branko Milanovic wrote about why this inequality matters.
- Branko is one of the leading experts on inequality, so he gets asked this question a lot.
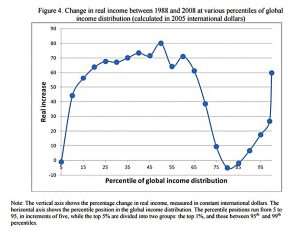
He’s responsible for the “elephant chart” which showed that working-class people in the rich world didn’t benefit from globalisation:
On a technical note, Branko sees the current interest in inequality as part of a general growth in interest in heterogeneity.
- People used to be content to look at averages, but now they want to understand how all sections of society are affected by something.
But briefly, he sees extreme inequality as a threat to democracy.
It should be said that Branko doesn’t believe that everyone should have the same income and wealth, since effort and luck will vary.
- Others would argue that inequality is justified by the improvement it has produced in the lot of the poorest.
- Or that so long as the rules of the game are applied correctly, the outcome is fair.
Total equality (as per communist economies) will stunt incentives to study, work hard and take risks.
- Extreme inequality means that those born rich stay at the top regardless of whether they work, study or take risks (he sees Latin America as a good example of this).
Car leasing
There were a couple of interesting articles about car leasing last week. First up was Tim Harford, who looked at the traps in consumer finance.
In the UK, Personal Contract Purchase Agreements (PCPs) now account for 80% of new car sales.
- Somehow, PCPs make buying a new BMW or Mercedes look cheaper than buying a second-hand Ford.
Tim likens it to buying and selling a series of homes using interest-only mortgages:
- a quasi lease / hire-purchase scheme is rolled over into another one, without you ever buying a car.
He thinks that the contracts – with many variables such as “contract length, the guaranteed value of the returned car, the deposit, purchase price of the car itself, maintenance contract tie-ins, mileage
allowances, and (of course) the interest rate” – are too complex for consumers.
Tim quotes the work of George Akerlof and Robert Shiller in Phishing for Phools:
- consumer finance shifts purchasing power over time, across risky outcomes
- people will pay exorbitant prices to postpone costs and eliminate small risks
Payday loans, credit cards and extended warranties are all examples.
- Many finance contracts (PCP, mobile phone contracts, car-hire insurance) are bundled with another purchase, making them even harder to evaluate.
Richard Thaler and Cass Sunstein have proposed that contracts should be computer-readable, so that consumers can use third-party websites to compare them.
- Sounds like more meerkats to me.
The Economist reported that although authorities in the US and the UK are worried about car finance, the comparisons to the subprime financial crisis are overblown.
New car sales reached record levels in both countries last year (17.5M and 2.7M cars respectively).
- The UK also set a record for second-hand car sales.
But loans also set records – $565 bn and £32 bn respectively.
- And subprime borrowers have been able to find loans.
In America, the worries are about sub-prime asset-backed securities (ABSs) based on car loans.
- Net losses on these are 6% in 15 months, the highest since 2008.
Sub-prime is a bigger proportion of the car finance market than it was of mortgages (21% compared with 14%).
- But the 2006 mortgage market was $2.8 trn, five times larger than the current car loan market.
- And only 20% of car loans have been securitised, compared to 75% of subprime mortgages.
So the exposure is less than a tenth of the size.
In Britain, subprime car loans are only 3% of the market, so the comparison is even more stretched.
- And there has been no rise in defaults.
The worst we should expect is a slump in the second-hand market as PCP borrowers return their cars after three years.
We have more to worry about from wider consumer borrowing, which grew by 11% in the year to November 20216.
Long bonds
The newspaper also reported that the US Treasury is thinking about issuing 40-year, 50-year or even 100-year bonds.
- The US national debt is $14 trn, around 75% of GDP.
- Interest payments are now $280 bn a year, three times the combined Education, Labour and Commerce department budgets.
Some argue that to reduce the bill, the US should issue some long dated paper while interest rates are still low.
Britain, Canada and Italy have recently issued 50-year debt.
- Belgium and Ireland have gone for 100 years.
But although long-term rates are low, short-term rates are even lower.
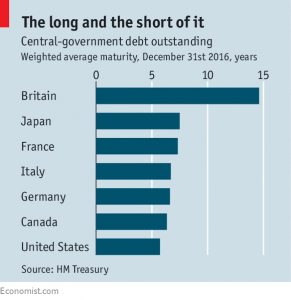
- The weighted average maturity (WAM) of UT Treasuries is 5.7 years
- The effective interest rate average is 2.03%
Since the 30-year Treasury yields 3%, longer maturities will cost more, and push up the immediate interest bill.
- They might work out in the long run, if future short-term rates exceed current long-term ones.
- But this is not inevitable, and demand for ultra-long maturities is uncertain.
Britain has a flatter bond yield curve, so the odds are more in our favour.
- Our WAM is now 14.9 years.
Bullish and skittish
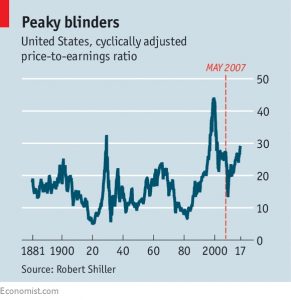
Buttonwood described investors as “both bullish and skittish about share prices“.
Ten years ago, investors hoped that the US housing market crash wouldn’t impact the stock market.
- The CAPE stood at 27.6, which turned out to be the peak.
- By March 2009, the CAPE was down by more than 50%.
The S&P 500 is now more than 50% higher than it was in 2007, and the CAPE has risen to 29.2
- The long-term average is 16.7, but the average for the last 30 years is 24.5
Profits relative to sales and GDP have been much higher since 1996 (( Leading to a lower share of GDP for labour, and discontent about globalisation ))
- There seems to be more monopoly power at work, but interest rates are also at record lows (which means firms can use more debt).
So equities possibly look expensive, but what about the alternatives?
- in 2007, the 10-year US bond yield was 4.8% – now it is 2.3%
- and the return on cash is negative after inflation
So for stocks to crash, we need a sharp rise in interest rates, a recession, or a trade war.
- We should be good for another few months, but a shock will arrive eventually.
Investment clubs
And finally, Lucy Loewenberg in Money Week wrote about investment clubs.
There were 10,00 clubs in the UK in 2001, but after the dot com crash and the 2008 financial crisis, their number fell.
- Now they are on the rise again.
You may remember that I tried and failed to get one off the ground back in January.
- I was determined not to set the contributions so low that they didn’t matter to anyone (including me).
- As a result, I only got half-way towards my monthly target.
If anyone is interested in helping us over the finish line, you can find more details here.
Until next time.


