Expected Returns 4 – Lottery Tickets
Today’s post is the fourth in our series looking at papers by Antti Ilmanen, as a prelude to tackling his magnum opus, Expected Returns.
Contents
Last time

We’ve looked at three papers and a slide deck so far, and here’s what we’ve found:
- Investors tend to think of expected returns as a function of the asset class.
- This leads them to take on too much equity risk since diversifying assets like bonds have lower returns that would need to be juiced by leverage.
- Diversification (multiple sources of risk which have worked well over long periods) can help, but correlations are higher when things get tough (in crashes)
- There’s also insurance, but this is expensive when it is needed (because it becomes popular)
- Selling volatility gives good returns except in a crash because people over-pay for insurance.
- “Lottery tickets” – the most volatile members of an asset class (eg. small cap blue-sky growth stocks) – generally offer poor returns.
- They are over-priced because of the preference of some investors to chase outsize returns.
- Low volatility stocks outperform in absolute terms and have much better risk-adjusted volatility (a higher Sharpe ratio – SR).
- There is no reward for buying bonds longer than 5 years or riskier than BB.
- Illiquid assets (eg. venture capital, private equity) have higher returns but did badly through the 2008 crisis.
- Diversifying across investment styles may offer greater returns for less risk.
- But styles have lower volatility than stocks, and so they can’t diversify away the equity risk.
- Implementing styles properly also requires the “three dirty words in finance”—leverage, short-selling, and derivatives.
- The four key styles are:
- value
- momentum
- carry (yield – this is closely related to value for stocks)
- defensive (low risk/low beta, so equivalent to low vol) – this style can also be extended to include quality measures.
- Size and illiquidity are also relevant in some assets:
- There are risk-based and behavioural explanations of why factors work
- But choosing between these two explanations is not necessary in order to take advantage
- Leverage constraints (for some investors) may explain why low-risk works
- All styles suffer from drawdowns and periods when they don’t work
- So you should use them all in parallel.
- The composite style premia portfolio is not massively correlated to a 60/40 stock/bond portfolio.
- Value and trend may seem contradictory, but it’s a matter of timescale.
- Trend dominates for up to a year, before mean reversion sets in.
- This means that chasing multi-year returns (as many investors do, even when choosing funds) runs straight into reversal effects.
- Value and trend actually combine well together (recent winners can still be cheap), and they act as good diversifiers for each other.
- Trend-following also protects against tail risk (does well in crashes).
- Limited market timing (“time variation in return sources”) may also increase returns.
- Timing can be based on valuation measures, the macro environment and on investor risk aversion.
- But timing is risky and should, therefore, be a minority component.
- In later articles, Antti admits that contrarian rotation based on recent valuations has been hard to implement successfully in recent years. (( I personally suspect that the central-bank dominated macro environment has something to do with this ))
- Returns from long-only portfolios are falling in line with interest rates and inflation.
- Using realistic future returns pushes up minimum retirement saving rates from 8% pa (of income) to 15%.
- There are three ways to improve returns – more equities, more illiquids and/or more factor tilts and alternative risk premia.
- Typical performance evaluation windows (for funds and managers) of three to five years are likely to lead to underperformance from reversals (mean reversion).
- Investors should use three dimensions to evaluate their portfolios:
- asset classes
- strategy styles (factors) and
- risk factors (fundamental macro factors that are not directly investable)
- Long-term investors have an advantage that they can exploit through selling insurance.
- This means selling volatility via index puts.
- The problem with these strategies is that they lose money at the very worst times, and you need to be certain that you can tolerate the losses.
Skew
Today’s paper looks at whether Financial Markets Reward Buying or Selling
Insurance and Lottery Tickets
- That’s also the title of the paper, which was published in the Financial Analysts Journal in 2012.
At the core of the paper is the idea that investors like positive skew, and will overpay for it.
So let’s begin with a detour.
ERN
ERN is the guy who runs the Early Retirement Now blog.
- ERN is not his real name, but he wrote anonymously for a few years and so it became his nickname.
We’ve looked at a lot of ERN’s posts before – specifically his mammoth series on safe withdrawal rates.
ERN is one of my favourite financial bloggers, for a number of reasons:
- He looks in detail at subjects that other bloggers tend to skip over.
- He has a practical approach because he usually plans to invest his money in the strategies he is testing.
- He’s an ex-finance professional with a solid maths background.
One of the other big topics on ERNs website – which might surprise some of the SWR fans – is options trading.
- ERN has a lot of money tied up in options.
Specifically, he sells out-of-the-money short-dated put options to take advantage of other investors’ willingness to overpay for strategies with a positive skew.
- So let’s start with ERN’s article on skew.
Lottery tickets
ERN started out by wondering why people buy lottery tickets (for actual lotteries – not blue-sky stocks).
- The total payout is usually 50% or less, and each ticket has odds against winning the jackpot of millions or billions to one.
I remember somebody calculating that in the UK weekly lottery if you bought your ticket before Wednesday, you were more likely to die by the time of the Saturday draw than you were to win.
- With payouts of less than 50% and millions of tickets, your expected annual return is -100% with a volatility of hundreds of thousands of per cent.
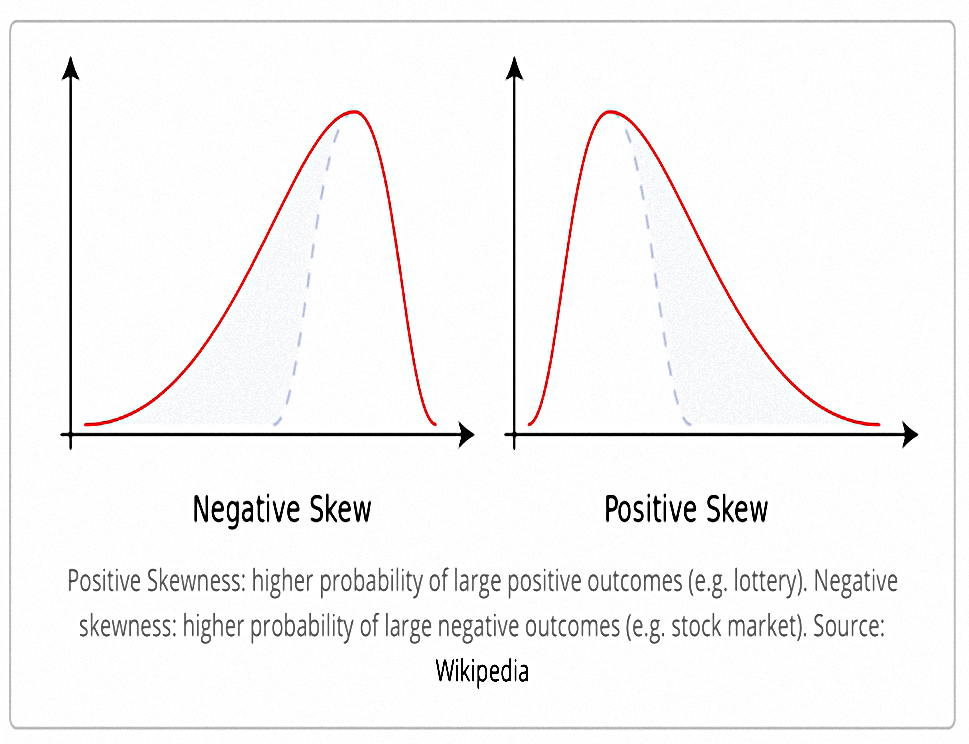
Here’s the Wikipedia diagram for skew.
- Positive skew means more chance of a large positive outcome (a lottery win).
- Your downside is capped to the price of the lottery ticket.
- Negative skew means more chance of a large negative outcome (the stock market in general).
Note that this doesn’t say anything about average (expected) returns – the stock market return is usually positive.
- Those charts don’t show where the horizontal zero is.
Options
People like positive skew for evolutionary reasons.
- For most of history, one big negative result (illness, being eaten by a tiger) was the end of you.
This means that people like to protect their downside equity risk, perhaps by buying index put options.
- Which means in turn that buying these options is expensive, and buying them consistently is a losing strategy.
Flip this around, and selling this downside protection (selling put options) is profitable.
- But this approach has four times the negative skew of the regular stock market.

ERN drew his own chart of returns versus skew, and there’s a decent trend line in there. (( He was a bit sketchy about VC and real estate ))
- He points out that puts and calls are only different because most put strategies are below the underlying price and covered calls are usually above.
- Also, individual corporate bonds can have negative skew, but government bonds and bond funds don’t.
The upside of skew
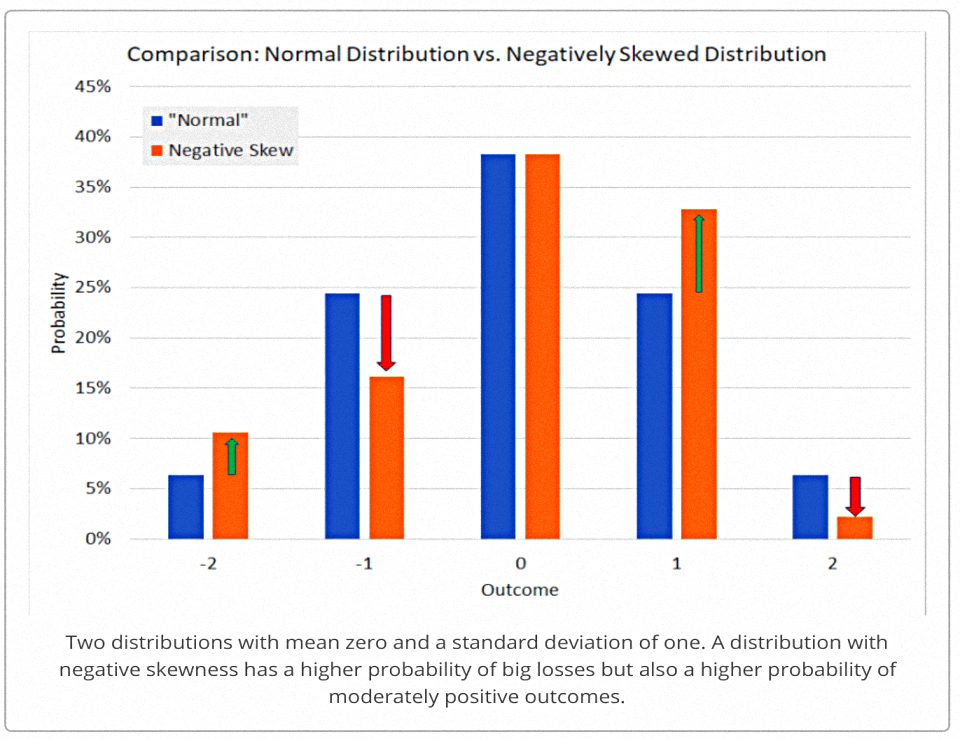
ERN has two “tricks” to convince himself that negative skew is a good thing (apart from the fact that things with negative skew often have good expected returns).
The first is that negative skew distributions have higher probabilities of positive outcomes, as shown in the chart above.
- The orange column is higher at -2, so has to be lower at -1 and +1 (otherwise the mean and variance would change).
ERN notes that 94% of his options trades are profitable, even though most of them run for less than a week.
- And 85% of daily returns are positive, which makes the occasional large loss easier to deal with.
The second is that skewness is less of a problem when you average over many trades – this is known as time diversification.
- The daily skew of ERN’s option portfolio is -5.1 (compared to minus 0.5 for the S&P 500)
- The weekly skew is -4.9
- The monthly skew is -1.9, and
- The quarterly skew is +0.1
ERN explains this is because of the Central Limit Theorem:
The average outcome from independent draws from even very non-Normal distributions (e.g. very negatively skewed distributions) will look more and more “Normal” and thus unskewed.
Antti’s paper
Back to Antti’s paper on insurance and lottery tickets. Here’s the meat of the abstract:
Selling insurance and selling lottery tickets have delivered positive long-run rewards in a wide range of investment contexts.
Conversely, buying financial catastrophe insurance and holding speculative lottery-like investments have delivered poor long-run rewards.
It’s strange that investors have a desire for both risk-reducing insurance and risk-increasing lottery tickets, and that selling each of them can, therefore, be profitable.
The primary instruments for exploiting these mispricings are options and the carry trade (in FX).
The value function
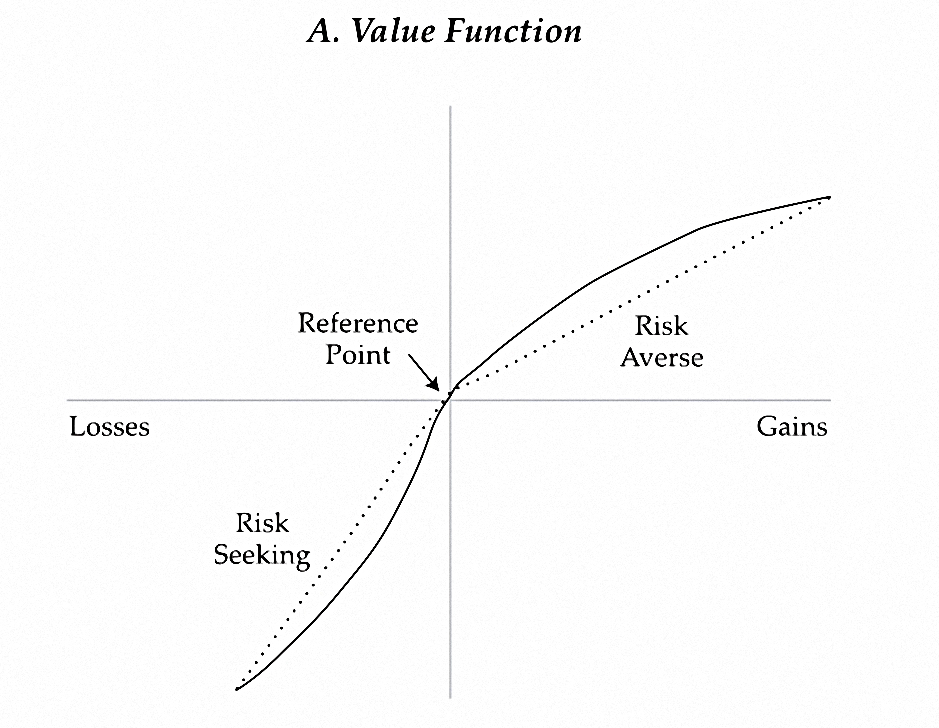
CAPM says that skewness is not priced, for two reasons:
- Investors have a symmetrical value function,
- And in any case, returns are normally distributed (not skewed).
In practice, investors in aggregate have a value function like the one in the chart.
- They are particularly keen on assets that will provide (relatively) high returns when markets are volatile – this is known as the coskewness with the market.
This implies that downside betas and variances would be more appropriate measures of risk than simple betas and variances.
Overweighting low probability events
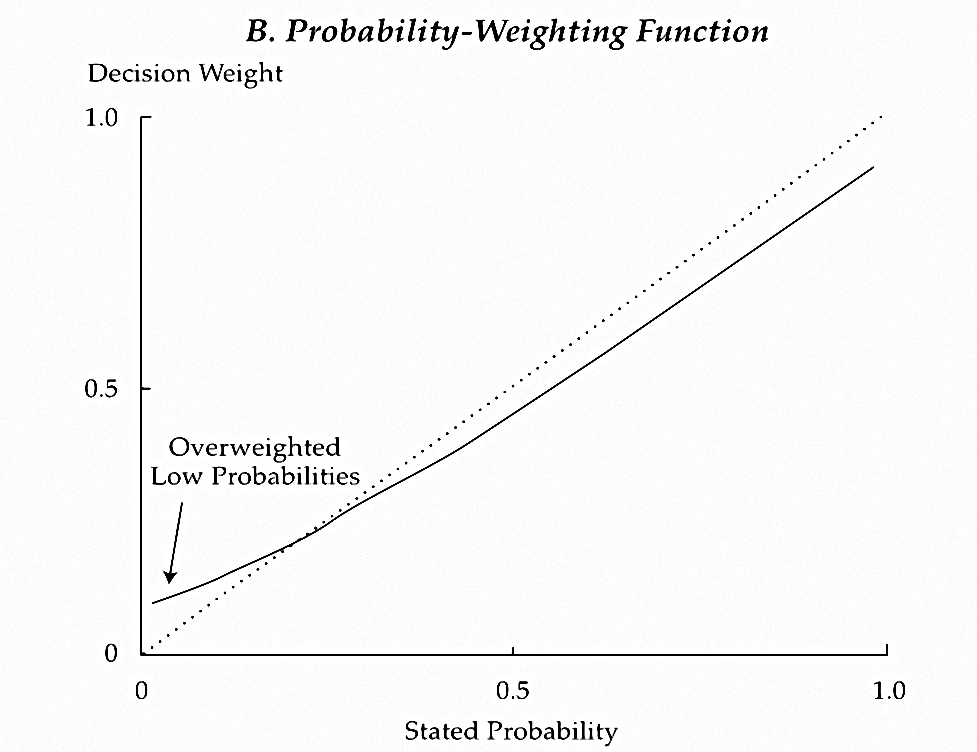
Kahneman and Tversky’s prospect theory explains the simultaneous demand for lottery tickets and insurance through the over-weighting of low-probability events.
- This means that people like large (but unlikely) payoffs and will buy tickets to win them, but dislike large (but unlikely) losses and will insure against them.
Taleb argues that people actually prefer regular small gains plus occasional large losses – they like negative skew.
- Antti says that might be true of asset managers, who can’t afford to underperform their peers.
- Overconfidence in this group is also likely to be a reason for the underpricing of black swan events, known as disaster myopia.
Other research suggests that salient (vivid/recent) low probability events are over-weighted, but non-salient unlikely events (in effect, things which are thought to be impossible, or are never even considered) are under-weighted.
- This can resolve the tension between Kahneman and Taleb.
Left tail – insurance

Implied (future) volatility is almost always higher than the realised volatility, particularly for equity indices.
- This gives an edge to put sellers and makes buying the VIX a losing (insurance) strategy.
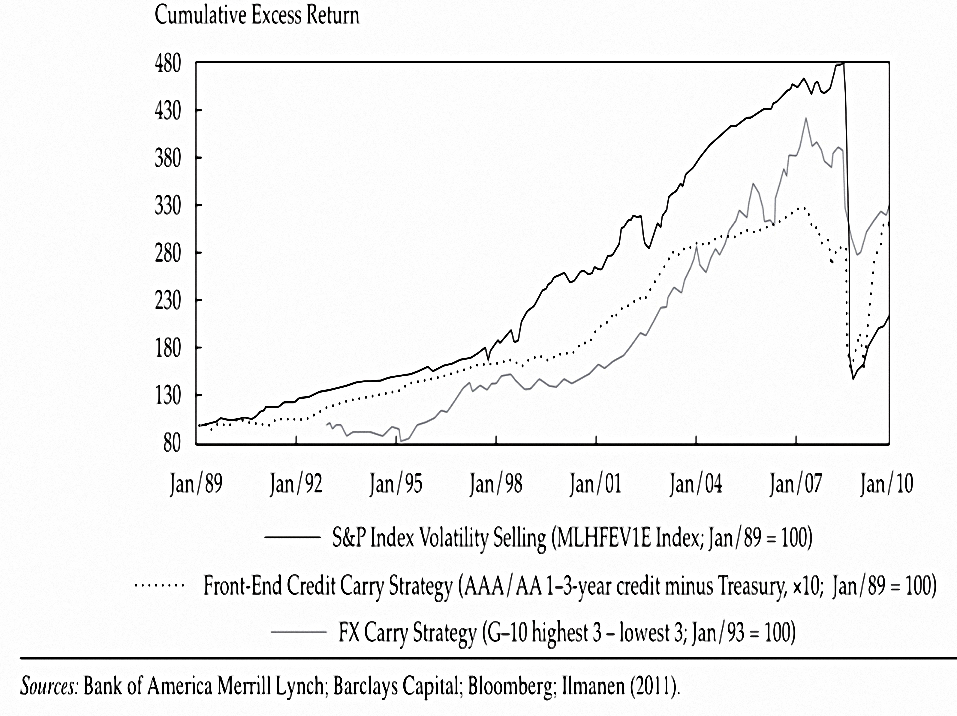
The chart above shows the performance of three catastrophe insurance-selling strategies through the 2008 crash.
Right tail – lotteries

Assets with high volatility, high skewness and/or high betas provide lower returns than their opposites.
- Small-cap growth stocks (blue sky/story stocks, mining and energy firms) and IPOs are good examples in the equity arena.
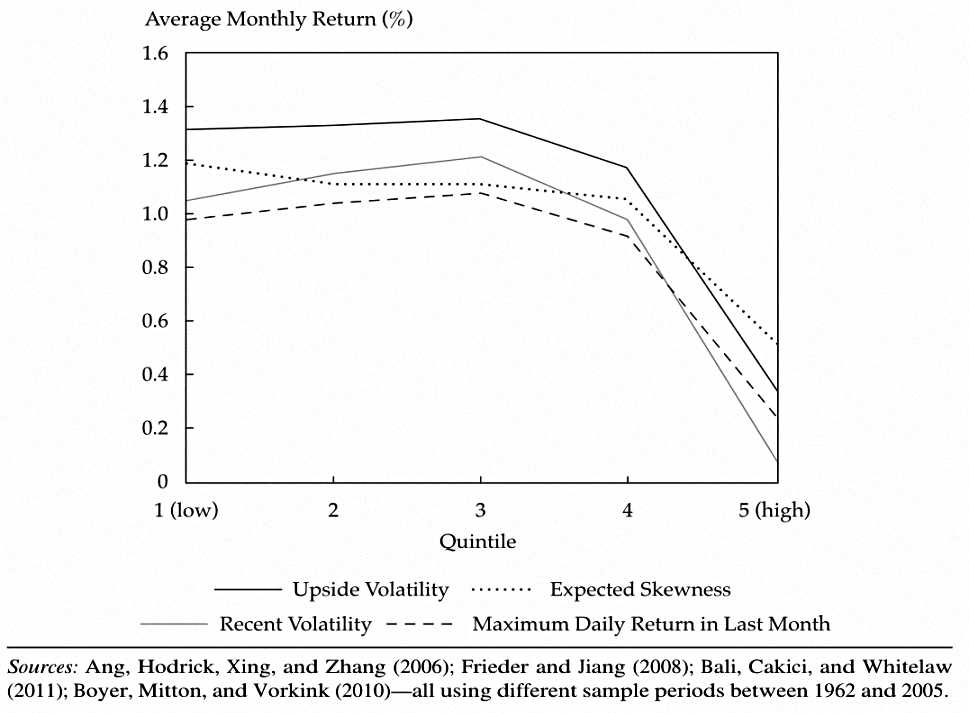
The more speculative the strategy variant, the worse the reward for risk.
This pattern has been empirically documented for subordinated distressed bonds in bankruptcy compared with senior bonds, for low-moneyness convertible bonds compared with high-moneyness bonds, for cash-financed merger arbitrage deals compared with stock-financed deals, and for the peak-peril reinsurance deals compared with a less volatile risk-balanced portfolio of deals.
The long-shot bias in racetrack betting and the popularity of casino gambling (and indeed, lotteries) are related phenomena.
As well as the lottery preference, Antti suggests that leverage-constrained investors may use riskier assets as a substitute, making them over-priced.
Timing
Antti says that timing matters:
Low-probability events are not always overweighted, and insurance is not always overpriced.
Since salience is the driver of the over-weighting, the over-pricing should be worst just after adverse events.
- He suggests a valuation-oriented timing strategy for selling insurance.
Conclusions
It’s been interesting stuff today, with two promising new avenues for investment:
- Selling insurance
- Selling lottery tickets
Implementing the first looks as though I will need to re-learn about options after a 30-year gap.
Implementing the second looks more difficult, but is probably easier if you turn it around – instead of selling lottery tickets, just avoid buying them, and weight your portfolios in the opposite direction.
- It’s only half an implementation, but as we all know, half a sixpence …
Until next time.
Mike Rawson
Mike is the owner of 7 Circles, and a private investor living in London. He has been managing his own money for 40 years, with some success.