Disparity in Risk Parity
Today’s post covers a recent paper from NISA Investment Advisors, which looks at building a framework to assess the performance of risk parity managers.
Contents
NISA
I don’t know much about NISA, and I think that this is the first note of theirs that I’ve looked at.
- The paper is called The Disparity Among Risk Parity Managers and the author is David Eichorn.
It was published in 2022.
Background
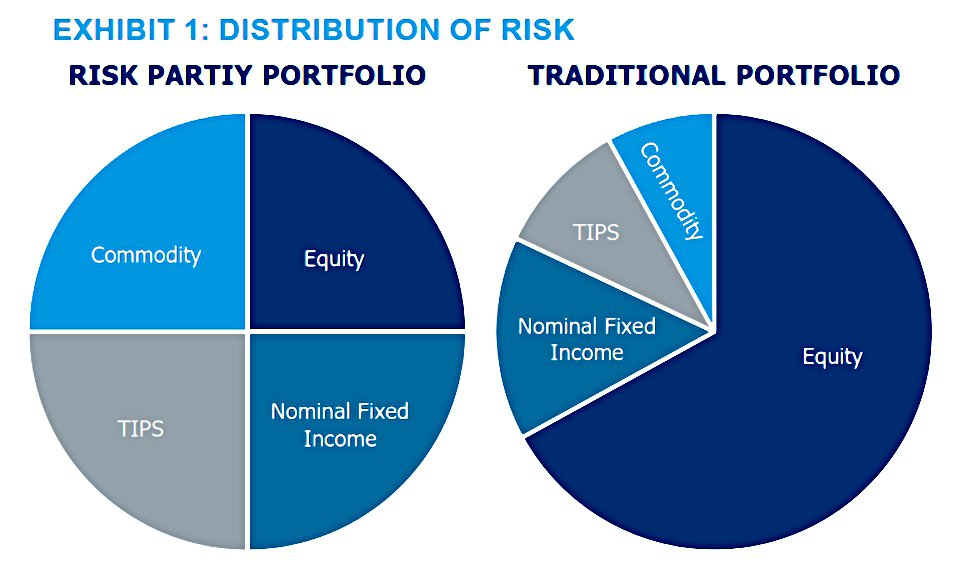
The goal of risk parity (RP) is to equally distribute the risk of the portfolio amongst the underlying asset classes.
- This is in contrast to traditional portfolios, which are typically dominated by equity risk (since equities are more volatile than other asset classes).
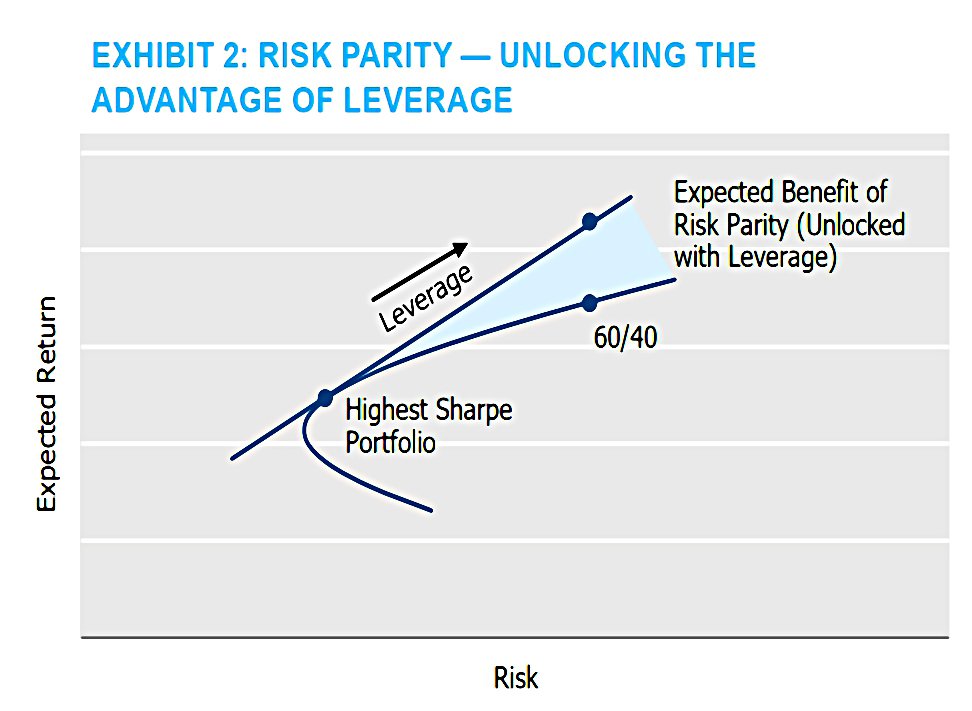
RP implicitly assumes that all asset classes have similar Sharpe Ratios (SPs) and so the optimal portfolio is an equal risk allocation.
- RP leads to a higher portfolio SP and leverage can be used to convert this to the highest return for a chosen level of risk (volatility).
Despite this, returns from RP managers show substantial dispersion.
- The paper attempts to construct a framework for benchmarking RP which will allow us to identify which (if any) managers are generating alpha, and which managers are simply returning beta.
Benchmarking
RP’s advantages over traditional portfolios lead to a benchmarking issue:
- A 60/40 portfolio would be easy to beat over the long run, so it makes a poor benchmark.
Another issue is that (depending on the lookback period used for returns, volatility and correlations), RP can be a dynamic strategy, with allocations shifting as the data evolves.
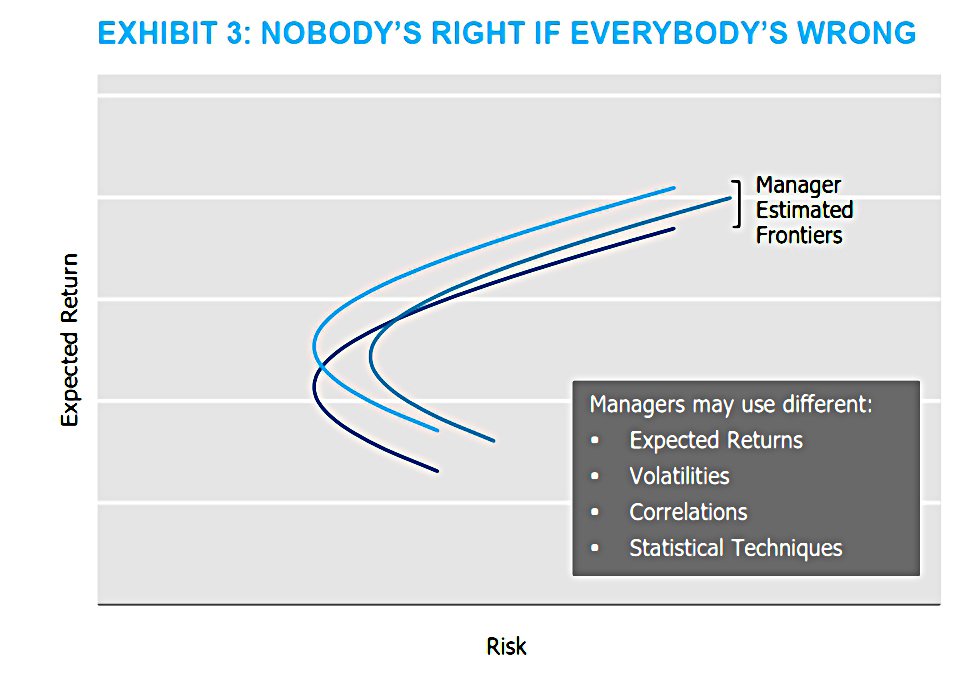
And different managers will use different assumptions and statistical techniques, leading to differing portfolios.
- In effect, each manager creates its own efficient frontier.
Replication

NISA’s approach is to estimate each manager’s holdings using data from HFR Indices.
- They use both fixed and dynamic approaches and the six asset classes shown in the table above.
Fixed weights
The fixed approach used the estimated asset exposures for each manager to work out a benchmark return.
- The lowest vol target product offered by each manager was used, and the effect of leverage was removed by subtracting one-month LIBOR.
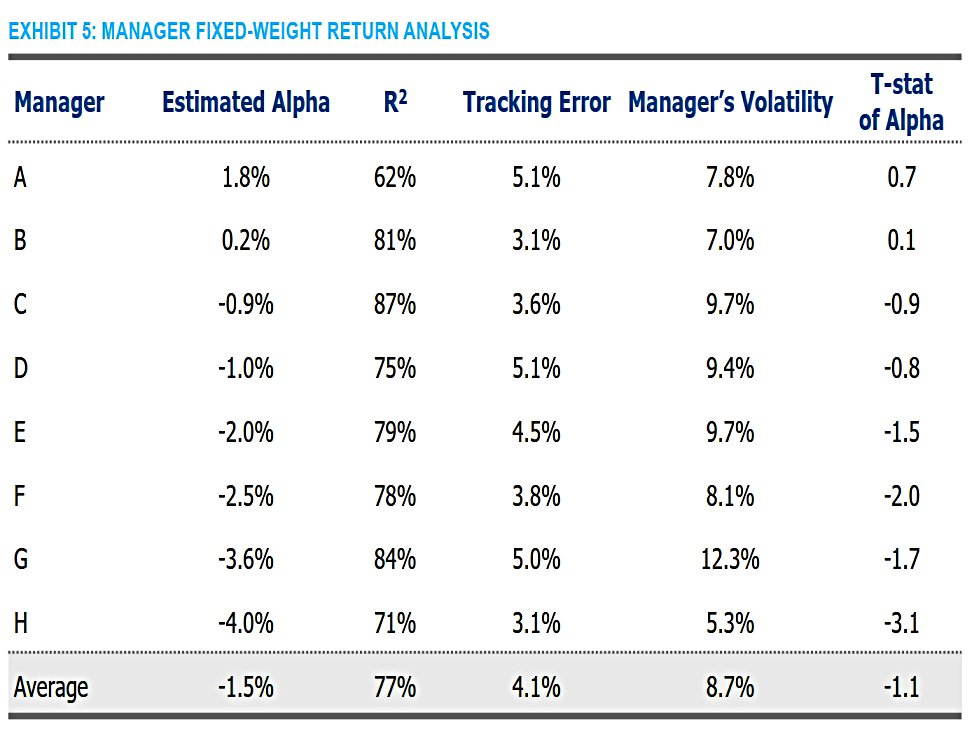
This model has an R-squared of 77%, which is pretty good.
- The average estimated alpha is -1.5%, of which fees explain 68 bps.
NISA note that the managers also undershot their target volatilities (10% apart from A, which was 15%).
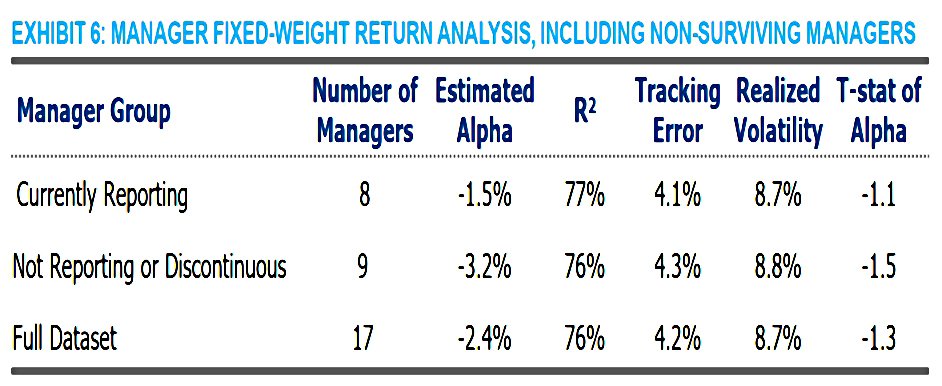
Survivorship bias was also visible, with managers that left the index showing an alpha of -3.2%.
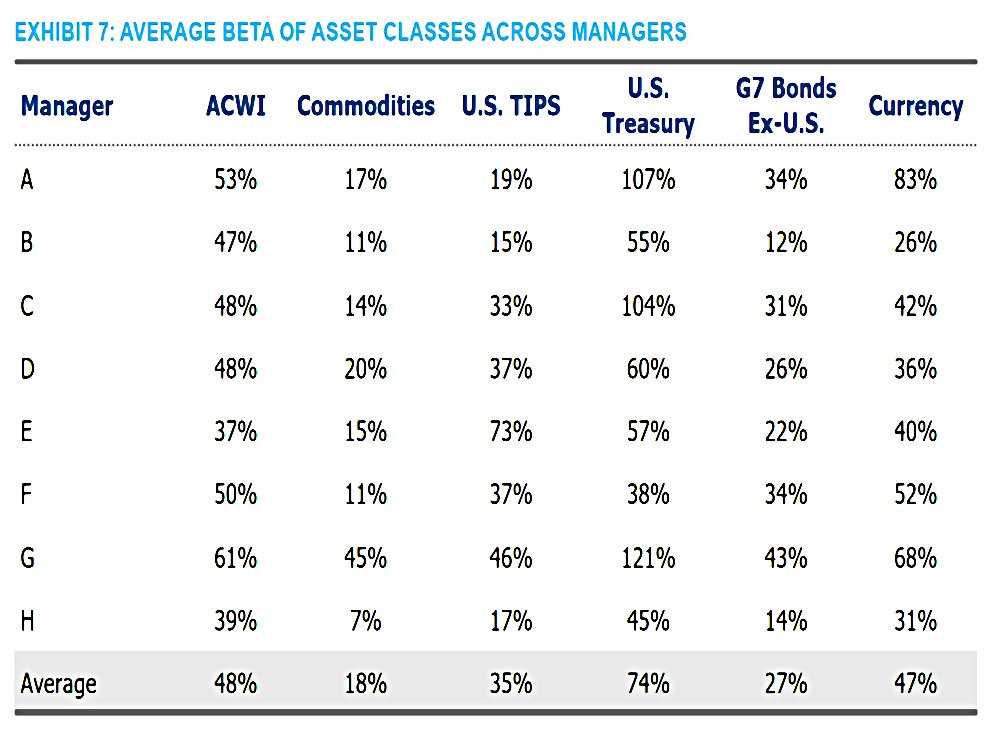
The third table shows the estimated average weights allocated to each asset class by the eight managers and the overall averages.
- Passively allocating to these weights would have outperformed the RP managers by 1.5% (before transaction costs).
Dynamic analysis
NISA accept that RP managers are unlikely to keep fixed weights.
- Their second approach uses a 24-month lookback to estimate the market betas for the following month.
Note that the dynamic approach has a slightly lower R-squared (72%).

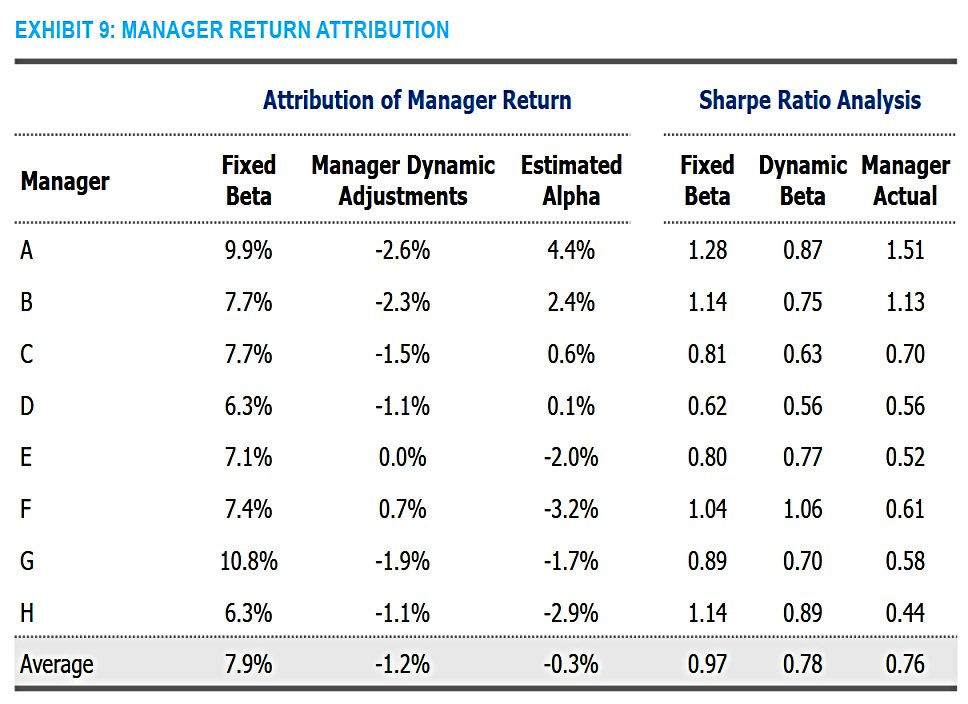
This model improves the alpha to -0.3%, but as NISA note, since the overall manager returns are the same for each analysis, this really means that the dynamic benchmark was easier to approach.
- Put another way, on average the dynamic adjustments produce a negative return (average -1.2%) on top of the fixed beta.
NISA interprets this as the dynamic adjustments being aimed at keeping risks balanced across asset classes and at sticking to the stated volatility goal (volatility targeting)
- These both sound like risk management and might be popular with fund investors.
Volatility targeting is supposed to clip left tails of return distributions but the adjustments actually lower the SPs by an average of 0.21 (0.97 for fixed beta down to 0.76 overall).
Replication part two
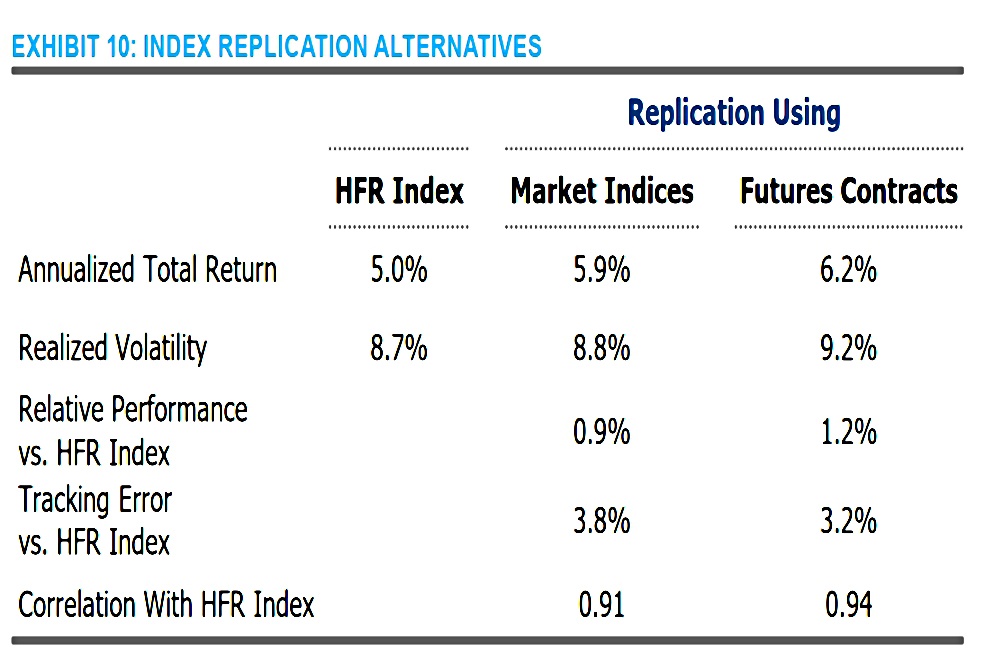
As a next step, NISA uses market indices to construct a portfolio that tracks the RP managers daily closely (tracking error of 3.8%) and also outperforms (by 0.9%).
- Using futures contracts is even better – tracking error of 3.2% and outperformance of 1.2%.
Alternatives

NISA also looked at including credit, a five-year lookback and shorting, but the results were similar to the original analysis.
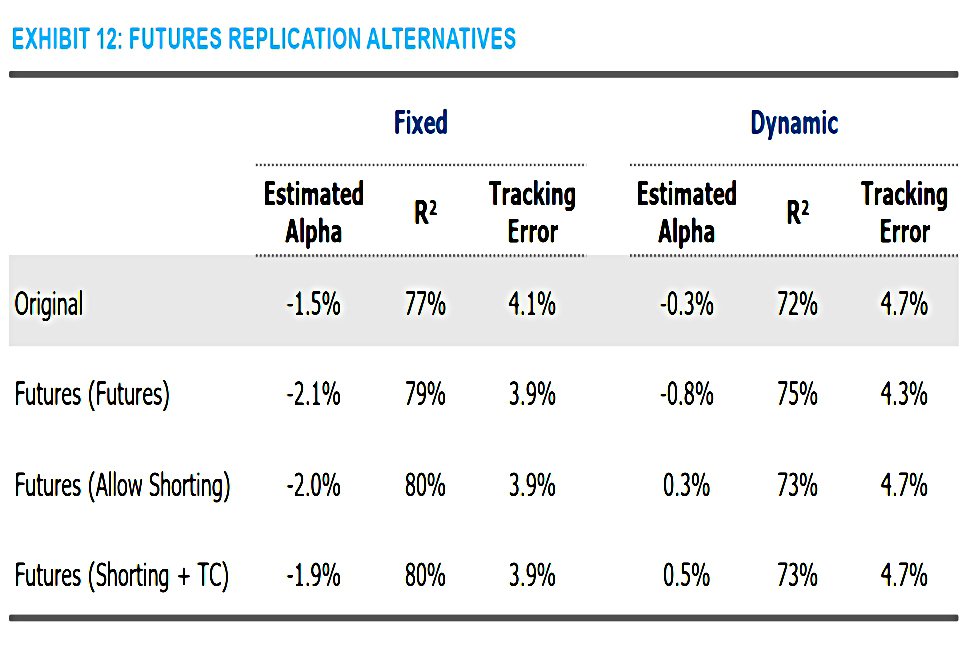
They also replicated the results using futures instead of the original indices.
Conclusions
That’s it for today.
- The main takeaway is that whilst RP is a useful way to achieve higher risk-adjusted returns, RP managers do not on average add alpha.
Passively holding the same asset classes in similar proportions should do as well or even better than the average RP fund.
- Note that the portfolios are overweighted, and this would require significant leverage.
Coming up with static weights should not be beyond a private investor, but deriving dynamic weights from manager time series (using regression analysis) seems a bit more complicated. (( If anyone is keen to have a go, NISA describes their methodology in an Appendix ))
Until next time.
Mike Rawson
Mike is the owner of 7 Circles, and a private investor living in London. He has been managing his own money for 40 years, with some success.