TOBAM – Maximum Diversification

Today’s post is about a lecture I attended many months ago from TOBAM Investments, which specialise in Maximum Diversification.
Contents
TOBAM

TOBAM was set up in 2005 by Yves Choueifaty, a French mathematician.
- Yves was formerly CEO of Credit Lyonnais Asset Management.
- He was also the presenter on the night.
TOBAM is 73% owned by employees, with the rest owned by Amundi and CalPERS.
- They have 54 employees and manage $10 bn.
Their mission statement is:
To provide rational and professional solutions to to long-term investors in the context of efficient markets.
The presentation I attended (pre-Covid) was entitled “Debunking the Myths of Investment”.
- Unfortunately, the slide pack wasn’t available on the night, so I’ve pieced together this article from a more general handout, and what I could find on the web.
I did eventually get hold of the paper on which the presentation was based, so I will run through the debunked myths at the end of the article.
London Quant Group
The meeting I attended was organised by the London Quant Group, a terrific organisation that has been in existence for 32 years.
- If you have any interest in the maths of investment, seek them out on Eventbrite.
Maximum diversification
TOBAM specialise in Maximum Diversification.
- The idea is that you can outperform the market cap index with lower risk, by increasing the diversification of your portfolio.
It’s a quantitative approach that in their implementation is long-only, non-leveraged and always fully invested.
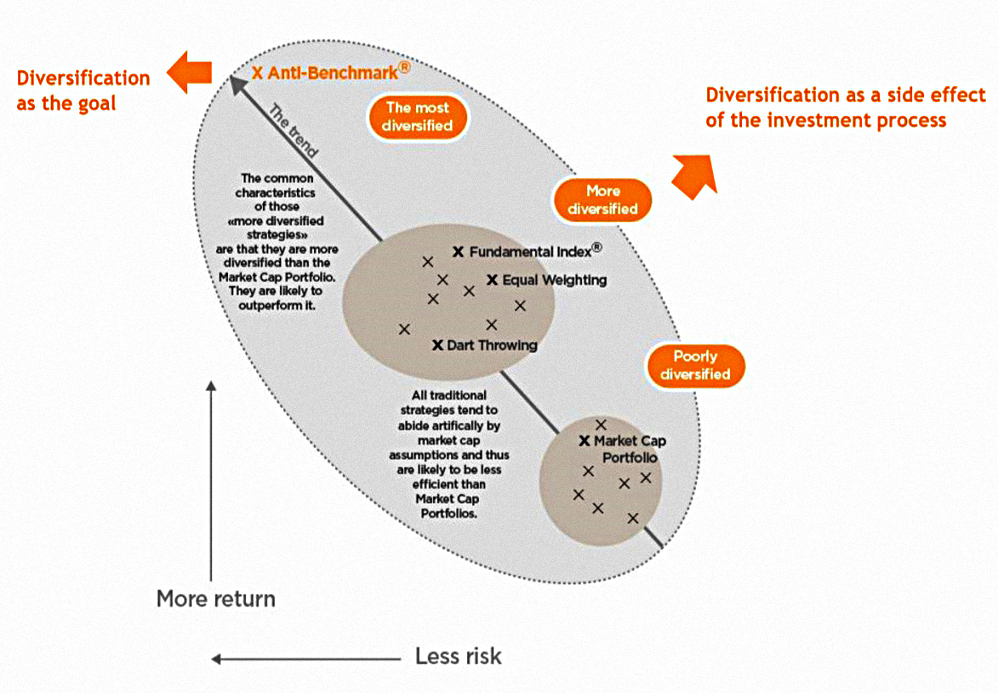
To TOBAM, being diversified means allocating your risk evenly to all of the available sources of risk.
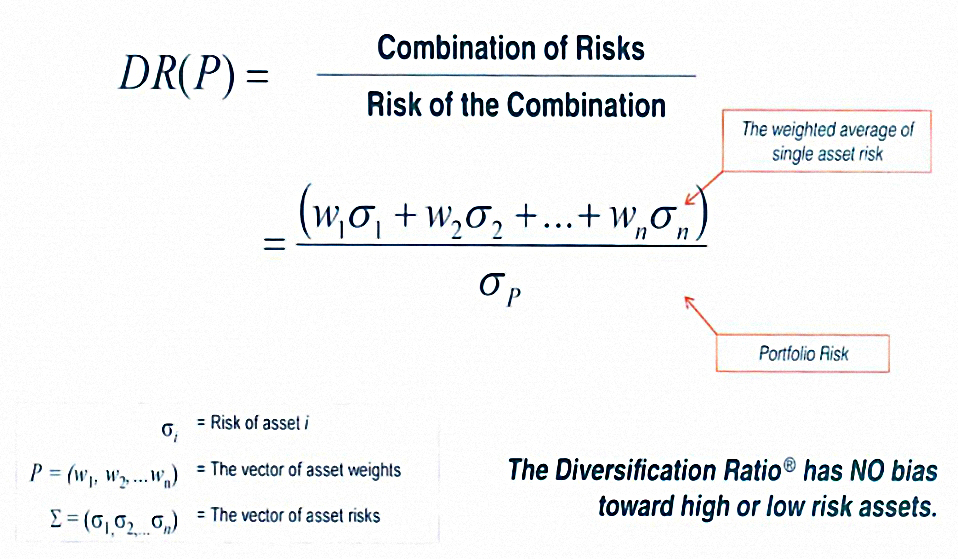
To help them do this, they use a patented mathematical measure of portfolio diversification – the Diversification Ratio: (( This is a new one on me – I hadn’t realised that you could patent statistics ))
The portfolio that this method produces is called the Maximum Diversification Portfolio (MDP).
- It’s also referred to as the Anti-Benchmark Portfolio (AB).

The stocks inside the MDP have themselves the lowest correlations to the MPD as a whole.
TOBAM describe the MDP as having the following attributes:
- It neutrally allocates risk to the effective independent sources of risk.
- It attempts to be the undiversifiable portfolio.
- It provides a theoretical definition of the market risk premium.
Benchmark bias
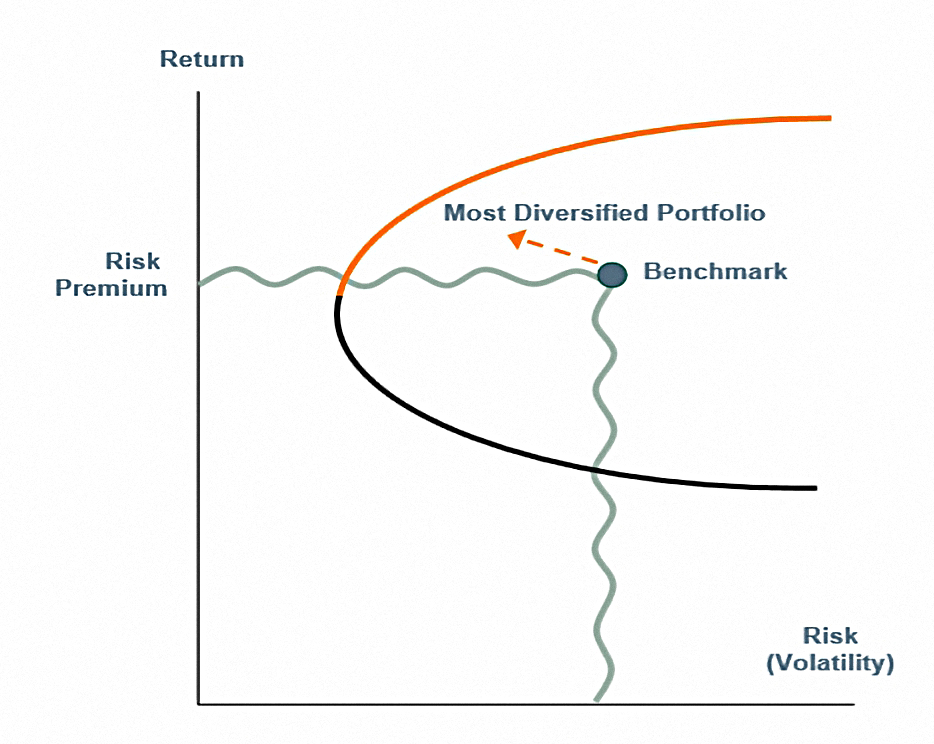
Underpinning TOBAM’s work is the idea that the benchmark is biased, whereas the MDP is the max SR portfolio.
- This is interesting in the context of our hand-crafted multi-asset max SR portfolio, based on Rob Carver’s work.
We can look at this in two ways:
- The benchmark will never be on the efficient frontier
- There will always be portfolios with better Sharpe Ratios (more return per unit of volatility)
- Market-cap-weighted benchmarks must inevitably have a structural bias
- They overweight to what has been doing well, and their peak allocation to a successful sector is just before it declines
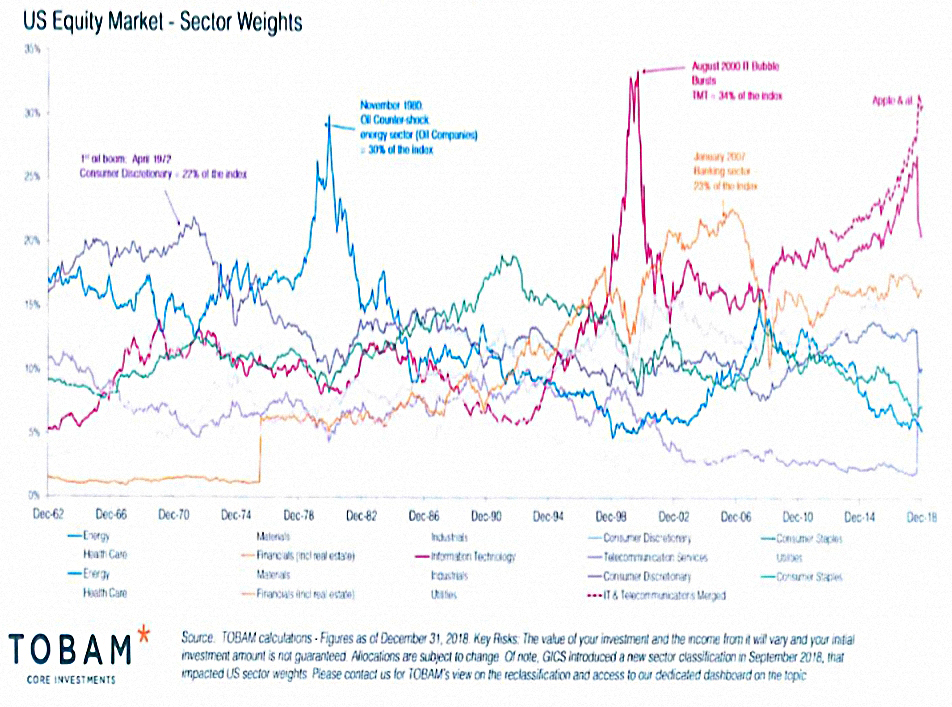
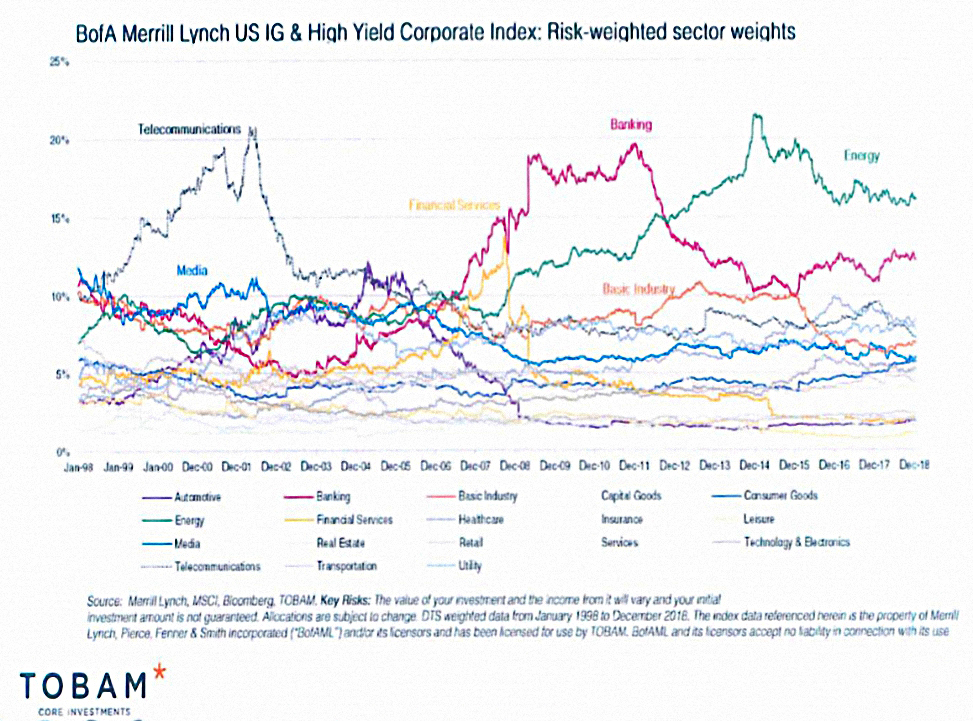
You can see that from the chart of US equities above, but it’s also true of bonds:
Thus the Market Cap index is not really passive, rather it is a Dynamic Risk Allocator.
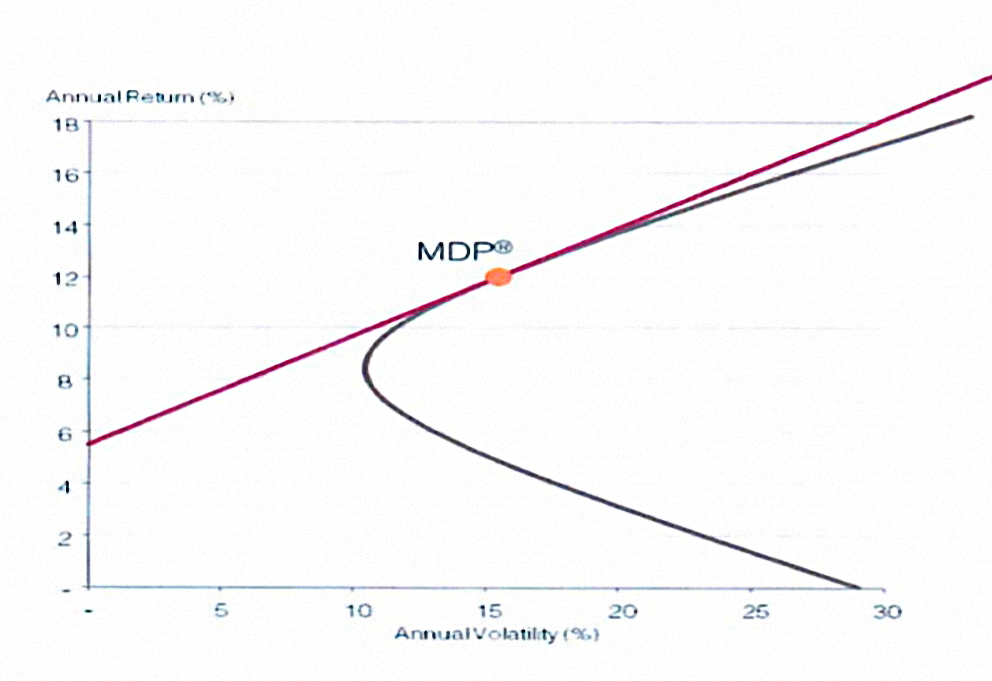
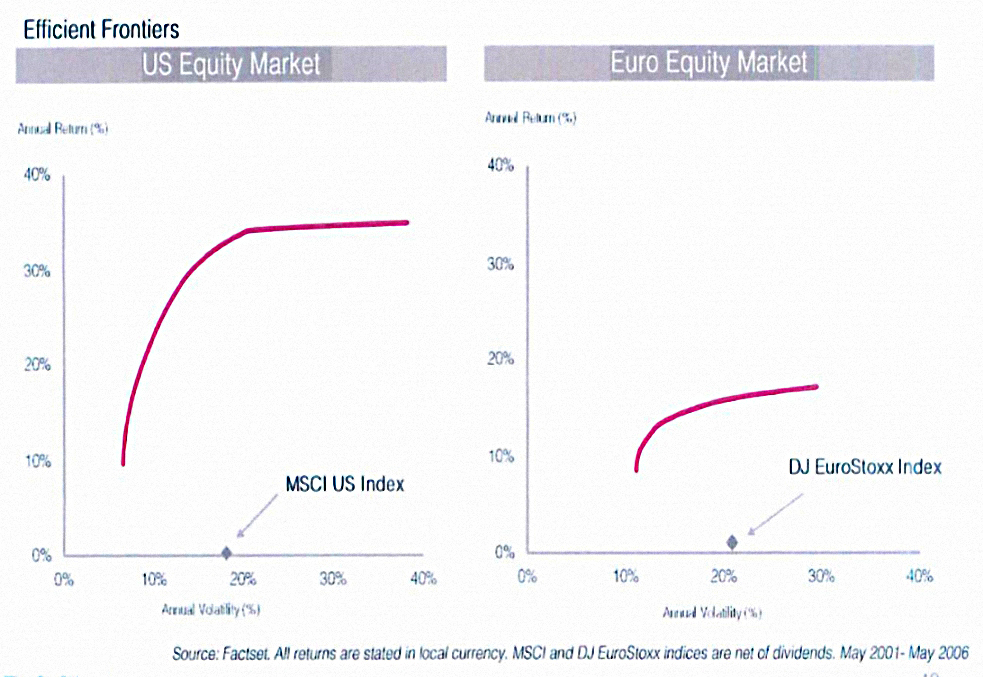
The chart below shows how the US and European stock benchmarks are far from the efficient frontier (using data from 2001 to 2006 in this case):
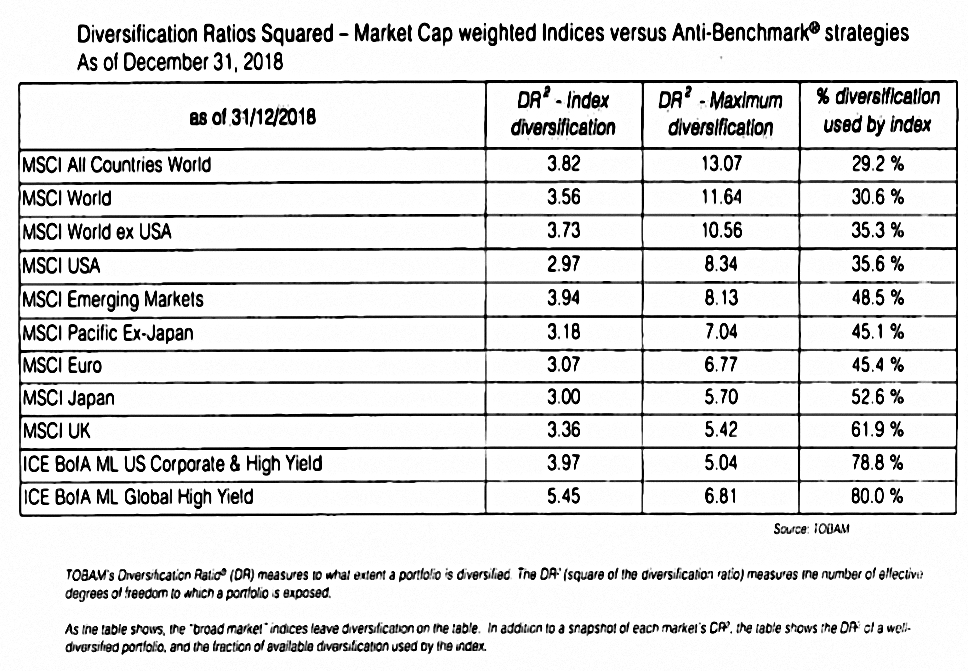
They also provide a “diversification dashboard” showing what proportion of the available diversification is used by the various indices:
- The world index uses only 30% (as of December 2018).
- The US uses 36%, whereas the UK uses 62%.
Risk factors
TOBAM define the exposure to a risk factor as the portfolio’s correlation to this factor.

As the slide says:
All the independent risk factors present in the market are represented in the portfolio, even if the portfolio has no position in a given stock or sector.
We can also look at risk factors using the more widely understood definition of outperformance factors, as originated by Fama and French, and later elaborated into the concept of smart beta.
- I would argue that TOBAM’s work falls under the heading of smart beta, though I have seen the firm argue the opposite.
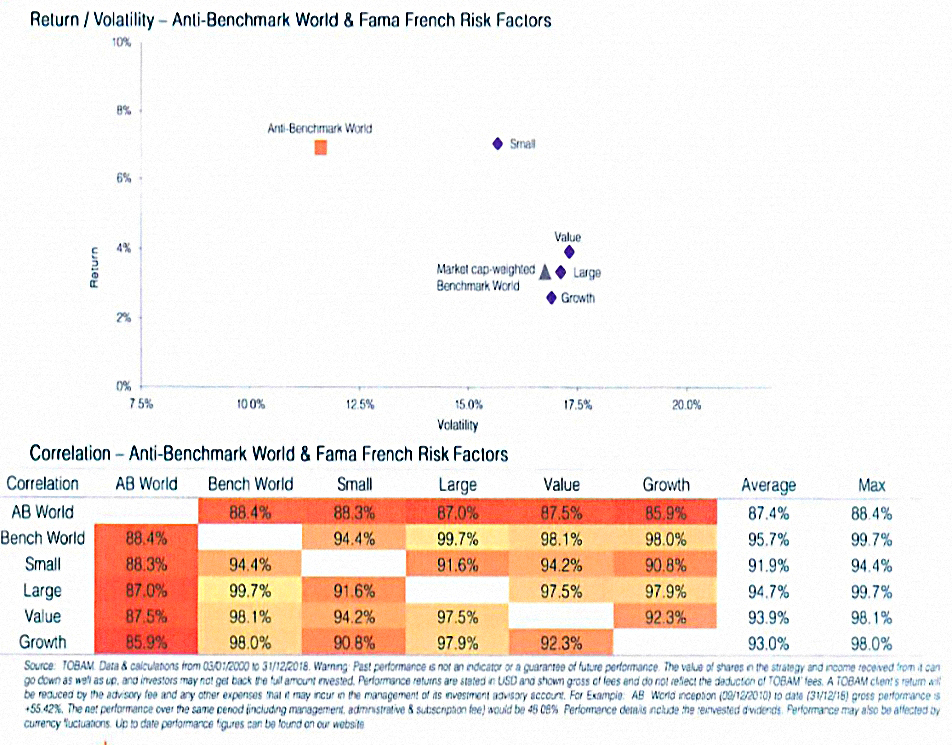
The chart above compares the Anti Benchmark portfolio to the two outperformance factors of Small and Value (note that Large and Growth are underperformance factors).
- AB World has the same return as small caps at much lower volatility.

The chart above compares (and combines) AB World with the more recently popularised outperformance factor Low Vol (here called Min Vol or MV).
- AB provides higher returns at lower volatility than MV.
- Both factors comfortably beat the MSCI World index.
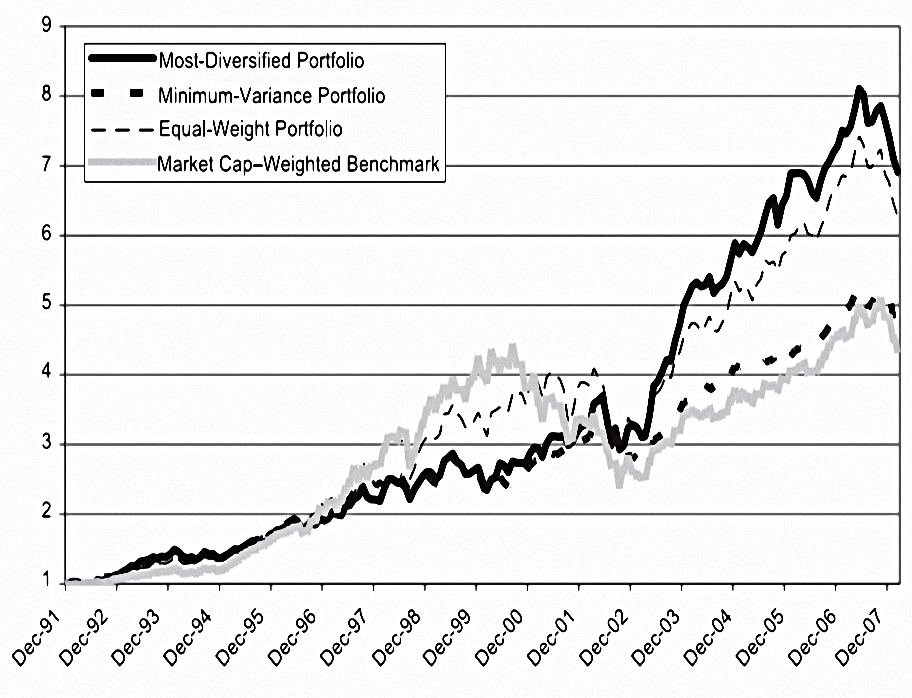
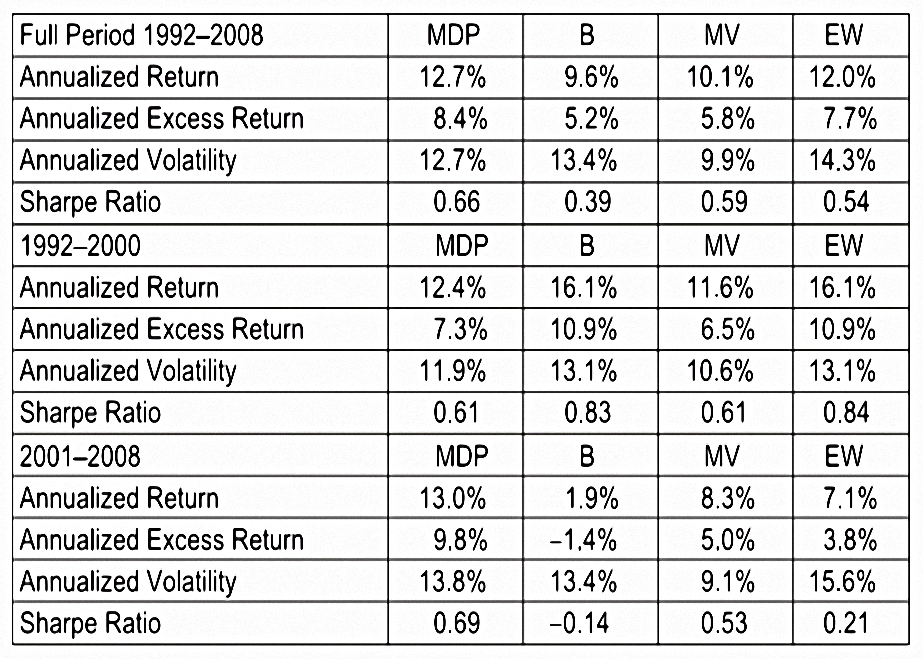
The two charts above compare the MDP in the US to market-cap, equal weight and min vol.
- MDP is the winner (excluding the dot com boom), but equal weight also does well.
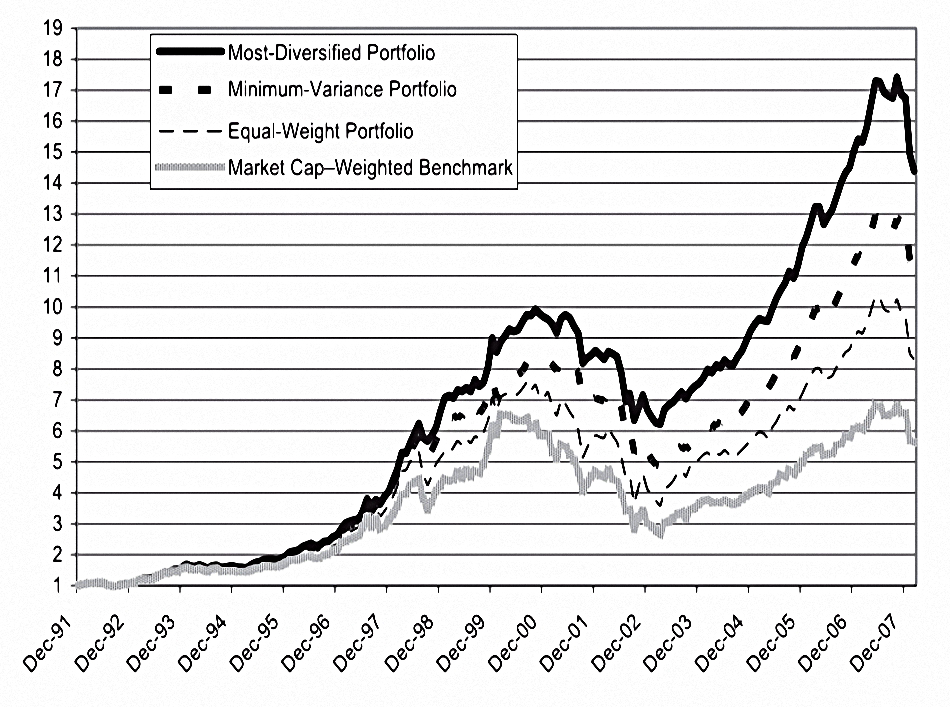
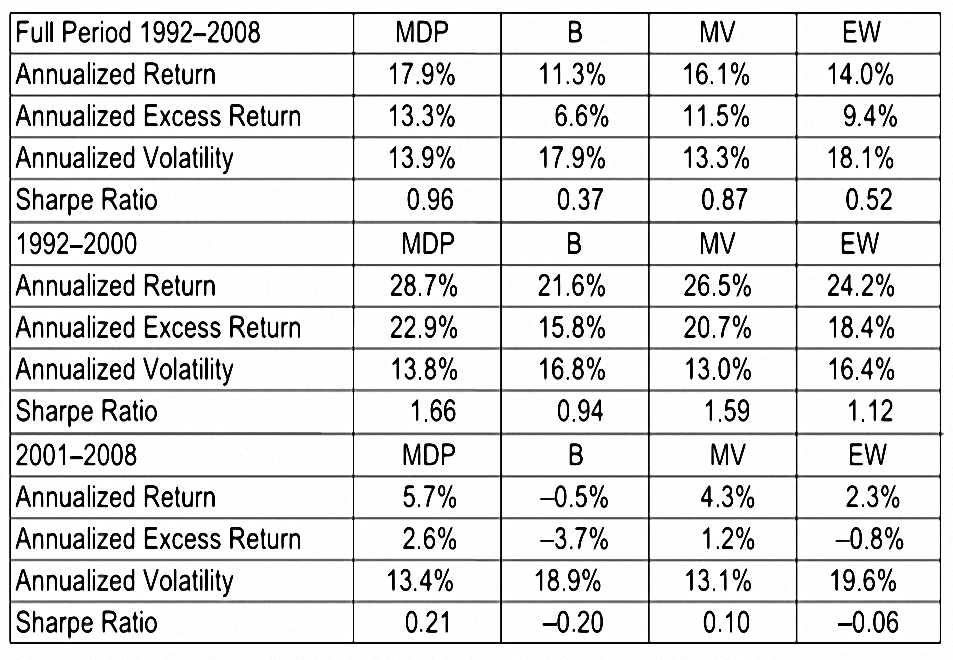
The two charts above have the same data for the Eurozone.
- Here Min Vol comes second to MDP, and the dot com boom isn’t such a factor.
Stability
To examine the stability of the MDP, TOBAM compared the performance of randomly-assigned subsets of the MDP to itself and to the benchmark:
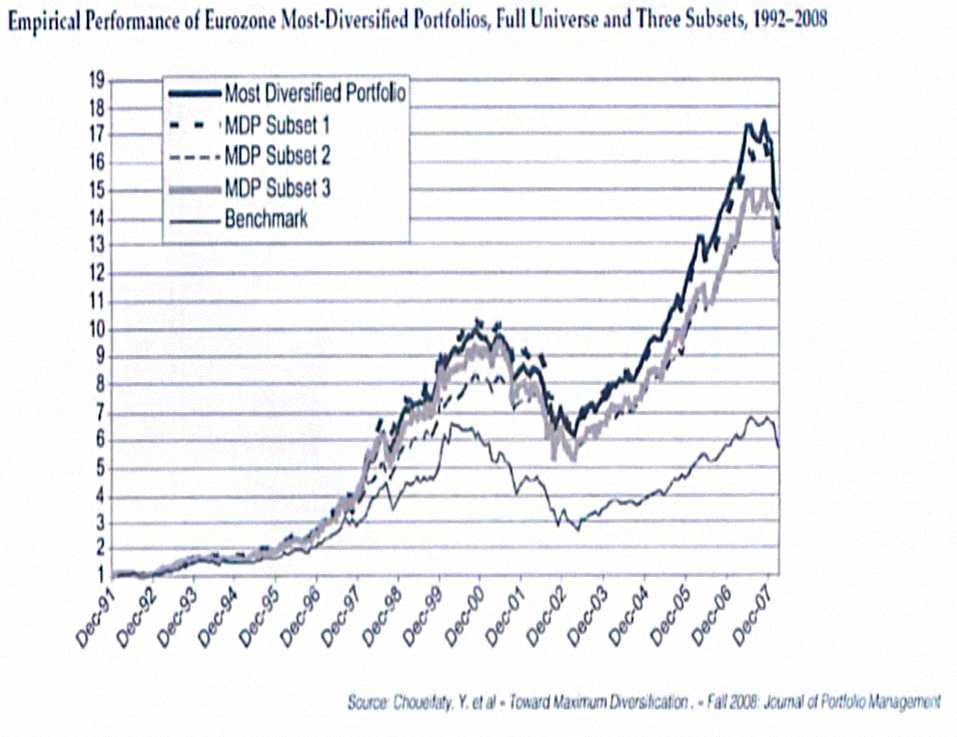
The subsets are much closer to the MDP than to the benchmark, as we would hope.
Rebalancing
One of the drawbacks of smart beta – and systematic investing in general – is the high level of trades that can be needed to correctly rebalance the portfolio and the high cost of implementing them.
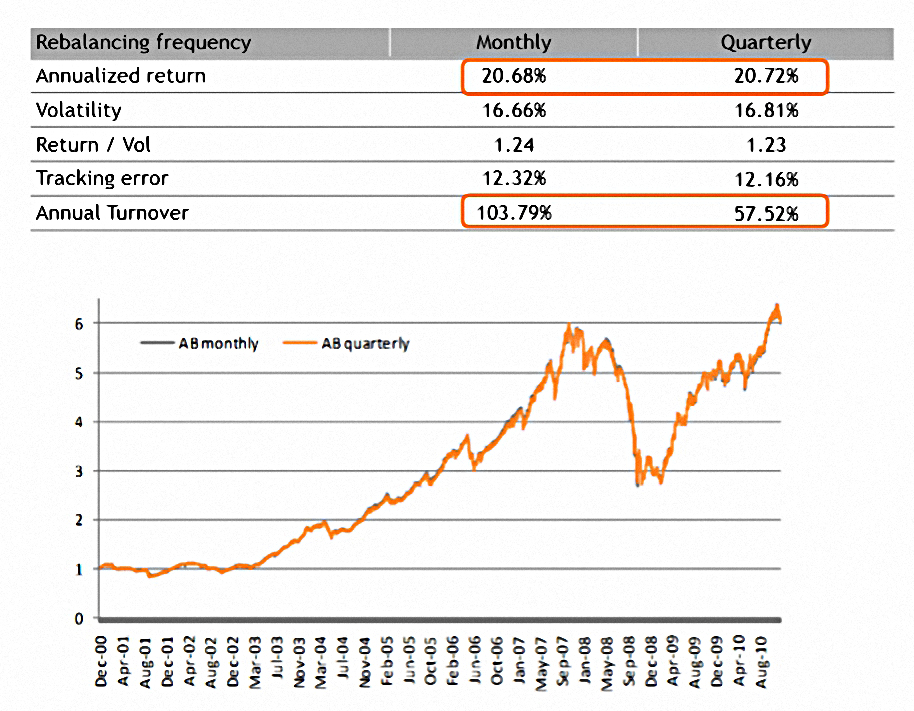
TOBAM found that quarterly rebalancing produced comparable returns, volatility and SR, but with half the turnover.
Myths
We’ve already covered one of the big myths – that a cap-weighted benchmark is neutral.
These benchmarks inherently forecast that the successes of the past will be the successes of the future.
Passive is a cheap way to buy expensive stocks.
Let’s look at a few of the other myths.
Tracking error
The second big myth is that tracking error is a measure of risk.
- Most investors interpret a low tracking error to be a good (low risk) thing.
But there is no correlation between tracking error and standard deviation/volatility/risk:
![]()
There are two problems with tracking error:
- It is a relative measure, based on a benchmark.
- If the benchmark is not what you want, then a low tracking error is not what you want either.
- It follows that there is both positive and negative tracking error, depending on whether it moves you closer to the efficient frontier (as per the MDP).
- This is similar to the problem with using volatility as a measure of risk – upside volatility is a good thing.
Holdings are not exposures
Many investors believe that they can judge the exposure of their portfolio to a risk factor by looking at the allocation within the portfolio to a particular stock, sector or asset.
- In fact, you need to check the correlation of all the portfolio constituents against the risk factor in question.
As TOBAM put it:
Always wear your correlation glasses.
Efficiency
TOBAM are very concerned with definitions, and a good example is their dislike of the ambiguity around efficiency, which has two meanings in investment:
- As in, an efficient portfolio
- This will have maximum returns for the chosen level of risk (max SR)
- It will lie on the efficient frontier
- As in, an efficient market
- This will be difficult to forecast because most information will already have been discounted.
TOBAM believe that markets are pretty efficient, but that market cap benchmarks are not efficient because they are not sufficiently diversified.
- This is not quite a myth but worth pointing out nonetheless.
TOBAM further note that CAPM doesn’t say that benchmarks are efficient.
- Rather, William Sharpe’s original paper says that under a set of “highly restrictive and undoubtedly unrealistic” assumptions, the market cap portfolio is efficient.
The CAPM could be seen as an elegant way of proving that it is “undoubtedly unrealistic” that the market-cap weighted benchmark could ever be an efficient investment.
The role of active management
Passive advocates complain that active managers can’t beat a cap-weighted market index (or indeed, beat passive trackers).
- But this is obvious since passive funds don’t influence the market.
Thus the market is the sum of all the bets taken by active managers.
- After you subtract their fees, they must underperform the benchmark.
- And since their fees are higher than those of passive funds, they must also underperform the passive trackers.
The real purpose of active investors is, however, to drive the market through their capital allocations.
- This is why there could be problems if the proportion of passive funds reaches a tipping point.
This topic is too large for today’s article, but we’ll return to it at some point in the future.
Conclusions
It was a terrific presentation, and I’m sold on the idea of maximum diversification.
- Accessing it as a private investor is another thing entirely.
It might be possible to manually construct an MDP based on the FTSE 100.
- But the transaction costs might be a problem.
- And the UK index is one of the more diversified in any case.
But even if we can’t access TOBAM’s version of MDP, there are two useful takeaways:
- Maximum diversification is a laudable goal, and somewhat easier to approach on a global multi-asset basis (see The Perfect Portfolio).
- Market cap indices are not great, and there’s plenty of scope to beat them with factor investing.
Until next time.
Mike Rawson
Mike is the owner of 7 Circles, and a private investor living in London. He has been managing his own money for 40 years, with some success.


Very interesting read – thanks for pulling it all together.
Did you read this post from last year:
https://monevator.com/why-invest-in-alternatively-weighted-index-tracker-funds/
P.S. ‘I raised an eyebrow’ when I read patented stats
I did. I’m afraid I don’t agree with Lars about a number of things, and I find it hard to believe that he invests his own money in the way he tells other people to invest theirs. Indexing is fine when you are starting out, but a two fund portfolio for a large pot under macro conditions like today seems risky to me.
I didn’t like his book much, either: https://the7circles.uk/category/gurus/simple-approaches/demystified/