Intergenerational Differences
Today’s post looks at an interim report from the FCA on Intergenerational Differences.
Contents
Intergenerational Differences
Last week I belatedly published an article about a report from the Resolution Foundation on the potential for a new inter-generational contract.
- This week I have more on a similar theme.
The report published this month is actually a summary of responses and next steps to a discussion paper published back in May 2019.
- So let’s start with that.
2019 discussion paper
The FCA’s strategic objective is “to ensure relevant [financial services] markets work well [for consumers].”
- This study plays into this by helping the FCA to understand consumers financial needs, and how they might differ between generations, both now and in the future.
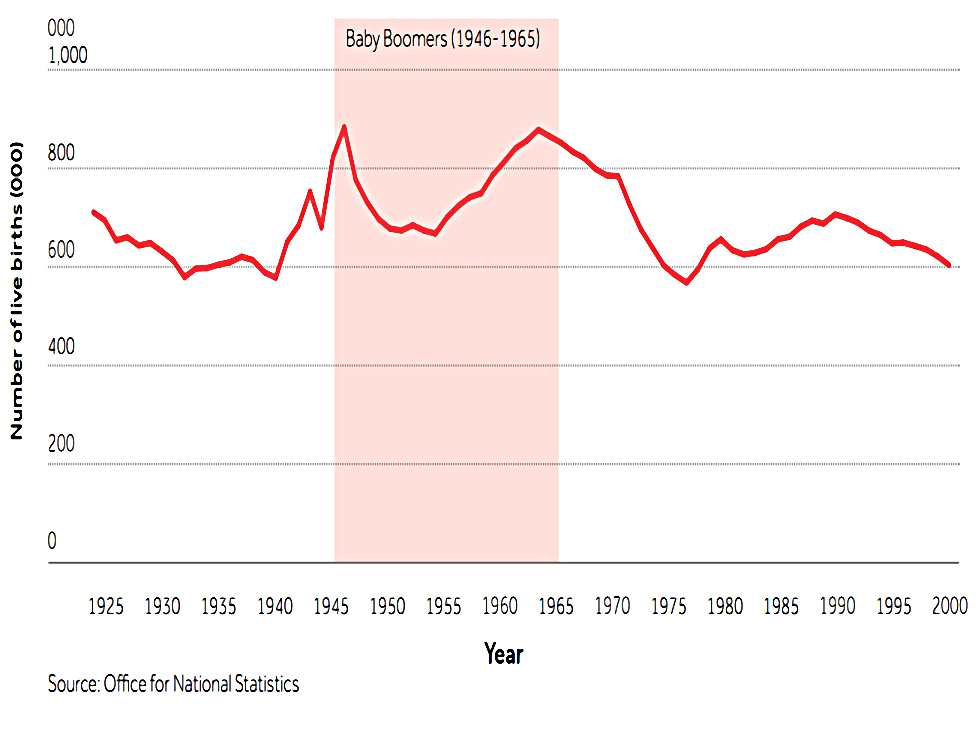
The paper looks at three generations:
- Baby boomers born between 1946 and 1965
- Generation X born between 1966 and 1980
- Millennials born between 1981 and 2000
It looks at data from the ONS Wealth and Assets Survey over a period of eleven ten years, from 2006 to 2016.
- In particular, it looks at changes between the periods 2006-08 and 2014-16 – for simplicity, I’ll refer to these averaged sets of years as 2006 and 2016.
Boomers
Many boomers (not all) have DB pensions and have seen good asset appreciation during their lives.
- But they might need help with the new Pension Freedoms, or with accessing their accumulated property wealth (equity).
They also worry about funding later life care costs, even though few people actually face large bills in this area.
Gen X
Gen X often have good incomes, but find it hard to save enough money for retirement.
- They have low cash savings and high non-student debt.
But they have seen some house price rises and have benefited from lower borrowing costs than the boomers.
- Those who inherit should do okay in the end, but they will receive their inheritances quite close to their own retirement.
Millenials
Millennials are hard hit by higher house prices, less secure employment and by student debt (which impacts their ability to save in core earnings years).
- They will receive their inheritances even later than Gen X do.
Socio-economic factors
The FCA has identified five factors which impact the three generations differently:
- Demographics – the population is ageing
- Retirement is longer and buying an annuity no longer fits the bill
- Low interest rates since 2009
- Which means that returns on investment have also been lower (4% pa real on stocks, compared to 10% pa before 1995)
- This also makes it cheaper to borrow money, pushing up house prices when borrowing tests are weak
- Many people would now be unprepared for a rise in interest rates
- Rising house prices – the ratio of prices to earnings has more than doubled for first-time buyers over the last 30 years
- Many people (62% of under-35s in 2017) borrow from “the Bank of Mum and Dad” (BoMaD)
- Employment is more flexible but less secure, with more self-employed, part-time and zero-hours workers
- These workers may miss out on auto-enrolment pensions and long-term sick pay
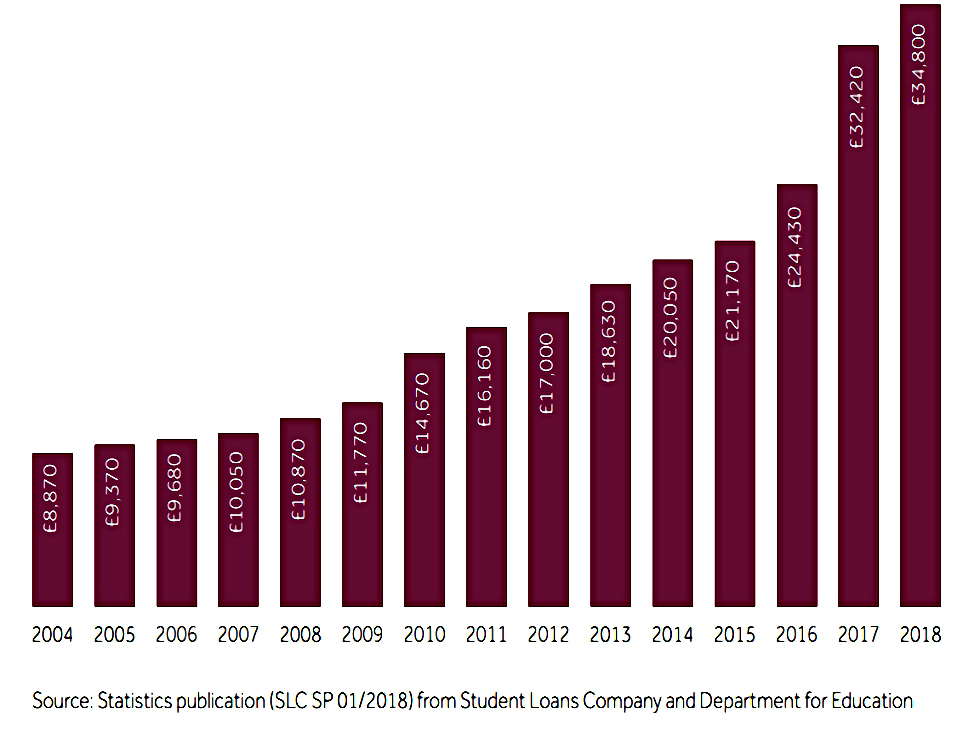
- Student loans
- The average final debt in 2017 was £35K, compared to £11K in 2008
Financial services impacts
Here, the FCA has four points:
- Mortgages need to be more flexible for young people.
- Does this mean longer terms or payment holidays?
- The FCA also notes that older people may need “innovative” products (presumably some form of equity release/reverse mortgage)
- Pensions – they claim that many workers are not saving enough money for retirement
- Auto-enrolment should solve this (over time), but the minimum contributions are not high enough at present (85 cf. a realistic minimum of 15%)
- Products to support extended retirement are also needed (I have no idea what these might be)
- Flexible short-term credit is important, apparently.
- As far as I can see, we are already awash with consumer credit.
- “Consumers are increasingly overlooking their protection needs”
- Are they really? Most people have too much insurance
- If it isn’t a legal requirement, it’s better in the long run to self-insure
Lifecycle model
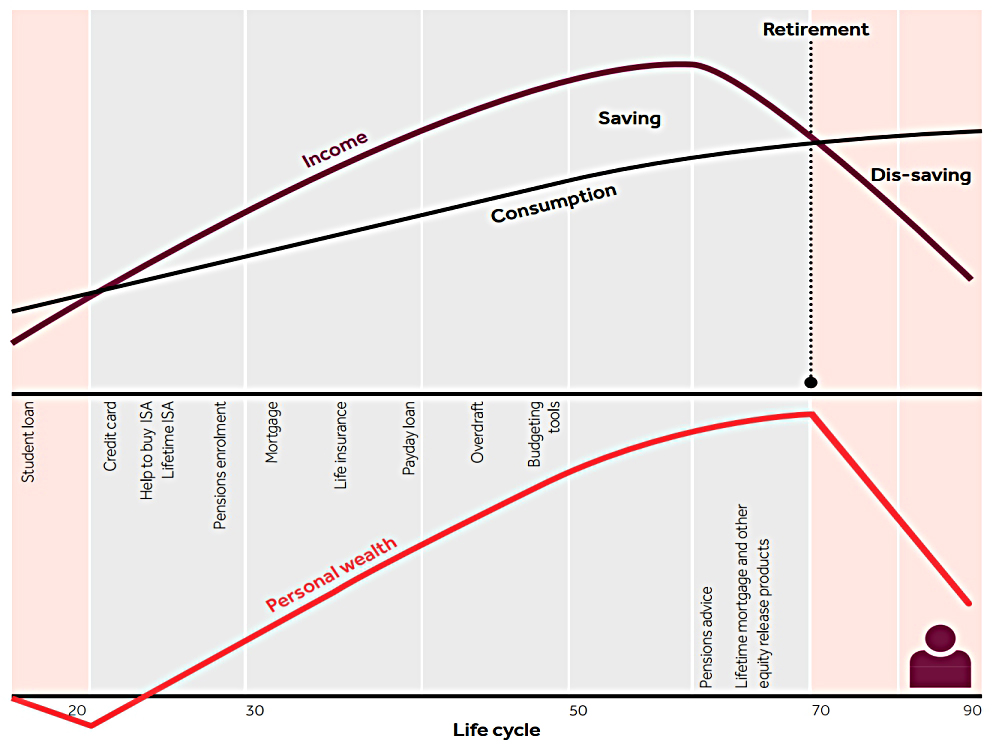
Here’s how the FCA sees the financial life cycle for an individual.
- It covers income, consumption, savings, wealth and decumulation in retirement, along with the major life events.
Wealth

This chart shows wealth by age in 2006.
- Wealth ramps up from 30 to 55, and peaks in your early sixties before declining in retirement.
Note that peak median wealth is less than £200K.
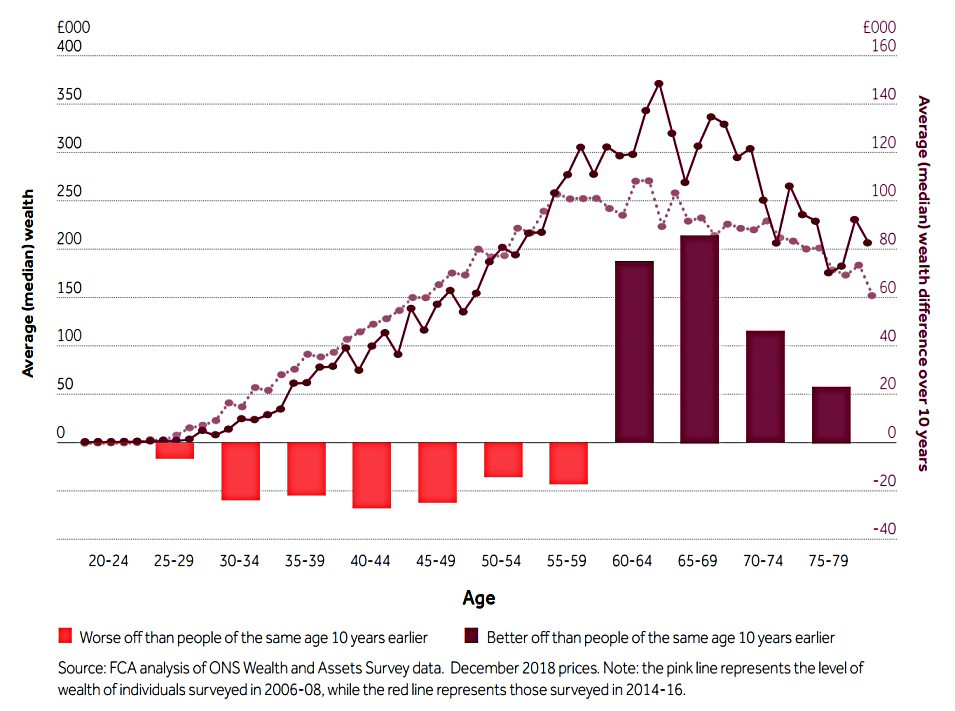
People of working age had less wealth in 2016 than people of the same age in 2006.
- In contrast, people of retirement age had more money.
The poorest people did not get any richer during the ten years.
Assets
The FCA divides wealth into three “asset classes”:
- Pensions
- Property
- “Financial wealth” (everything else)
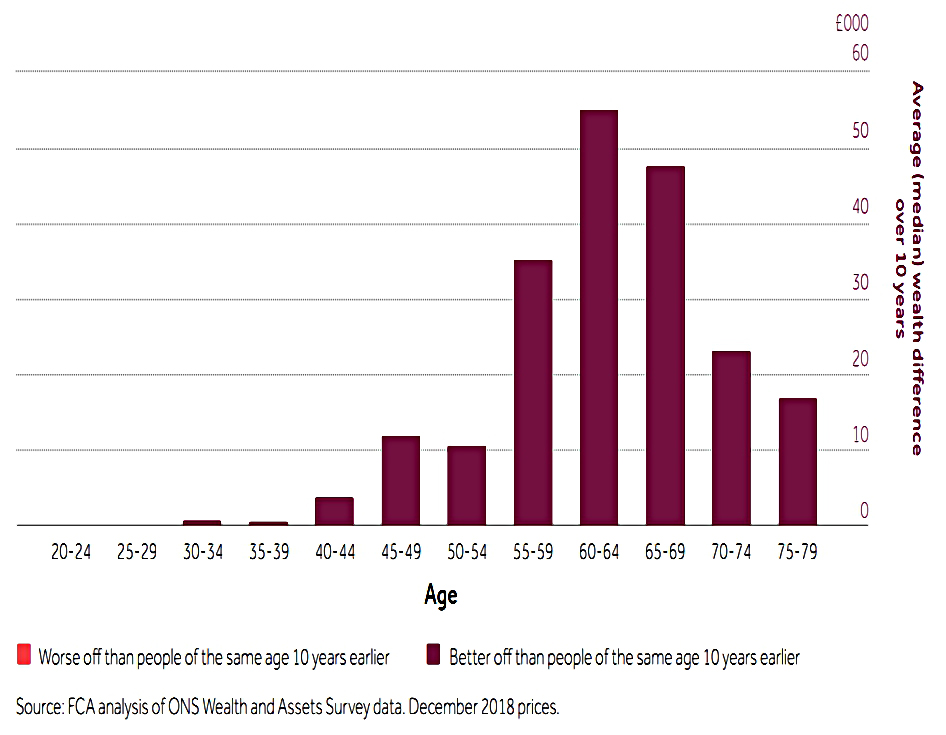
Pension wealth increased for everyone between 2006 and 2016, but particularly for those between the ages of 55 and 69.
This is not surprising:
- They have the biggest pension pots to begin with
- The increases were modest (£55K over ten years for the group that did best)
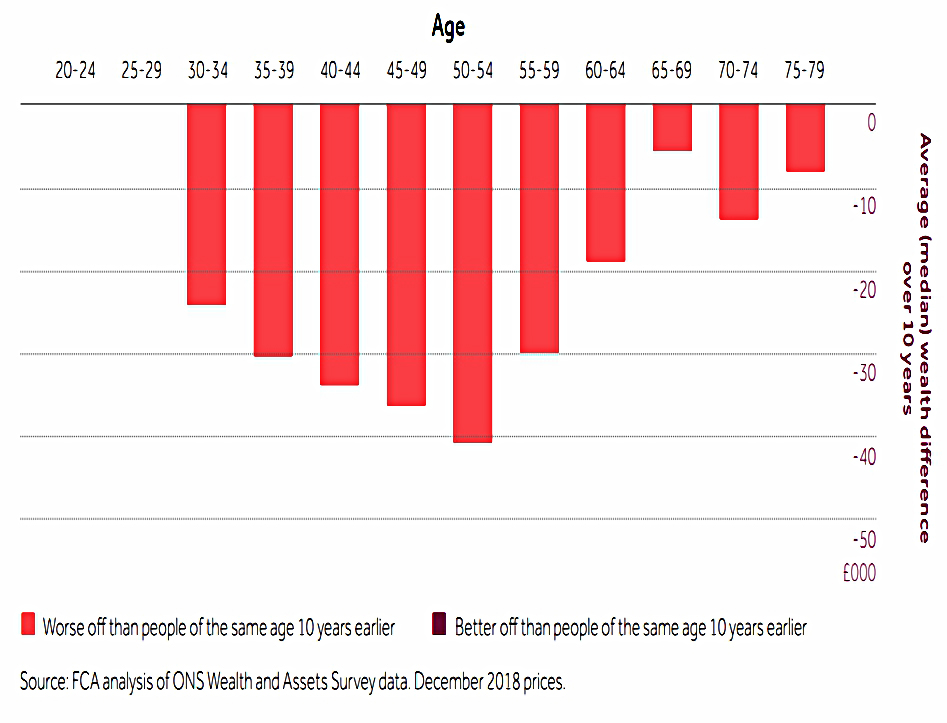
In contrast, everybody lost money on their property (presumably due to a house price “crash”).
- Those aged 40-60 did worst (slightly surprising, as you might expect people older than that to have more property to begin with)
- Again the numbers are small (worst case £40K over ten years)
The average (median) person in 2016 started to accumulate property wealth at age 34, compared to age 30 in 2006.
- Those in the top 10% of property wealth actually saw an increase over the decade.
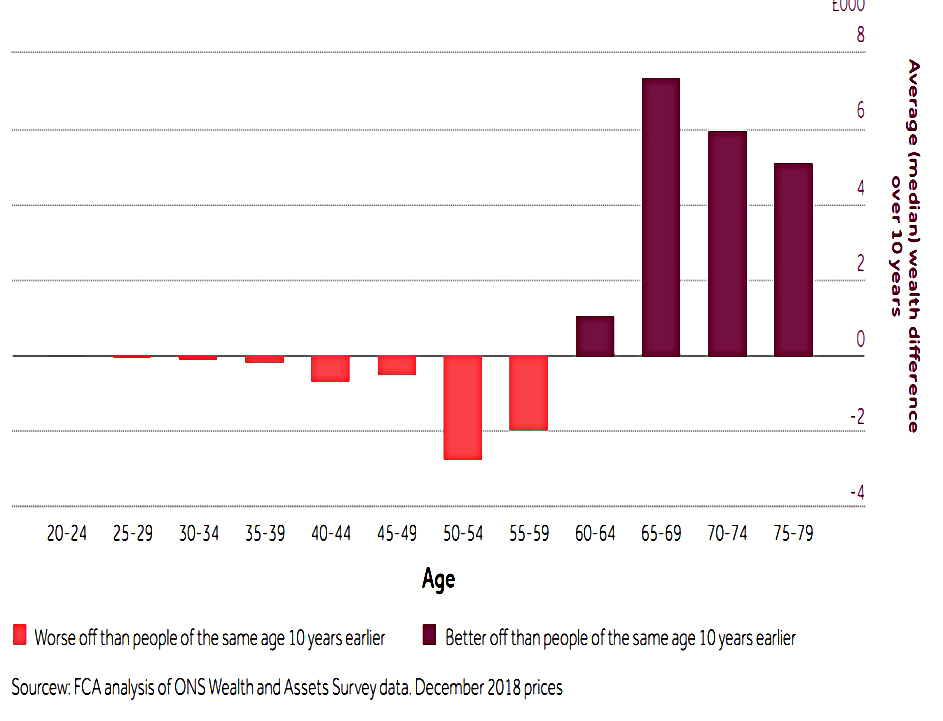
On financial wealth, we see a more clear operational divide:
- People of working age – particularly Generation X – had less financial wealth in 2016.
- Boomers mostly saw an increase.
But the numbers here are tiny – those aged 65-59 gained £7K over ten years.
Changing patterns
The FCA concludes that boomers are doing better than previous generations and that Gen X is doing worse.
- They also note that the average person is accumulating wealth later into life (before running it down).
But they project that all three generations will reach similar wealth levels during retirement (it will just take the younger cohorts longer to get there.
- Property will be more important to non-boomers, and pensions less important.
Within the younger cohorts, getting on the housing ladder will be an important divide.
- Millennials will pay off their mortgages later in life but are more likely to receive an inheritance.
- They have higher levels of education but also more student debt.
They end with a list of questions that they would like to see addressed during the consultation.
- Sadly, they are not very interesting.
Summary of responses
The summary of responses was published in July 2020.
- The response to the discussion paper was not exactly overwhelming:
We received 47 responses to our DP from a range of stakeholders, including regulated
firms, trade bodies and think tanks. These responses, and insights gathered through
our intergenerational differences conference and other stakeholder engagement.
There were five main points:
- The five drivers of change from the original report were supported
- Family assist mortgages, usage-based insurance and default retirement pathways were provided of examples of the industry response to change.
- Some thought that more engagement through life events was needed and that product documentation and information remained too complex.
- Consumers fail to take advantage of services designed to help them make financial decisions.
- This is particularly worrying given that consumers are increasingly responsible for their own most significant financial decisions.
- The FCA needs to improve financial literacy and awareness.
- They should also do something about loyalty penalties in financial products.
- The funding of long-term care was also identified as a key challenge.
- Many consumers do not have enough savings to meet their future financial needs.
The FCA doesn’t plan to do much in response:
We do not think it would be appropriate or proportionate to pursue bespoke remedies,
including rule changes, in response to these findings.
Conclusions
The knee-jerk response from the industry is always that more financial education is needed, but I’m not so sure.
- Financially speaking, the fundamental issue with most people is that they are consumers rather than investors (short-term rather than long-term).
Even today’s investors prefer ISAs to SIPPs because of their flexibility/optionality, despite the generous tax-breaks on offer.
Most of the real solutions are outside the scope of the FCA’s remit.
I think that we need to make more of the investment landscape – at least at the contribution level – compulsory.
- I’d like to see the auto-enrolment workplace pension contributions increased to 15%, with no opt-out.
Serious restrictions on how much consumers can borrow, and for how long, would also help.
- And we should build a lot more houses, in a variety of styles and sizes.
For older people, sorting out the funding of care would be the priority.
None of this will happen, of course.
- Until next time.
Mike Rawson
Mike is the owner of 7 Circles, and a private investor living in London. He has been managing his own money for 40 years, with some success.


I agree the differences are not as significant as one might have expected them to be.
I guess this is a combination of the use of averages (peak median wealth < £200k is a bit of an eye-opener ) and the general rhetoric and hysteria around the subject.
No real issues with your conclusions.
A couple of thoughts on the "analysis" follow:
1) RPI was used as the deflator
2) is a lot of the so-called intergenerational differences not largely the consequences of ten plus years of near ZIRP; explicitly, prolonged low interest rates have meant:
a) asset prices have grown significantly which, amongst other things, boosts DC pots;
b) DB valuations have increased significantly as they are based on Gilt prices;
c) cheap mortgages with limited supply of housing so prices of houses have risen;
d) lower interest rates for cash savings accounts – which, as you point out, remain a favoured vehicle
However, the ZIRP consequences argument is not so compelling and/or eye-catching.
I agree – low interest rates mean high house and stock prices and DB valuations. Perhaps some will live to see the reverse process, though I doubt it will be in my time.
Thank you for your article. It is a very nice summary.
Coming back to one of your last point about most people that “are consumers rather than investors”, I was wondering during the whole reading is if the FCA published data about consumption. Interesting information would be the consumption per age group and the evolution of this consumption over time as well as the saving rate (although both are linked). That would be significant pieces of information to understand the rest of the study better.
I am surprised as well that with one of the points of the FCA concerning the need for more flexibility for short-term credit. I felt that over the last 20 years with the evolution of financial services and technologies, credit is more accessible and flexible than ever. However, this may be a misconception, and I would be interested in the rationale behind it (if anyone knows).
About “consumers fail[ling] to take advantage of services designed to help them make financial decisions”, I think this is also due to the increasing complexity of the available financial services and the low level of financial literacy. 50 years ago, there were fewer available services which means fewer opportunities, but also less possible financial mistakes and missed opportunities.
One last thing that I was wondering is how the participation in the stock market evolved by age group. Does the FCA publish any data about it in its report?
I think you would be best looking at ONS data for consumption.
The stock market participation situation is clouded by pensions – older types have DB, some younger types have DC and now everyone has workplace auto-enrolment (more DC). Plus since Covid-19 you have the RobinHood crowd.
I think more people are exposed to the stock market than think that they are. Not sure where you can find those stats, though.
ONS again may be helpful again, see, for example:
https://www.ons.gov.uk/peoplepopulationandcommunity/personalandhouseholdfinances/incomeandwealth/bulletins/totalwealthingreatbritain/april2016tomarch2018
From memory, the ONS define wealth as being from: net property; private pensions; net financial; and others.
Thank you Al Cam. That is a very good source, I will have a look at it. Especially the second one, there is much information about household expenditures.
No problem.
IMO, the ONS are often over-looked or even slighted, but do generally produce excellent & reliable stuff.
Another document you may find useful (albeit a handful of years old now) is given at:
https://ilcuk.org.uk/wp-content/uploads/2018/10/Understanding-Retirement-Journeys.pdf
This report relies very heavily on ONS data, but explores some other angles that you may find interesting.
Re consumption surveys etc, assuming you are UK-based, then the Office for National Statistics (ONS) is the place to go. A good place to start might be: https://www.ons.gov.uk/peoplepopulationandcommunity/personalandhouseholdfinances/expenditure
The ONS have been doing these surveys (or similar) for many many years and they slice and dice the data in all manner of ways, including those that you mention.