Irregular Roundup, 20th May 2024

We begin today’s Irregular Roundup with small caps.
Small caps
For FT Alphaville, Robin Wigglesworth looked at small caps.
- Small stocks are riskier, so they should outperform over the long run.
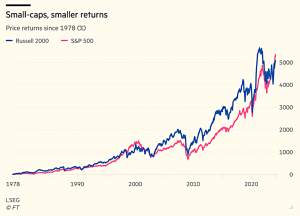
But does the size factor still work?
Not in the US, since 1978.
- The chart excludes dividends, but larger companies tend to have higher dividends, so including them would only make things worse.
Perhaps it’s because of the dominance of US large caps (tech).
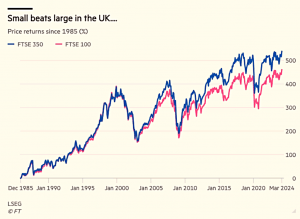
Certainly, the effect is still there in the UK.
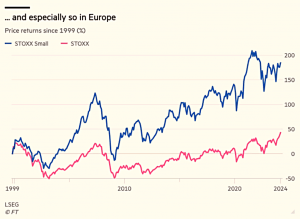
And in Europe.
And in Japan.
And in Emerging Markets.
But the US is so big that even one broken market is a problem for the small-cap “industry”:
Of the almost $1.7tn invested in dedicated small and mid-cap funds globally, nearly $1.3tn of it is invested solely in the US.
The industry got started with a 1980 article in Fortune called “Giant Payoffs from Midget Stocks”.
The article was based on research by a PhD student at the University of Chicago called Rolf Banz. Between 1926 and 1975, the average annual rate of return from large US stocks was 8.8 per cent, while smaller ones averaged 11.6 per cent. Even when you adjusted for their different volatility, small-caps performed better.
Along with value and momentum, small size is one of the core factors for equity outperformance, with a logical explanation:
Tomorrow’s big stocks are today’s small stocks. They’re often faster-growing, more nimble, more innovative, under-covered and under-appreciated, and therefore should perform better
Of course, factors don’t work all the time (value has been pretty bad since the 2008 crisis), so perhaps this is just a blip.
- But then why is it just a US phenomenon?
The obvious point is the one made above – the dominance of US tech stocks.
- But it could also be higher interest rates.
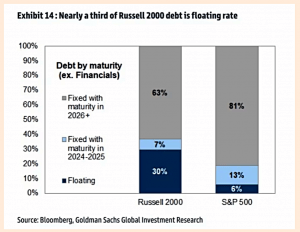
Smaller companies are hurt more by higher interest rates, because of their greater relative debt burden — their aggregate net debt currently stands at more than three times earnings, compared with under two times for large companies.
While larger US companies mostly borrow long term at fixed rates through the bond market, smaller companies carry more floating-rate debt, which has become much more costly. They also have debt coming due over the next year. If interest rates stay at their current level, it will translate into a 32 per cent hit to earnings over the next five years.
Robin has four ore explanations: indexing, quality, PE and coverage.
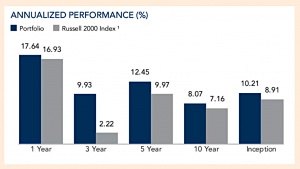
Dimensional Fund Advisors started a small-caps index fund based on the theory that smaller stocks helped investors diversify their exposures. But this fund has done noticeably better than its Russell 2000 benchmark, despite being basically a passive fund.
The Russell indices are formulaic and are reconstituted once a year.
Hedge funds and trading firms will try to front-run weighting changes, demotions and promotions. Moreover, the massive surge of trading — the Russell reconstitution day is reliably the most hyperactive stock market day every year — means volatility and heightened transaction costs for small-cap funds that have to rebalance on the day.
This leads to a headwind of 0.86% pa for the index.
The second issue is deteriorating quality:
The five-year growth rate of the Russell 2000’s earnings per share has been 14.4 per cent, compared with the large-cap Russell 1000’s 15.23 per cent.
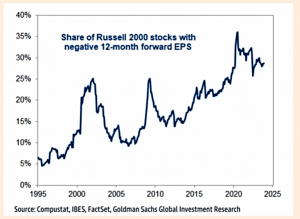
But profits are disappearing:
Almost a third of all Russell 2000 companies are now unprofitable, compared with about 5 per cent two decades ago.
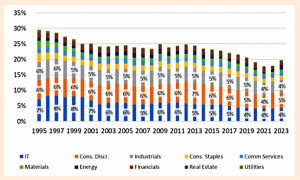
This is partly down to compositional changes:
Two decades ago healthcare stocks made up about 5 per cent of the benchmark, and most of them were stolid, reliable companies. Today, healthcare accounts for almost 16 per cent of the index, and most are high-risk, unprofitable biotech stocks.
But even excluding healthcare, quality (as measured by gross profits to assets) has been declining.
If you exclude the tech bubble years, the long-term average net debt to earnings has been about 2 times. Today, it’s more than 3 times. That makes small caps structurally more fragile. It’s basically the slow Aim-ification of the once-vibrant US small caps universe.
PE is also an issue.
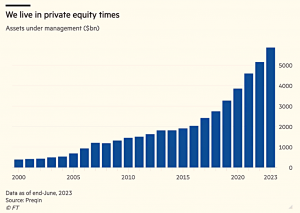
Leveraged buyouts are still mostly a small- and mid-cap phenomenon. And that gives small but fast-growing, ambitious companies an option that didn’t really exist when the small-cap concept was born in the 1980s.
It’s much easier to stay private for longer. More IPOs of weaker companies and frequent exits by stronger ones explain much of the membership churn and deteriorating quality of US small caps.
Small caps have less analyst coverage than large caps:
The median Russell 2000 stock is only covered by five analysts — and one in seven has only one analyst or no coverage whatsoever — compared with the 18 analysts who track the median S&P 500 stock.
But the gap has closed since the 1980s.
There is far more research and information on smaller US companies than ever before. That means they are not systematically trading at unfairly cheap prices.
Liquidity in (US) small caps has also improved.
- So it’s likely that some of the small-cap premium is gone forever.
Robin is not optimistic:
Just because something is cheap doesn’t mean it can’t stay cheap, or get even cheaper. If this is fundamentally a quality problem, the quality of the Russell 2000 has to improve before its performance does.
Retail ETF investors
Joachim Klement looked at the behaviour of retail ETF investors.
- He is a fan of ETFs.
The proliferation of ETFs has given retail investors unprecedented access toliquid, low-cost, broadly diversified portfolios.
But not of inverse and leveraged ETFs:
[These] complex products have no role to play in a portfolio except to make short-term bet.
I don’t agree with that, but let’s park it for now.
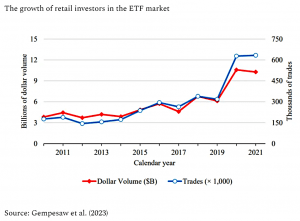
A recent study looked at US ETF trades between 2010 and 2022.
Retail investor trading volume has more than doubled to $5.8bn per day. This compares to $52.4bn daily trading volume for non-retail trades. The market share of retail investors is thus 10%.
That’s higher than I expected.
- And retail investors hold their positions for longer than professional investors.
Among professional investors a lot of the trading activity is driven by hedge funds and asset managers using ETFs for tactica ltrades. Retail ETF investors are not day traders. The majority of the ETFs they buy remain in their portfolio for more than a quarter.
The study didn’t look at holding periods longer than that.
The performance picture is not so good:
- For core equity ETFs, retail trails by 0.22% per quarter – less than 1% pa, so not disastrous.
But for leveraged and inverse ETFs, performance is worse:
On average they underperform the professionals by 3.8% per quarter for leveraged ETFs and 4.2% per quarter for inverse ETFs. That’s about 15% of underperformance annualised!
And retail investors use inverse and leverage ETFs more than professionals:
Among retail investors, 12.4% of all trades are in leveraged ETFs. Among professional investors, only 5.5% of all trades are in leveraged ETFs. Similarly, retail investors have 5% excess volume in inverse ETF.
21.2% of all retail ETF trades are in leveraged or inverse ETF. This compares to 28.6% of all trades that are in core equity ETFs. Retail investors gamble too much with ETFs.
This we can agree on, but I’m less convinced by Jochim’s idea that the underperformance is related to the longer holding period and the implication that all these complex products lose money when held for more than a day.
- You certainly need to be careful with them, and I wouldn’t expect them to make up 12% of all trades.
But sensible levels of leverage (we’re talking about 15% rather than 200%) can be used successfully as part of systematic strategies.
- I think the biggest problem that retail investors have is that they are not systematic.
They have been trailing professionals for many decades before leveraged and inverse ETFs were available to them.
Overpaid tax

For FT Advisor, Tara O’Connor reported that £42M in overpaid tax on pensions was returned to 13,000 pensioners during 1Q24.
- I am one of those who overpaid, though I won’t get my own refund until I submit my self-assessment, and even then there is typically a six-month delay.
As we’ve discussed before, your first withdrawal each year (and I only make one UFPLS claim) is taxed using an emergency code which ignores your annual allowances and dumps a lot fo the cash into a higher rate band.
- I could get around the problem by making several withdrawals (so that later applications are processed correctly) but it’s so difficult to make a withdrawal (several forms, including paper, post and signatures in ink) that I can never bothered.
The problem has been highlighted for around a decade, but nobody in the government or HMRC seems to care.
Labour watch
The big news this week was the announcement that Labour would renationalise the railways.
- In her Spectator newsletter, Kate Andrews pointed out that:
Labour’s plan is not much of a plan at all. Rather, it is a list of goals: to eliminate ‘fragmentation, waste, bureaucracy’, to ‘bring down costs for taxpayers’ and to ‘drive-up standards for passengers’. All lofty ambitions; all lacking a strategy.
Better trains for less money? Sign me up.
- On the other hand, I see no reason to believe that the current opposition will be able to deliver this.
The two new associated quangos – Great British Railways and the Passenger Standards Authority – point to lower rather than higher efficiency.
- It will be popular, though, especially with people too young to remember the previous incarnation of nationalised services.
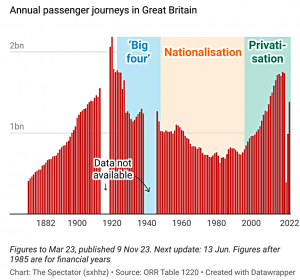
Kate provided a handy chart of passenger numbers:
Politicians promise ‘investment’ in practically every area,but if you follow the direction the money ends up flowing, it (of course) ends up propping up vote-winners such as the National Health Service and the state pension. The story of the past 30 years is a half-hearted attempt to make capital investments which almost always get sidelined
for more day-to-day spending.
Labour has also committed to maintaining the triple lock on the State Pension (SP).
- But the other side of this promise is that in order to keep the cost of the SP down to manageable proportions, the SP age (SPA) needs to rise with life expectancy.
Labour has been silent on this issue, but union leaders have called for the planned increase to age 67 (due in 2026) to be scrapped.
- Watch this space.
Quick Links
I have just one for you this week:
- John Mauldin started An Inflation Conversation.
Until next time.


