Options 8 – ERN Part 3
Today’s post is the eighth in our series on options trading. We look at a couple of posts from ERN that were published after we started the series.
Contents
The story so far
The lessons from the articles so far were getting to be quite extensive, so I have moved them to their own page.
Surviving a bear
The first of ERN’s posts that we will look at is from June 2020, so after the Covid crash and sharp recovery.
- In fact, the post is about how ERN’s strategy coped with the sharp bear market.
Remember that ERN retired young – I found him because of his terrific series of posts on withdrawal rates.
- Since he anticipated a very long retirement (perhaps 50 years) he wanted to be certain about failsafe withdrawal rates.
Even though he no longer has an income, ERN has around 35% of his net worth, and 50% of his taxable assets, in his options strategy.
The strategy involves writing (=selling/shorting) put options on the S&P 500 index with a little bit of leverage. And one can also keep the majority of the account in income-producing assets (bond funds, preferred stocks) to generate additional cash flow.
Delta
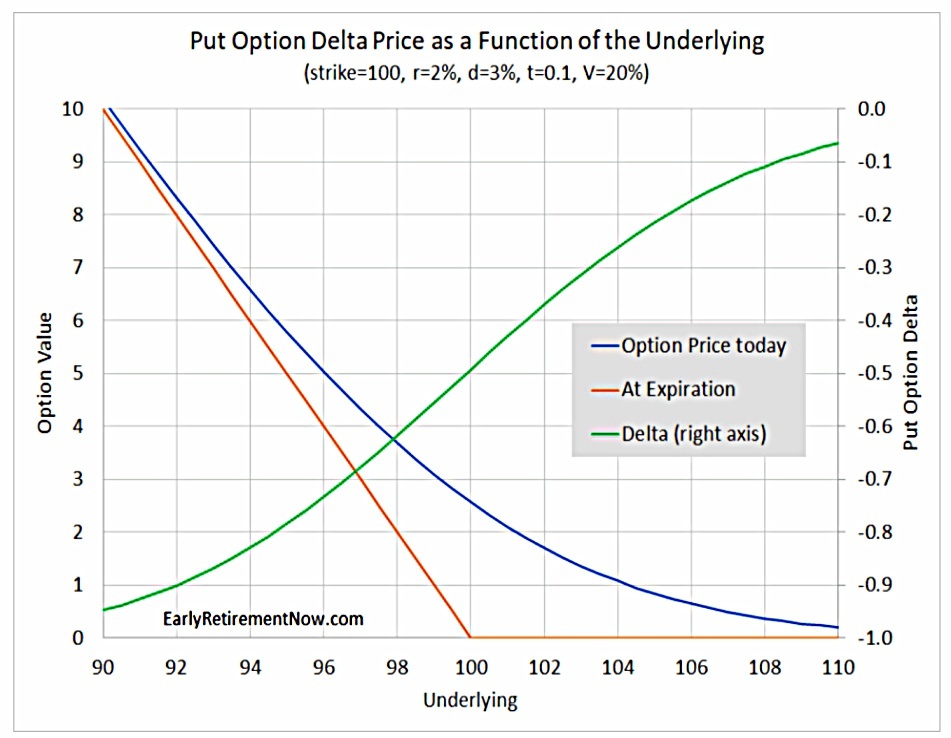
To explain how he handled the 2020 bear market, ERN has to go deeper into option theory.
- First up is delta.
Mathematically, it’s the derivative (slope) of the option price with respect to the
price in the underlying, ceteris paribus.
So for small moves, it’s the sensitivity of the option price to changes in the underlying price (assuming no change in implied volatility, the risk-free interest rate, dividend yields etc).
- ERN notes that delta is also a rough estimate of the probability that the underlying will fall below the strike price (for a put) or rise above it (for a call).
With large market moves, the delta will change (the rate at which the delta moves is known as gamma) and so will the implied volatility (the change in option price from volatility is vega, which ERN notes is not a greek letter).
ERN monitors his delta, both on individual positions and his overall portfolio.
If I have a portfolio Delta of 30 it means my portfolio moves $30 for every SPX index point. Interactive Brokers provides that figure on the main portfolio overview page.
Strike prices
Delta also helps ERN pick his option strike prices. He uses five methods:
- Fixed yield
- ERN’s strategy yields 5% which he levers up to 12% (2.4X)
- He loses 7% to put options that go into the money and gains 4% from the fixed income part of the portfolio – so he targets 9% pa
- With the S&P at 4000, a 5% yield is $200 (per contract)
- That’s around $4 per week, spread over three trading days.
- Fixed Delta
- ERN targets a delta of 5 (-0.05 for his puts)
- Fixed Delta x (SPX) volatility
- This means a lower delta when stocks are volatile
- Fixed multiple of a recent bad daily drop
- This is like a manual version of ATR
- If a bad recent drop was 80 points, ERN would target strikes that were 160 points out of the money (for his two-day holding period)
- Fixed percentage below the index level
- No matter how low volatility (the VIX) goes, ERN won’t write puts within 1% of the market
2020 bear
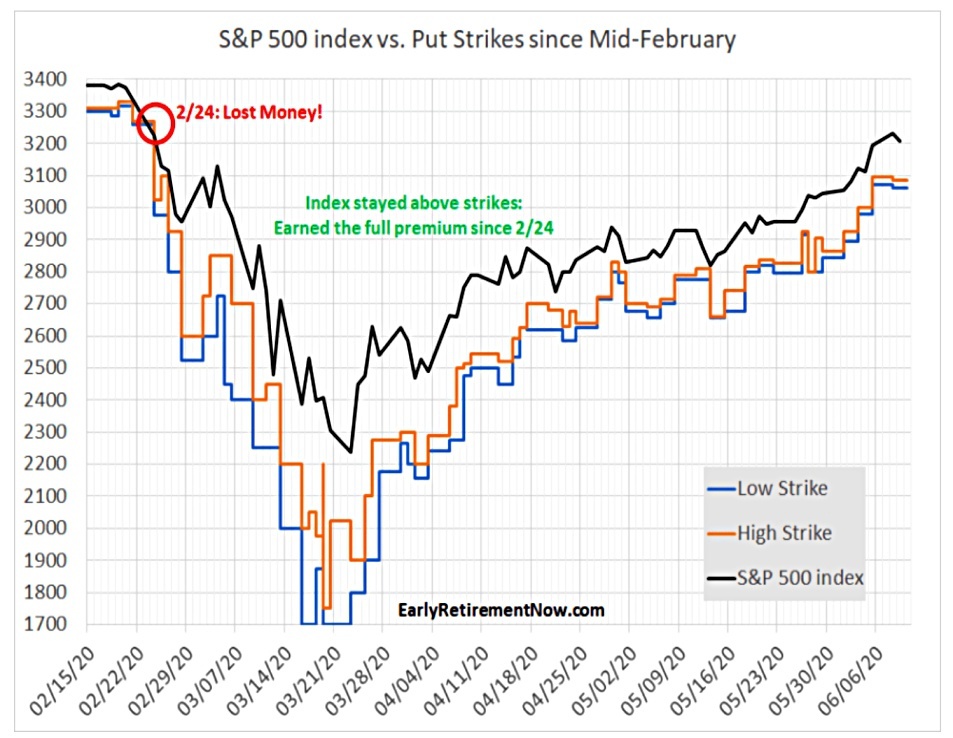
ERN had some small losses in Jan and a big loss (40 points) on Feb 24.
- With the index around 3000, his target return was $3 per week, so he lost around three months of profits.
After this, everything worked.
After a major loss, implied volatility and thus put option prices skyrocket. Insurance becomes more expensive when the house is already on fire!
Which in turn means I can sell my options far enough out of the money (strikes below
the current index level) that even with the crazy market gyrations in March 2020 the
index never went below my put strikes again.
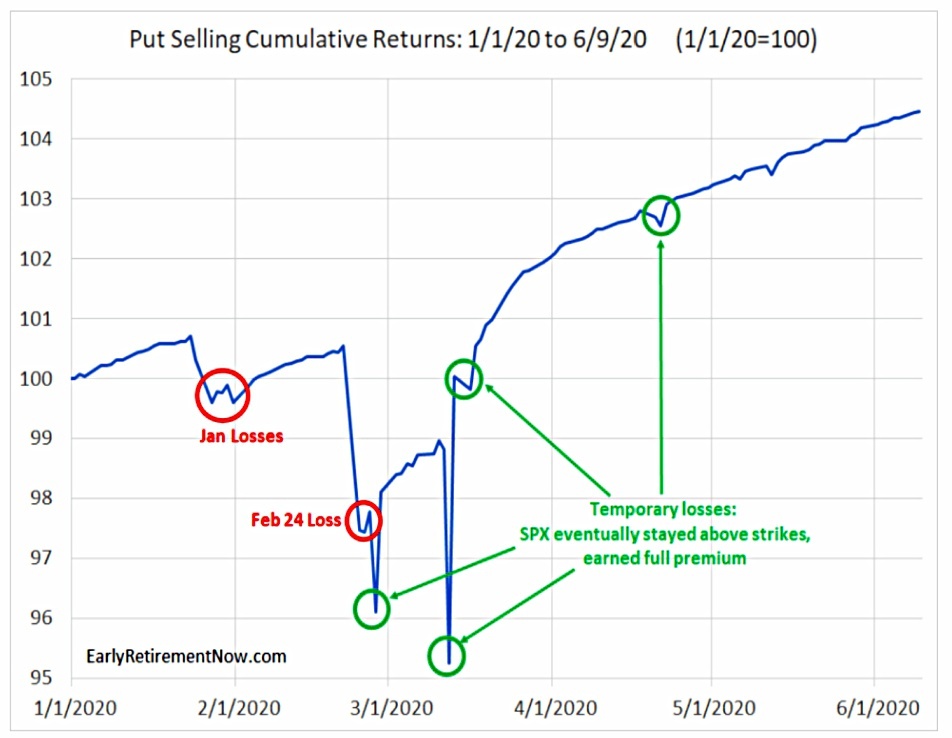
ERN recovered his losses by mid-March, and when he wrote the post in June he was up by 4.5% for the year (well ahead of target).
- Unfortunately, ERN had moved the rest of his option portfolio into risker investments (preferred shares), and this portion fell by 4% to bring his overall YTD returns back to almost flat.
ERN boosted his option returns through four factors:
- He sold at higher yields (more out of the money, because premia were higher)
- He sold more contracts than usual
- He sold extra options on his (usual) non-trading days
- He sold some options with same-day expiry
A week later
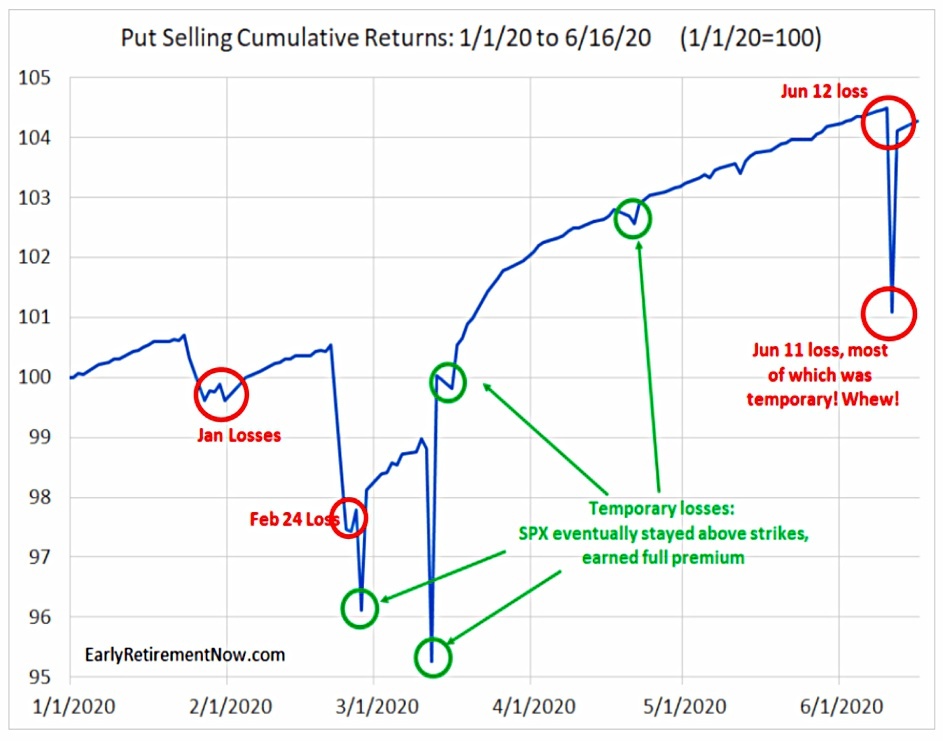
A week later, (( In a post on backtesting which we’ll come to next time )) ERN was back with an update on the Jun 12th volatility spike.
- He suffered a nasty loss but recovered.
The big drop occurred on Thursday, only one day into the 2-day option trade. But luckily, the market recovered again on Friday and only half my put options landed “in the money.” So the loss was manageable.
Shorting long-dated options
Posts 5 and 6 in ERN’s options series were backtesting, which we’ll come to next time.
- Post number 7, the most recent (from May 2021) looked at shorting log-dated options.
A reader had written in suggesting that since the S&P 500 rarely falls by 50% in a year, writing (selling) puts that are 60% below the market should be profitable.
- In May 2021, with the index at 4181, selling the June 2021 put at a strike of 1700 would generate 26% over 13.5 months (23% pa at the minimum margin).
Even with a generous margin deposit, the return is close to 7%.
- But is it safe?
The long term
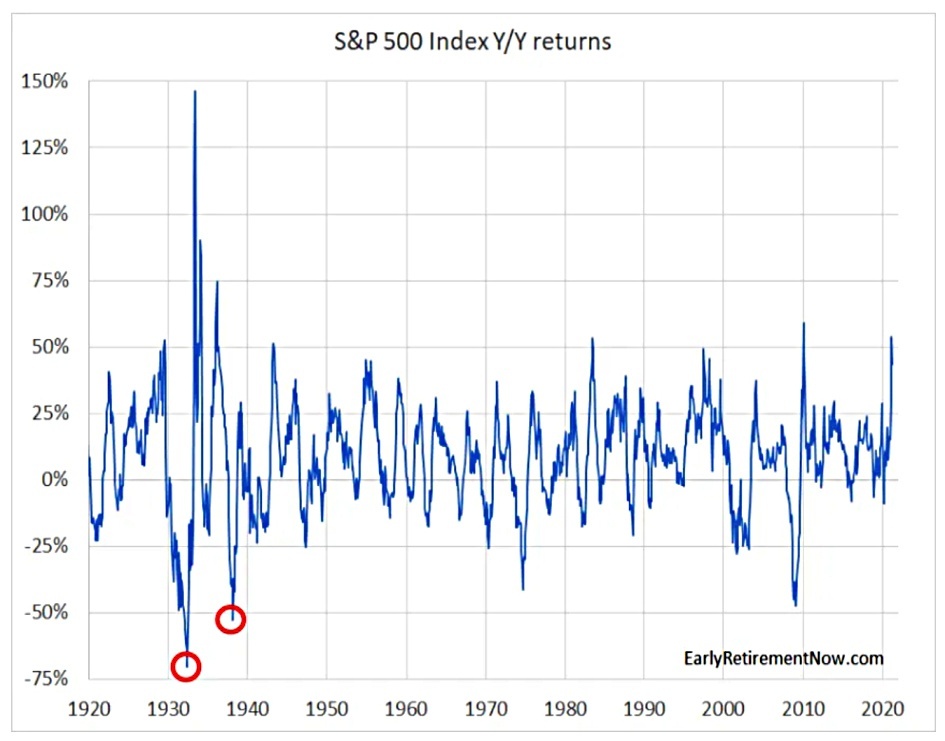
Going further back, the S&P 500 lost 70% in the year to June 1932, and there was another loss of more than 50% later in the decade.
A once-in-a-hundred-year event that can wipe out the entire portfolio is certainly
something to worry about. One single accident like that can wipe out an entire century of gains!It’s less of a problem when that happens after 100 years when I’m already dead. It’s more of a problem if that accident happens over the next 30 years. A 30% risk of blowing up the portfolio over a 30-year horizon is not acceptable!
Delta again
The error here is to assume that because the valuation on the end date (at option expiry) is favourable, it must be favourable along the way.
I once took a flight from Atlanta to Zurich, and the weather in Atlanta was nice and the weather forecast for the destination was mostly sunny. That didn’t prevent bad weather along the way, including several people around me filling up their barf bags.
Remember that the delta is an approximation for the probability that the underlying drops below the strike price.
I calculate the Delta of this particular option as -0.01464. Thus, a 10-point drop in the S&P will likely result in a $14.64 loss in your short option position (100x multiplier).
A 0.24% drop in the index will still cause a drop in your portfolio by about 0.1% if
you keep $15,000 in margin cash. The claim that you can generate 6.8% completely risk-free goes out the window!
With the minimum margin of $4400, the 0.24% drop in the index gives a 0.33% fall in portfolio value.
Your options portfolio is indeed more volatile than simply holding a 100% S&P 500 index portfolio.
A 273 point drop in the S&P (6.5%) would lead to a margin call.
More greeks
The Delta itself will change as the underlying moves (Gamma effect) and when the market drops we also observe a boost in the implied volatility of the option (Vega effect). Both the Gamma and the Vega effect will boost the price of the put option and thus your losses when shorting it.
And a large enough stock market drop in the first month alone can still wipe out the entire account, even if a 12-month return of -60% never materializes.
For example, the 12% drop in the S&P in March 2020 would reduce the value of this option by 36%.
ERN documents the six worst months for the proposed strategy:
- August 1998: Russia Crisis, LTCM (no recession, no Bear Market)
- Both September and October 2008: Global Financial Crisis (recession+bear
market) - August 2015: Chinese Devaluation (no recession, no Bear Market)
- October 2018: Q4 scare, growth concerns, monetary policy uncertainty (no
recession, no Bear Market) - February 2020: Global Health Crisis (recession+bear market)
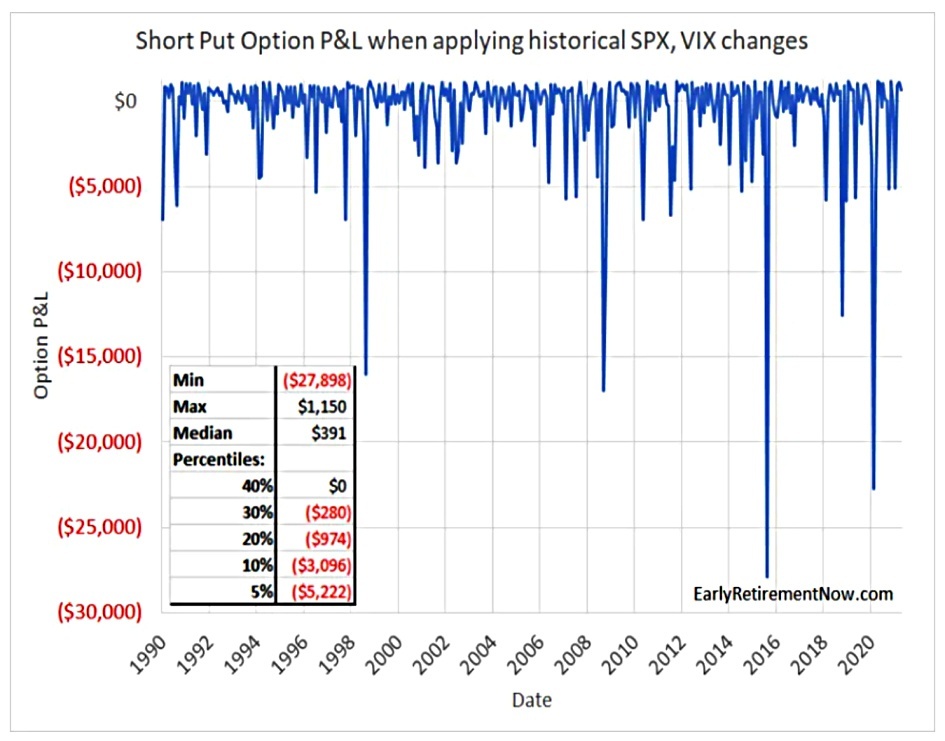
Around 40% of ERN’s calculated SPX and VIX changes lead to losses from the short put position.
- Which is around the same hit rate as holding the index.
Using intra-month data makes things look even worse.
Option strategy marketing
ERN generalises to the marketing of most “get rich quick” option schemes:
- They calculate returns using minimum margin
- You probably need three or four times as much
- They use gross option revenues without accounting for losses
- ERN has a 64% success rate but assumes 40% losses
- They ignore the journey and show where the underlying needs to be on the expiration date
Conclusions
The lessons from today are pretty straightforward:
- ERN’s strategy coped fine with the Covid volatility in 2020
- Don’t write long-dated, well out-of-the-money put options on the index.
Until next time.
Mike Rawson
Mike is the owner of 7 Circles, and a private investor living in London. He has been managing his own money for 40 years, with some success.