Options 9 – ERN Backtests by Spintwig
Today’s post is the ninth in our series on options trading. We look at a couple of posts from ERN that were published after we started the series.
Contents
The story so far
The lessons from the articles so far were getting to be quite extensive, so I have moved them to their own page.
2018 to 2020
ERN has written four posts on options since we started this series. We covered two of them last time out:
- ERN’s strategy coped fine with the Covid volatility in 2020
- Don’t write long-dated, well out-of-the-money put options on the index.
The other two posts, which we’ll look at today, are guest posts from Spintwig.
If you don’t know Spintwig, he also retired in 2018 (at age 30!!!) from a career in IT and now writes about FIRE and options strategies at his blog.
He does a lot of interesting and important work, including careful and comprehensive back-tests of different option trading strategies.
We’ll look at Spintwig’s site later in this series, but for now, let’s see what he had to say about ERN’s strategy.
Spintwig
Like me, Spintwig found ERN through his work on safe withdrawal rates.
- He found ERN’s idea of selling puts on the S&P 500 in order to mitigate sequence of returns risks interesting.
I wanted to know if there was an optimal approach or if it could be applied to other indices and have similar results. Would it be advantageous to replace a traditional buy-and-hold portfolio with an options trading strategy?
He couldn’t find the answers he wanted on the internet, so he started to do his own research (backtesting) and publish the results.
Spintwig (ST) is clear about his success criteria:
There are two key attributes to keep in mind when evaluating performance: compound annual growth rate (CAGR, or sometimes called geometric return) and volatility. The timing and severity of volatility is the driving factor behind the sequence of returns risk.
ERN’s rules
Here’s a reminder of ERN’s system:
- Positions are opened every Monday that expire on Wednesday, Wednesday that
expire on Friday and Friday that expire on Monday - Positions are held until the expiration
- ST also looks at closing trades at 50% max profit
- The time value target is roughly equivalent to a 5-delta position
- ST uses 5 +/- 0.5
- 2-2.5x leverage is used
- ST tests different levels of leverage
- The underlying is SPX (the S&P 500 index).
- ST used SPY (the S&P 500 ETF) instead so that the strategy worked with smaller accounts
The backtest
ST used three benchmarks:
- 100% SPY
- 80/20 SPY/IEF (a 7-10 year Treasury ETF)
- 60/40 SPY/IEF
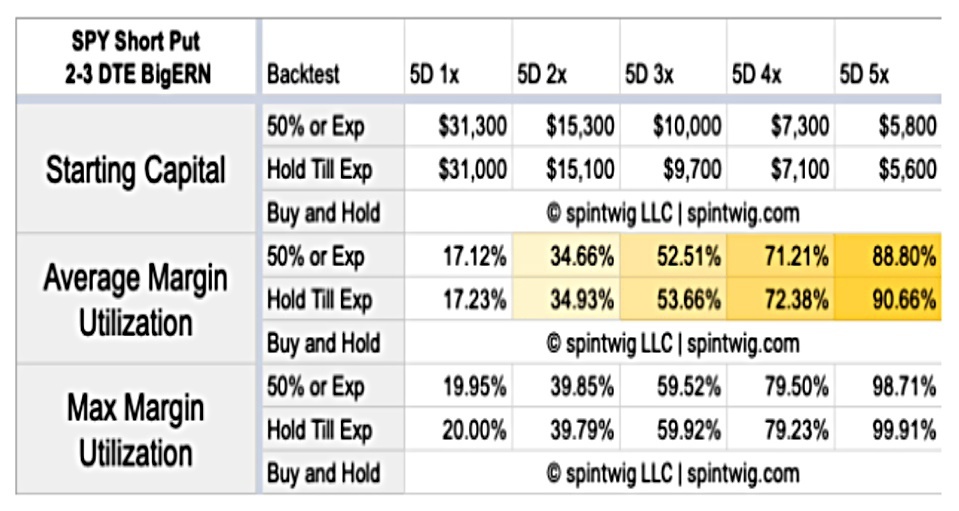
ST backtested with data from 21 Feb 2018 to 5 Jun 2020.
- The start date is when Monday-expiring weekly options on SPY were introduced.
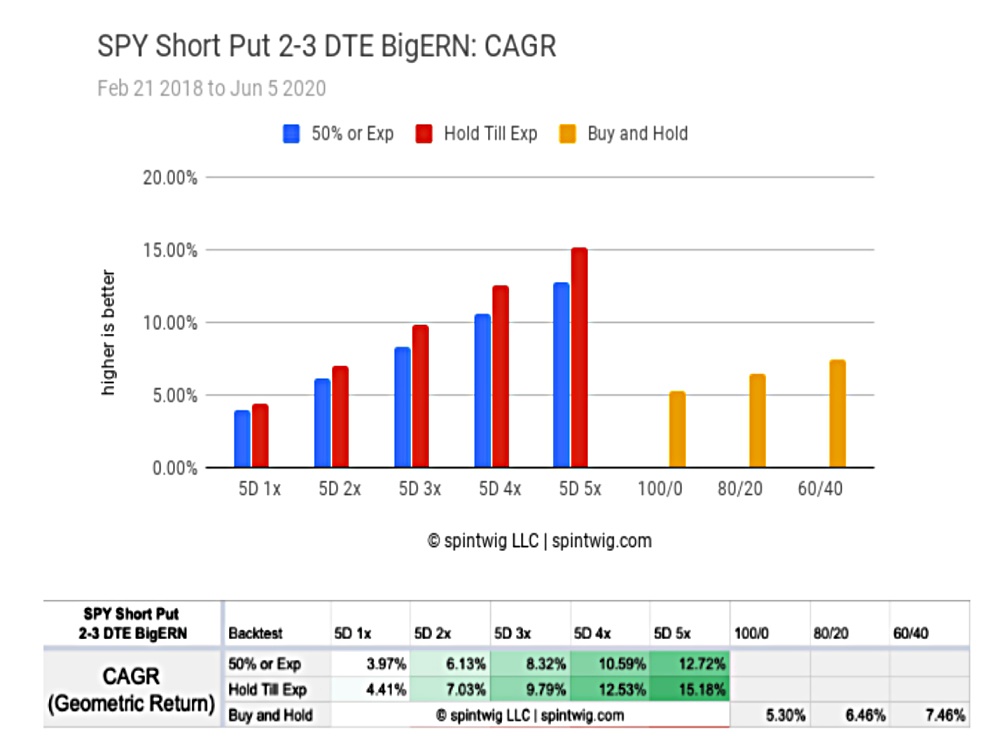
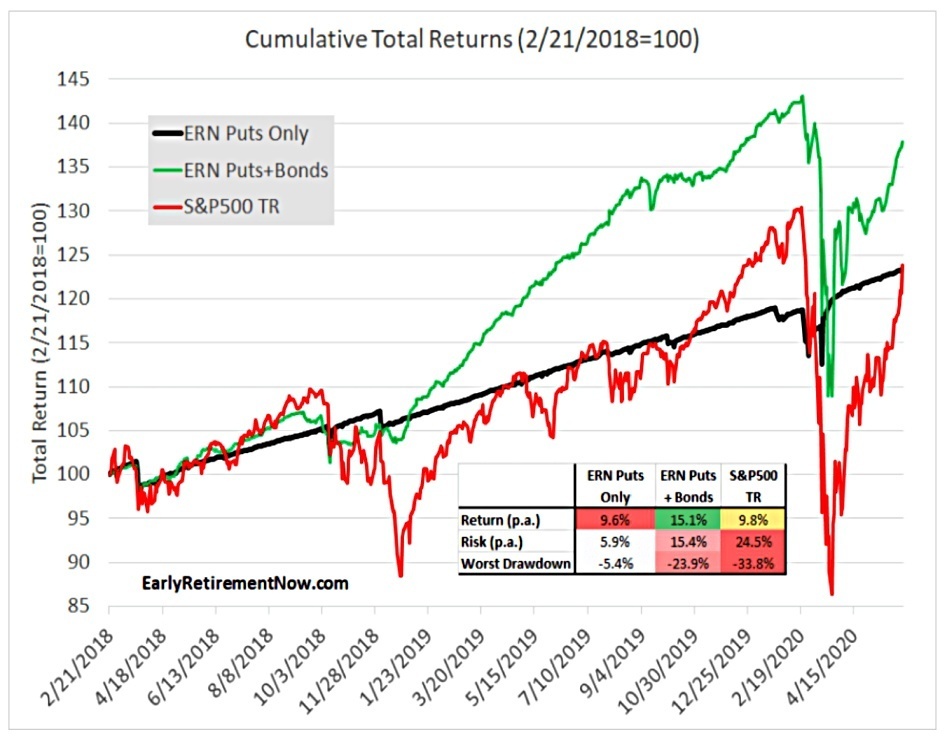
- The top benchmark is 60/40.
- The 5D 2x strategy does slightly worse than this but beats the other two benchmarks.
- ERN’s leverage is around 2.4x, so his strategy should beat all the benchmarks.
- Higher leverage boost profits further.
- Exiting trades at 50% max profit lowers returns.
- If you do close early, you should open more positions so that you don’t have flat days.
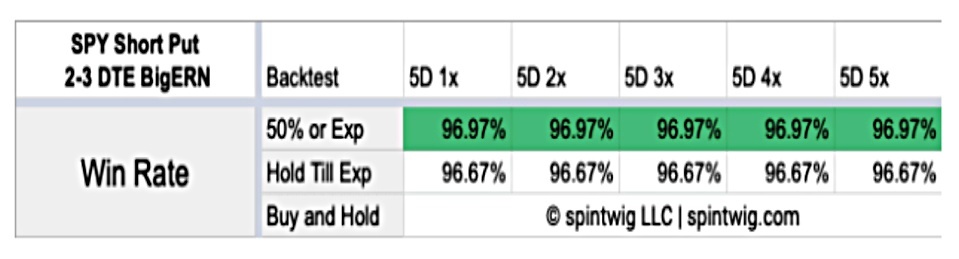
ERN’s win rate is more than 96%, but net profits are only 55% of the total premium.
Just 3.33% of the trades wipe out nearly half of the gains!
The backtest included 330 trades, of which 11 were losers.
- The average win was $13.29 and the average loss $163.45
- The biggest win was $93.50 and the largest loss was $428.50

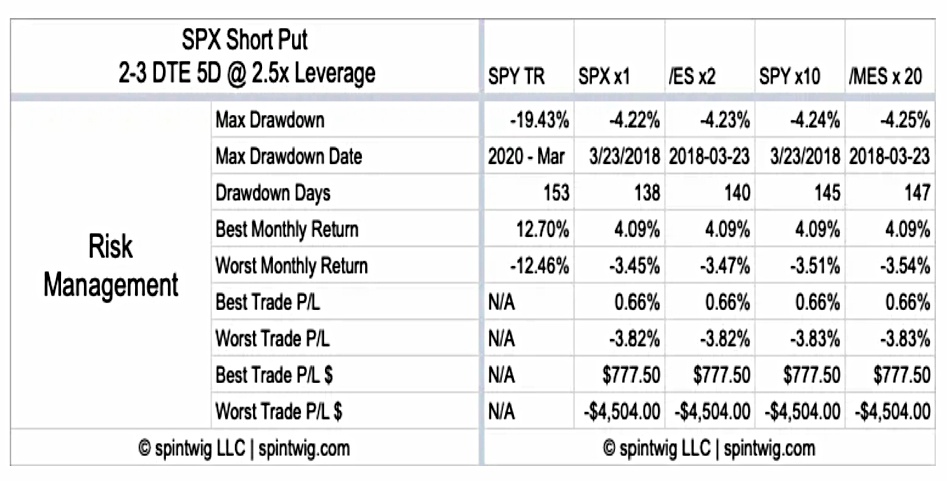
The options strategies are much less volatile than buying and holding, though increasing leverage adds to their volatility.
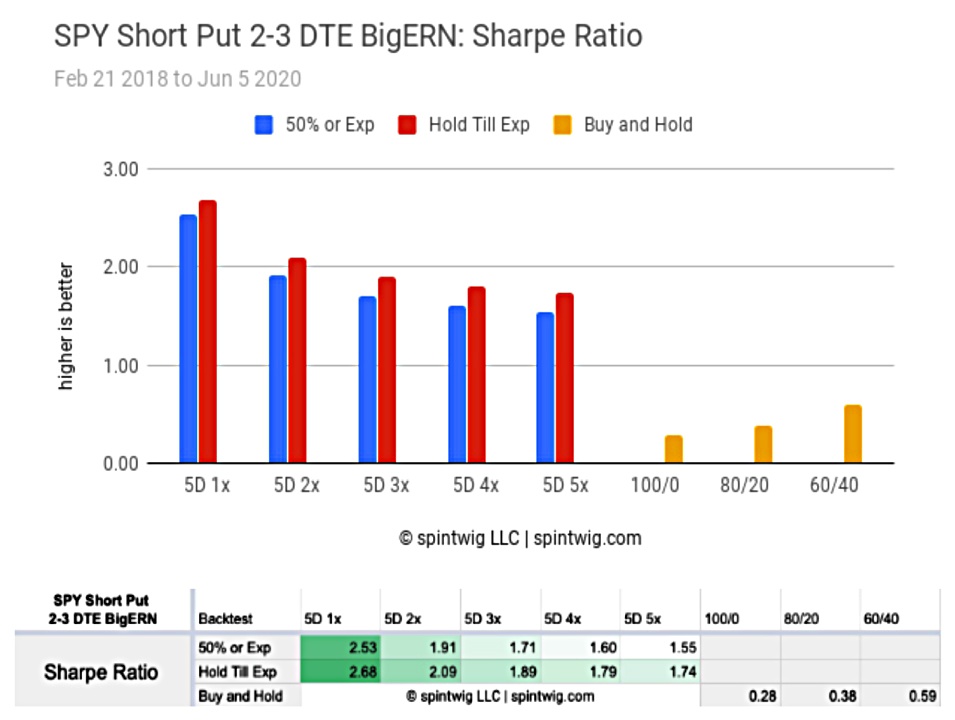
All the options strategies have higher Sharpe ratios than buy-and-hold, but increased leverage leads to lower SRs.

All the options strategies have better max drawdowns than buy-and-hold, but increased leverage leads to bigger drawdowns.
- ST notes that this is why ERN’s strategy mitigates the sequence of returns risk.
ERN comments

I don’t strictly adhere to the 5-Delta rule. I started out with a slightly higher Delta but I’ve since scaled it back a little bit from a 6 to 7 Delta to a ~5 Delta. Occasionally I’m operating at a much lower Delta. Those periods coincide with the vol spikes.
I keep some additional interest and dividend-paying assets in my portfolio. I had return and risk values just below the 3x strategy in Spintwig’s simulation even though I was running this at only about 2.4x leverage.
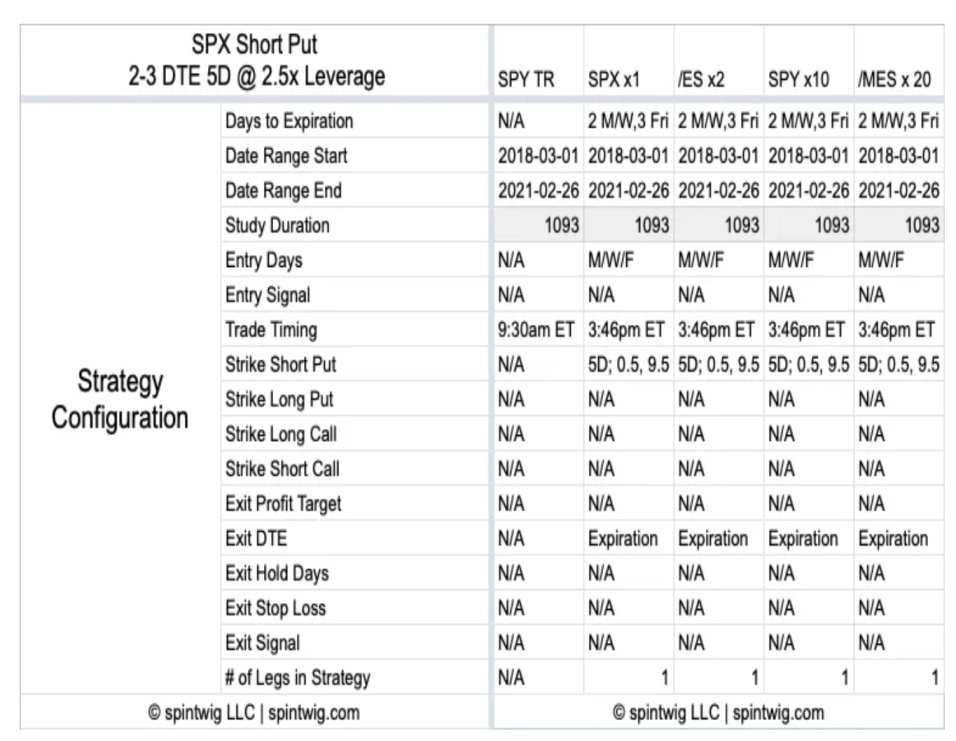
Different contract sizes
ST’s second guest post is about using different contract sizes so that smaller accounts can join in. As ERN says:
Trading CBOE SPX options, with a multiplier of 100x on the underlying S&P index, even one single contract will have a notional exposure of roughly $400,000. I don’t recommend trading that without at least about $100,000 or better $125,000 or more in margin cushion.
Options are scary, and it makes sense that people would want to get started using less than £100K.
- ERN agrees but has always been worried that transaction costs on smaller contracts would eat up the returns
There are three other contract sizes:
- ES Futures (50x, 1/2 the size of SPX = notional exposure of $200K when SPX is 4000)
- SPY ETF (10x, 1/10 the size of SPX = notional $40K)
- MES Futures (5x, 1/20 the size of SPX = notional $20K)
Commissions
Short option strategies that are far out of the money, defined as 5-delta or lower, generate a low amount of premium relative to higher-delta strategies. On a hypothetical 5-delta 3700 SPX 0DTE short put, one might generate $200 in premium.
ST works out that:
If it costs $1.32 in commission to open the position and we assume 55% premium capture , commissions represent 1.20% ( 1.32 / [ 200 * .55 ] ) of the strategy income.
Which is pretty good. But if we switch to SPY:
A middle-of-the-road commission cost for SPY at the time of writing is $.70 for a single contract. A comparable 5-delta 370 SPY 0DTE short put might generate $20 in premium. This represents a 6.36% ( .7 / [ 20 * .55 ] ) commission drag.
Backtest 2
The commissions used were:
- 1.32 USD per contract, all in, for SPX
- 1.42 USD per contract, all in, for /ES
- 0.70 USD per contract, all in, for SPY
- 0.47 USD per contract, all in, for /MES
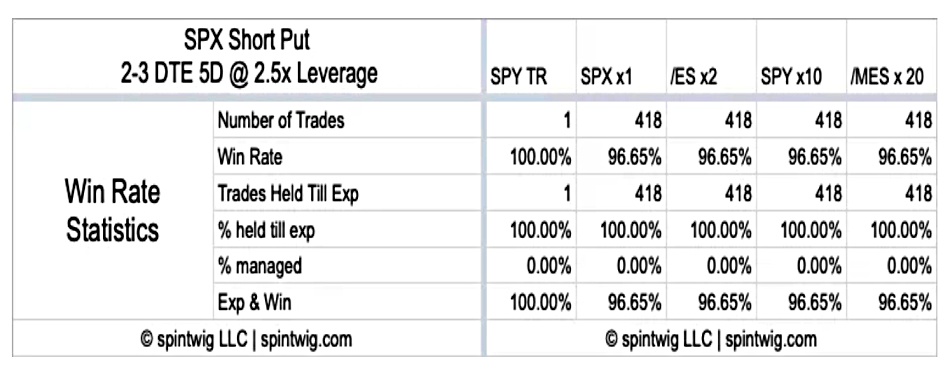
Win rates were identical.
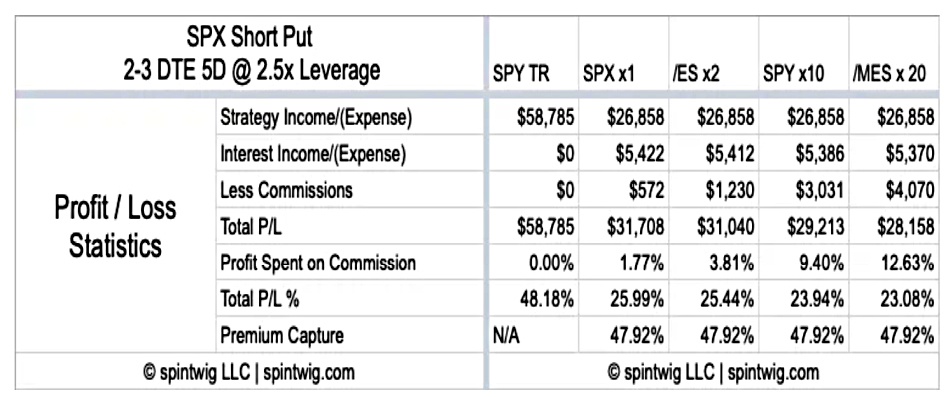
Commissions as a percentage of total P/L range from 1.77% to 12.63% for SPX and MES, respectively. That’s a difference of over 7x.
Commissions impact interest earned on the collateral, as well as the key portfolio stats (CAGR, Sharpe etc).
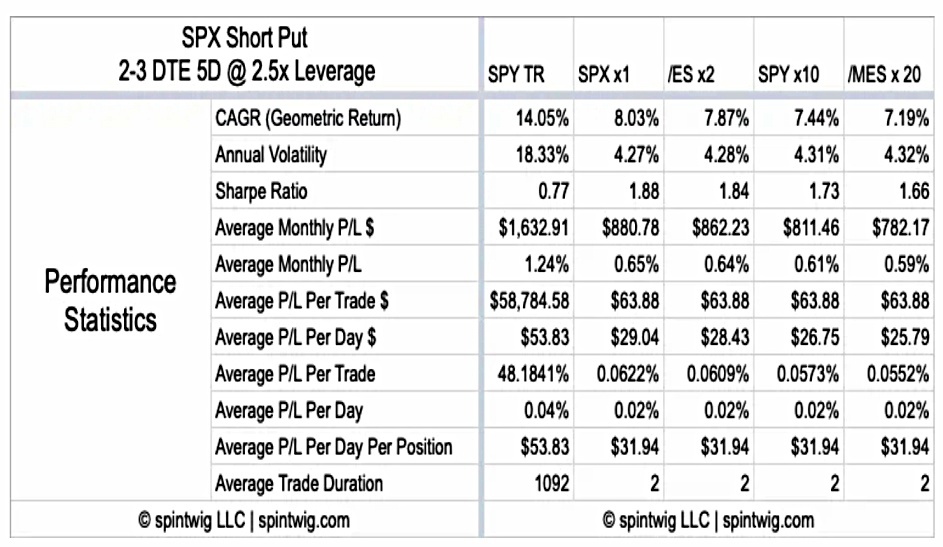
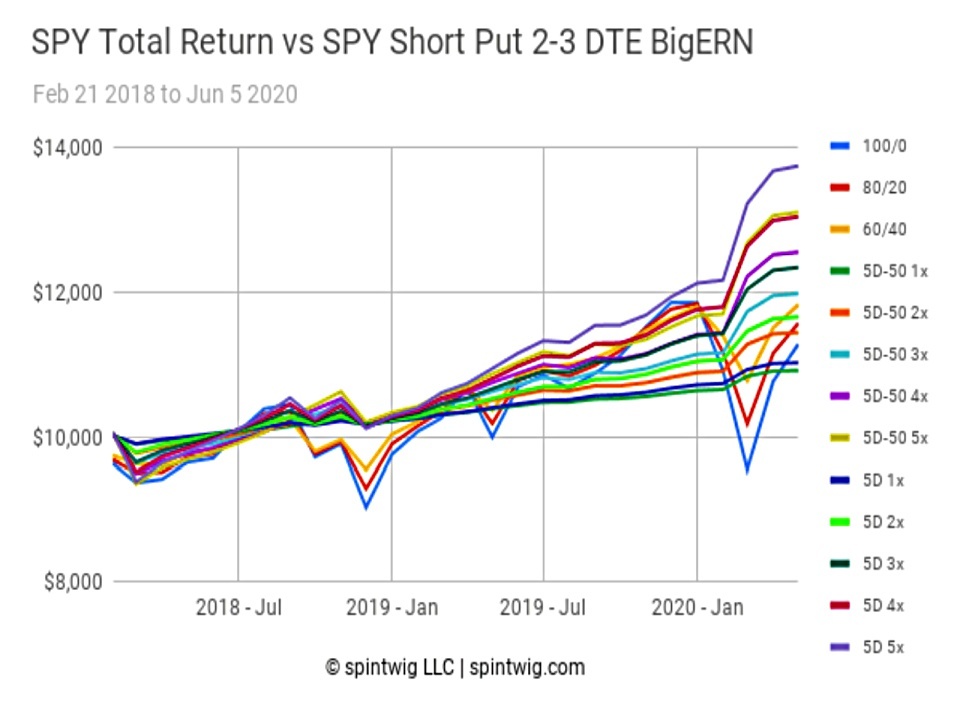
The returns graph is not great – the vertical scale compresses returns from all contracts:

As ST says:
The >10% drag on CAGR between SPX and MES appears nominal. However, as the duration of the study increases the impact will become more apparent.
Implementing the Big ERN strategy using notionally smaller instruments is viable but it may be more cost-effective to transition to a larger instrument if/when funds allow.
Ern’s comment
ERN is surprised that the smaller contract sizes are profitable.
I would not recommend running this permanently on such a small scale if the drag is more than 80bps p.a. But “getting your feet wet” and learning your way around trading options for a year or two seems like a path most readers can take.
He also addresses the criticism that in the months leading up to the post, his strategy has fallen behind the SPY total return:
Once you get closer to FIRE and certainly when you live off your assets during FIRE, you are looking for less-volatile investments, especially investments with mild and shorter-lasting drawdowns to hedge against Sequence of Return Risk.
I think this put option strategy fits very nicely into that niche and it’s exactly why my wife and I rely heavily on the income from the put options strategy in our own retirement. 4% annualized volatility, only about one-fifth to one-fourth of the S&P 500 looks pretty amazing!
By holding risker assets in the margin portfolio, we [are] achieving equity-like returns [with] only half the equity volatility. About 35% of our net worth currently funds our entire retirement budget.
Conclusions
Once again, the lessons from today’s post are pretty simple:
- ERN’s strategy is pretty good
- It has better returns, lower volatility, better Sharpe ratios and lower max drawdowns than buy and hold.
- Use the cheapest contract that you have the funds to support
- And monitor your results to make sure that the strategy is profitable for you.
Until next time.
Mike Rawson
Mike is the owner of 7 Circles, and a private investor living in London. He has been managing his own money for 40 years, with some success.