Weekly Roundup, 20th September 2021

We begin today’s Weekly Roundup with a look at Private Equity.
Private Equity

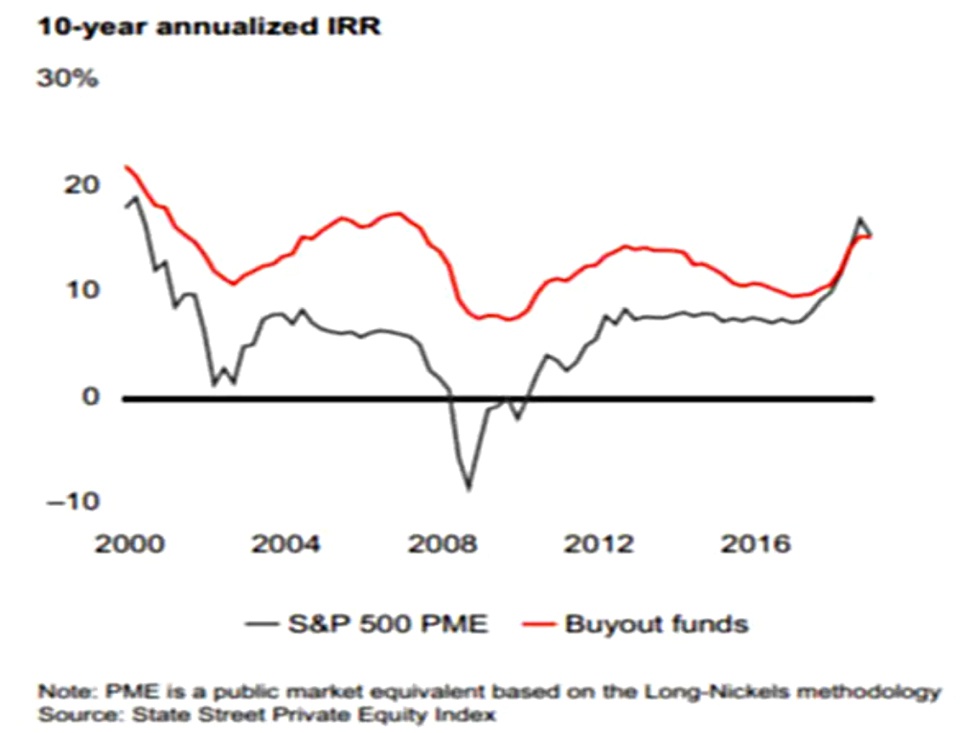
In the FT, Robert Armstrong looked back at a “meh” decade for private equity.
- He wanted to know whether PE has excess returns, and if so, where they come from.
He started with university endowments and David Swenson of Yale, who did a lot to popularise PE.
I think the private equity . . . where you buy the company, you make the company better . . . and then you sell the company is a superior form of capitalism. I’m really concerned about what’s going on in our public markets. I think short-termism is incredibly damaging.
The problem is that the outperformance is getting smaller and smaller.
Robert has three explanations that someone like Swenson might use:
- US stocks have had a great decade. Keeping pace with them is impressive;
- Of course the average PE fund doesn’t outperform stocks. You need to be with the best PE firms, with the most skill at improving companies’
operational performance, to see superior performance;- Higher returns are not the only virtue of PE. It’s the stability of those returns that sets this asset class apart
Number one is ruled out by PE’s use of more leverage than regular firms.
- Number two might be true, but it’s not much use to those of us who can’t access the top tier firms.
Number three is true but misleading.
- PE isn’t marked to market during a crisis, so it looks more stable than it is.
It’s the same reason that homeowners don’t fret about their leveraged position in the property market.
- But hiding risk can be bad:
When risk is hidden, investors seeking returns push it higher and higher until
something breaks.
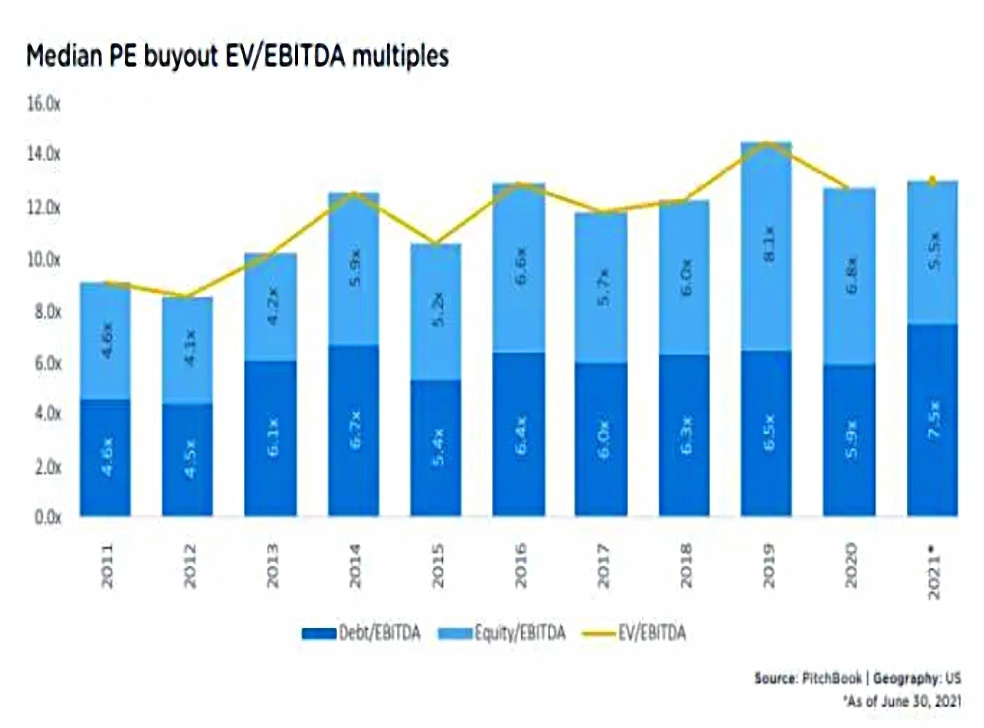
The trend is buyout leverage is up from 4.5 times EBITDA a decade ago to 7.5 times this year.
Robert concedes that in a real crisis, PE firms are more likely to raise the capital to prop up their firms than small risky firms would be themselves.
- So PE could actually reduce volatility when it counts.
In a follow-up article, Robert concluded that PE is just leveraged equity.
The average debt/ebitda ratio for companies in the S&P 600 small cap index (most PE deals involve small companies) is about 3. The average debt/ebitda ratios of PE deals, according to PitchBook, is twice that.
Assuming an enterprise value/EBITDA ratio of 13, Robert calculates that levering up the index by a third would create synthetic PE.
- Put another way, PE’s risk-adjusted returns are lower than those from the S&P 600.
But you do have the crisis protection and safety buffer.
A lot of the value that PE creates comes from the fact that the investors’ money is locked up for many years. This gives the PE manager an option of when to buy, when to sell, when to invest cash, and when to pull cash out. Public companies, hostage to the share price, don’t enjoy this optionality.
This is why PE can use more leverage.
Cape 2.0

John Authers took a look at the continuing debate over the usefulness of the Shiller CAPE, which compares prices to inflation-adjusted earnings for the previous ten years.
- It has shown the market to be expensive for a long time and currently as more expensive than any time other than the dot com boom in 2000.
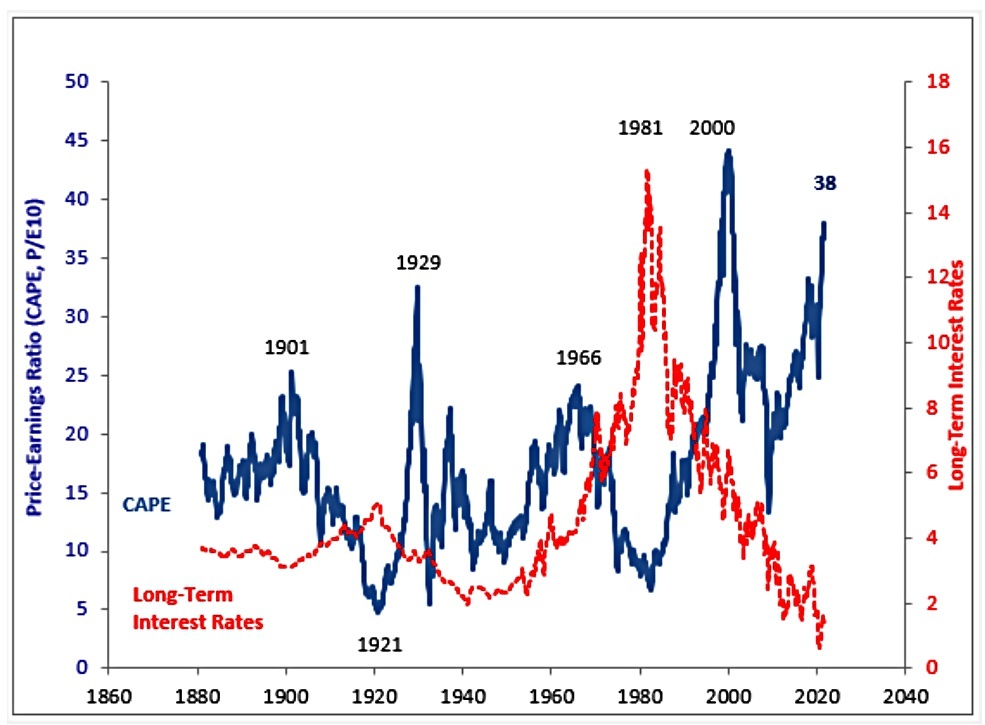
Of course, interest rates are much lower today, but does that justify the higher valuations?
- Damien Klassen from Australia thinks that Trump’s corporate tax rate cuts might be a bigger factor.
A change in the tax rate will change the multiple of earnings per share that people are prepared to pay. If earnings are $10 and there is no tax, then a $20 share price means a P/E of 2. If the tax rate raises to 50%, a $20 share price implies a P/E of post-tax earnings of 4.
He has a chart showing a modified CAPE (CAPE 2.0):
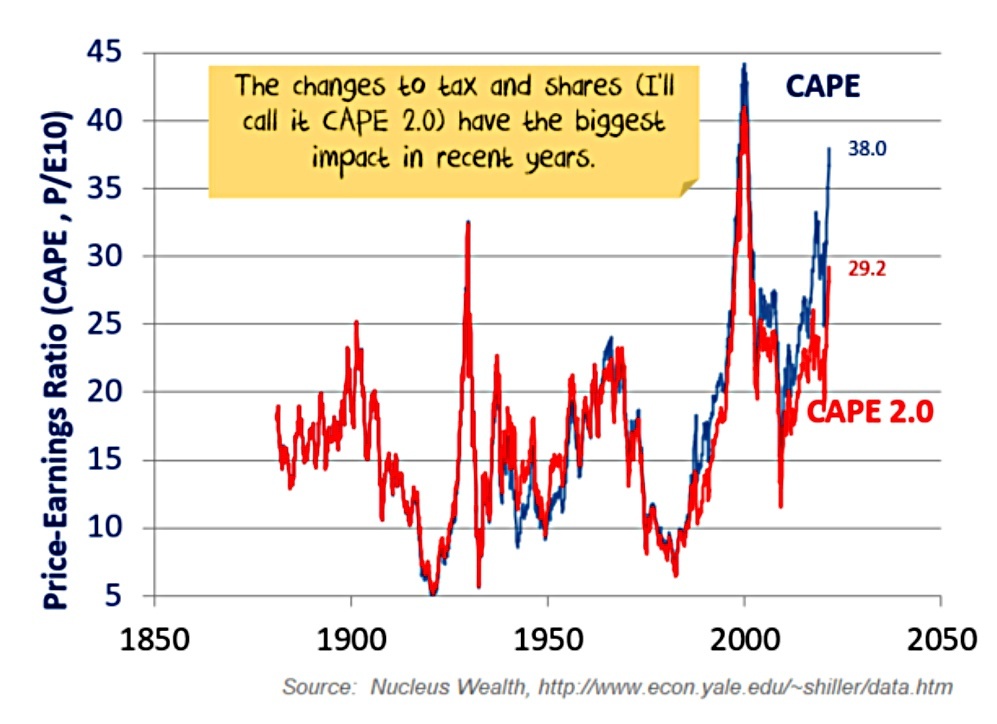
This still puts stocks as more expensive than any time other than 2000 and 1929, but coupled with low interest rates, the multiples now look more defensible.
John notes that a tax-adjusted CAPE was first produced by Alain Boboza or SG more than a decade ago, and is generally sceptical about adjusting Shiller’s numbers:
Accounting conventions have also changed over time, as has the use of share buybacks; intangible assets are far more important than they used to be; and so on. These changes tend to be gradual.
The key future variable could be interest rates, which is why future inflation expectations are so important.
Fair value

This week’s catchup with Klement looks at a series of three articles he wrote recently on the topic of fair value calculations.
He began with the idea that stock prices are not time-invariant – you wouldn’t expect to see a price chart in reverse.
The classic example is a market crash like the one in October 1987. If one would look at the chart in reverse, it would be a situation where the S&P500 slowly declines and then suddenly jumps more than 20% in one day. That doesn’t happen in real life.
Some people extrapolate this idea of “time’s arrow” to the Second Law of Thermodynamics, which states that systems drift towards a state of maximum entropy (chaos).
- Joachim uses the example of ink spreading through water – it will never separate back into the original drop of ink.
What this doesn’t mean is that markets drift towards an equilibrium of fair value prices.
Exactly the opposite – it is incredibly unlikely that markets will ever be close to fair value.
It’s basically about the average of all the possible future states:
There are far more states that correspond to the individual ink molecules spread out all over the jar than there are states that correspond to the ink molecules all closely next to each other.
So, the system will drift towards the most likely outcome which is one where the ink molecules are spread out more or less evenly across the jar.
Which when applied to an index, means:
The fair value of the S&P 500 is simply the weighted average of the fair value of all stocks in the index. But what is more likely to happen? That all the individual valuations of each stock in the S&P 500 line up in such a way that the result is an S&P 500 at fair value? Or that you get any number other than the fair value?
And the same thing applies to a single stock.
Fair value might still be useful if the price of a stock was mean-reverting towards fair value.
- This is the Ben Graham idea of the manic-depressive Mr Market.
Put another way:
A fair value model is useful for investors if the deviations of the share price from that fair value over time average out to zero.
The deviations would be drawn from a normal distribution (though since this is finance, we can assume that the tails are longer than they ought to be, and there is probably some skew).
- Joachim imagines a model where random good news bumps up the stock price and random good news depresses the price.
The problem with this is that since changes in price are multiplicative, not additive, equal variations in both directions lead to declining (and eventually, zero) wealth for the investor.
- After you lose 10%, you need to gain 11% to get back to where you started.
This has become known as the ergodicity problem.
Standard economics and finance theory (aka ‘expected utility economics’) assumes that the expected value of a financial or economic variable is the same as the long-term statistical average of individual observations. ‘Ergodicity economics’ is concerned with instances where this assumption is violated.
Of course, ergodicity disagrees with lots of finance, not just fair value.
If ergodicity theory is correct, the only modern investment approach that – as far as I can see – would survive the onslaught is momentum investing and trend following because that essentially makes no assumption about the fair value of an asset at all.
The third article looks at reflexivity.
If investors behave as if expected utility economics is true and random fluctuations even out over time, then they may make that a reality with their trading.
Joachim looks at a lottery experiment from Denmark which ran over two days.
- On day 1, subjects could gamble 1000 kroner on a coin toss where a win was 300 kroner and a loss was 200 kroner.
- Day 2 was a multiplicative gamble – a win was a 30% profit and a and a loss was 20%.
Under utility economics, subjects should behave the same way on both days.
But if participants changed their behaviour it would indicate that ergodicity economics is right and people understand that the path matters and they try to optimise ending wealth instead of returns.
They did change their behaviour, becoming more risk-averse.
Participants understood that in the face of 30% gains vs. 20% losses, their losses could increase dramatically over time and so they were much more reluctant to bet large amounts.
Joachim makes four other points:
- risk-aversion depends on circumstances
- the result helps to explain why most people’s portfolios are less risky than would be optimal
- it helps to explain why risky stocks have returns above safer bonds that are larger than utility economics predicts
- and why markets crash suddenly but rise slowly
Because people try to maximise ending wealth and not returns, they are simply refusing to enter gambles where they can lose a large amount of their wealth even if the expected return improves. And because many investors independent of their risk aversion refuse to participate in stock markets at the same time, the drop can be fast and furious.
This is all compatible with behavioural economics, but ergodicity economics doesn’t require this overly to explain “irrational” behaviour, since it views the behaviour as rational in the first place.
Social Care
There’s been a fair amount of guff written about the government’s social care proposals.
- The mainstream media seems obsessed with the idea that young people are paying for a service that old people will receive.
Which is exactly the way that the rest of the UK welfare system works.
- Single mothers don’t fund their own income, and nor do the disabled, nor cancer patients.
The whole idea is that those who don’t need a service fund those who do.
- And it would be pretty tough to fund end of life care solely from people who have already seen 75% of their days and who mostly don’t have an income.
In any case, I’m not convinced that the new deal is as generous as people think.
- A care home suitable for a “wealthy pensioner” costs around £100K pa where I live.
If we generously assume a 50/50 split between care costs and “hotel costs” (room and food), then the new £86K cap in user contributions will be hit in less than 21 months.
- I actually think the split is more like 30/70 with the bulk of the money going towards hotelling.
But if we split the difference and assume £43K is for care, we hit the new cap in exactly two years.
- Which is the length of the average stay in a UK care home.
So the average wealthy pensioner won’t gain anything from this – only extreme cases will benefit.
- And those guys will spend all their money on hotelling costs instead.
Care doesn’t become free until you have less than £20K in assets – or around 10 weeks of care costs.
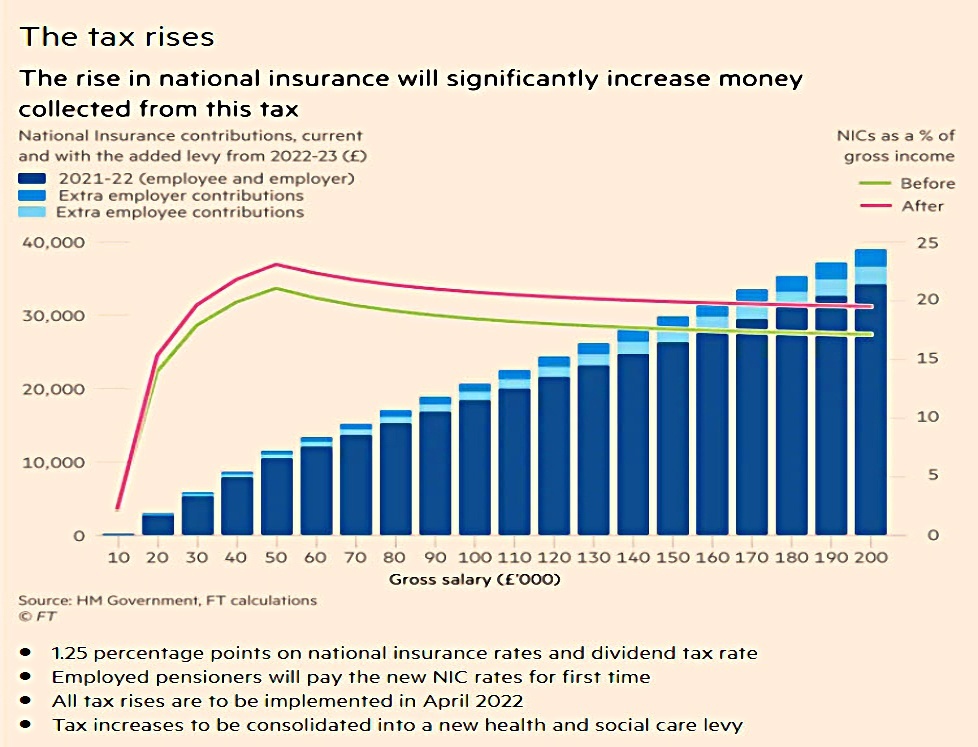
Against any marginal net extra spend by the state, we have the new taxes and benefit cuts:
- 1.5% extra on NIC for everyone, including workers over the state pension age
- A similar 1.5% increase in employers’ NICs
- 1.5% extra on dividends over the £2K annual allowance
- No earnings lock on pensions this year, saving perhaps 4% pa for the rest of time
Apparently, the UK tax take will hit a 70-year high.
- So I don’t think that this new plan will cost youngsters very much at all.
Quick Links
I have eight for you this week, the first four from The Economist:
- The newspaper wrote about a perfect storm for container shipping
- And noted that Britons are snapping up electric vehicles.
- The Economist also said that Britains’ successful startups are surprisingly scattered
- And noted that America’s consumer price inflation had stayed above 5% for August.
- Alpha Architect wondered whether currency momentum is actually factor momentum
- UK Dividend Stocks questioned PayPoint’s future as a dividend growth stock
- Musings on Markets gave their views on ESG investing
- And so did Pragmatic Capitalism.
Until next time.
Mike Rawson
Mike is the owner of 7 Circles, and a private investor living in London. He has been managing his own money for 40 years, with some success.